

Abstract
Identification of biomarkers for predicting radiosensitivity would be useful for administering individualized radiotherapy (RT) to patients with esophageal cancer. The aim of the present study was to evaluate the association between cyclooxygenase-2 (COX-2), X-ray repair cross complementing group 1 (XRCC1), ras association domain family 1 (RASSF1) protein expression, clinicopathological characteristics, radiosensitivity and survival rate in 76 patients with esophageal squamous cell carcinoma (ESCC) who were treated with RT. Positive expression of COX-2, XRCC1 and RASSF1 was identified by immunohistochemistry in 81.6, 52.6 and 59.2% of ESCC cases, respectively. Negative COX-2 expression was associated with tumor (T) stage, node (N) stage, clinical stage and complete response (P<0.05), but not with gender, age, tumor location, differentiation degree, lesion length, progression-free survival (PFS) or overall survival (OS; P>0.05). XRCC1 expression was not associated with the clinicopathological features of ESCC, response to RT, PFS or OS. Positive RASSF1 expression was associated with the clinical stage, response to RT, PFS and OS (P<0.05), but not with gender, age, tumor location, T stage, N stage, differentiation degree or the lesion length (P>0.05). In the subgroup analysis, RASSF1 positive/XRCC1 negative expression was correlated with a longer median OS and PFS (P<0.05). Multivariate analyses revealed that the tumor response and RASSF1 expression were significant prognostic factors. Therefore, positive RASSF1 expression is associated with ESCC RT sensitivity, and may be a useful independent prognostic factor for ESCC.
Keywords: esophageal neoplasms, radiotherapy, cyclooxygenase-2, X-ray repair cross complementing group 1, ras association domain family 1, radiosensitivity, prognosis
Introduction
Esophageal cancer (EC) is an aggressive type of cancer; it is the sixth most common cause of cancer-associated mortality worldwide (1). Approximately half of the cases of EC that are diagnosed each year occur in China (2), and 95% of these cases are esophageal squamous cell carcinoma (ESCC) (3). Radiotherapy (RT) is a curative treatment option for patients with locally advanced ESCC who are not eligible for surgery (4). However, radiosensitization in ESCC patients may affect therapeutic efficacy and, therefore, patient prognosis (5). At present, biomarkers for radiosensitization are not available clinically (5).
While various factors have been evaluated as possible prognostic markers in EC, the data are conflicting and continues to be debated (6). In the present study, three potential factors, cyclooxygenase-2 (COX-2), X-ray repair cross complementing group 1 (XRCC1) and ras association domain family 1 (RASSF1) were selected for evaluation. Elevated COX-2 expression levels are associated with resistance to radiation and reduced overall survival in patients with ESCC who have received RT (7,8). High XRCC1 expression levels are associated with resistance to RT in patients with gastric, ovarian, lung, head and neck cancer (9–11). Previous studies have revealed that the expression of RASSF1 transcripts and the degree of methylation are associated with tumor progression and with the survival rate in patients with ESCC (12,13); however, few studies have been conducted on the radiosensitivity effects of RASSF1 in ESCC. In the present study, a retrospective analysis was performed of the expression patterns of COX-2, XRCC1 and RASSF1 in pre-treatment endoscopic biopsy tissue specimens from patients with ESCC, using immunohistochemical staining. The aim was to identify the predictive association of COX-2, XRCC1 and RASSF1 expression, with the treatment response and survival rate in ESCC.
Materials and methods
The current study was approved by the Ethics Committee of Anyang Cancer Hospital (Anyang, China). Written informed consent was obtained from all patients prior to using the tissue samples in the present study.
Patient selection
This retrospective cohort study included 76 patients who underwent RT at the Anyang Cancer Hospital between June 2008 and December 2011, and had pretreatment endoscopic biopsy tissue specimens available. The median age was 70 years (range, 46–84 years), and the cohort included 42 males (55.3%) and 34 females (44.7%). Prior to treatment, all patients underwent a computed tomography (CT) scan of the chest, abdomen and pelvis, bone scans, a physical examination, esophagography, upper gastrointestinal endoscopy and, if necessary, 18F-fluorodeoxyglucose-positron emission tomography. Patients were staged according to the Tumor-Node-Metastasis system of the American Joint Committee on Cancer (2009) (12) and the International Union Against Cancer (2002) (14) as follows: 6 patients (7.9%) were stage T1; 37 (48.7%) were T2; 33 (43.4%) were T3-4. A total of 54 patients also had lymph node (LN) metastasis: 26 patients were stage I–II; 50 patients were stage III–IV.
Radiotherapy
RT was performed using a LINAC 6-MV X-ray unit at a daily dose of 1.8 or 2 gray (Gy), with five fractions per week. The total radiation dose ranged from 59.4-64 Gy, with a median dose of 59.4 Gy. Further RT boosts were administered to cervical and supraclavicular LNs, depending on the LN size. Definitive radiotherapy was based on three-dimensional-conformal RT or intensity-modulated RT.
Immunohistochemical staining
ESCC tumor tissues and healthy esophageal tissues were observed using endoscopic biopsy to examine the expression profiles of COX-2, XRCC1 and RASSF1. Serial 3 µm thick tissue sections were dewaxed with xylene and rehydrated through graded ethanol. Tissue sections were washed with PBS and incubated in 3% hydrogen peroxide/methanol buffer to block endogenous peroxidase activity. Antigen retrieval was carried out by microwave treatment of the slides in 10 mM citrate buffer (pH 6.0) for 10 min. The tissue sections were incubated with an anti-COX-2 mouse monoclonal primary antibody (#CRM-0151; dilution, 1:50; Shanghai Jiehao Biological Technology Co., Ltd., Shanghai, China), an anti-XRCC1 mouse monoclonal antibody (#ab1838; dilution, 1:100; Abcam, Cambridge, UK) and an anti-RASSF1 rabbit monoclonal antibody (#ab126764; dilution, 1:100; Abcam) at 37°C for 1 h. Following washing with PBS, the tissue sections were incubated with a Histofine Simple Stain MAX PO secondary antibody (#414154F; Nichirei Biosciences, Inc., Tokyo, Japan) at room temperature for 20–30 min; following this, the sections were incubated with diaminobenzidine (#K0012; dilution, 1:20; Shanghai Jiehao Biological Technology Co., Ltd.) at room temperature for 10 min to develop the signals. Finally, the tissue sections were counterstained with hematoxylin (dilution, 1:50; Shanghai Jiehao Biological Technology Co., Ltd.). For the negative control, PBS was used instead of the antibodies.
Evaluation of immunohistochemical staining
Two blinded independent pathologists evaluated immunoreactivity. The tissue sections were observed under a light microscope (Leica DM2000). The cells exhibiting granular brown substances in the cytoplasm or in the membrane were defined as COX-2- and RASSF1-positive. Cells that exhibited staining in the nucleus were defined as XRCC1-positive. Healthy esophageal tissues were stained and used as the controls. Semi-quantitative expression levels were determined by evaluating the staining intensity and the percentage of the stained tumor cells. The staining intensity was graded and adjusted to the internal positive control as follows: 0 point, no staining; 1 point, weak staining; 2 points, moderate staining; 3 points, strong staining. The percentage of positive cells were rated as follows: 0 point, <10% positive cells; 1 point, 11–25% positive cells; 2 points, 26–50% positive cells; 3 points, 51–100% positive cells. Points for staining intensity and the percentage of positive cells were added, and the tissue specimens were classified into two groups according to their overall score: Negative expression for 0–1 point and positive expression for 2–6 points (15).
Evaluation of tumor responses and follow-up
To evaluate tumor responses, an endoscopic biopsy and chest CT were carried out one month following the completion of RT. A follow-up CT and an esophagography were carried out every three months for the first two years, and every six months thereafter. Complete disappearance of the primary tumor and the tumor in regional LNs following radiation was defined as a ‘complete response’, according to the Response Evaluation Criteria in Solid Tumors v1.1 (16).
Statistical analyses
Statistical analyses were carried out using SPSS v19.0 (IBM, SPSS, Armonk, NY, USA). The χ2 test or Fisher's exact test were used to analyze the association between COX-2, XRCC1 and RASSF1 expression, the tumor response to RT and the clinicopathological variables. The correlation between the expression levels of COX-2, XRCC1 and RASSF1 was established by the Spearman's rank-order correlation (raw scores) and Fisher's exact test (grouped). The Kaplan-Meier product-limit method was used to estimate the probability of OS and of progression-free survival (PFS), and the log-rank test was used to estimate any differences. Univariate or multivariate Cox regression analysis was conducted to estimate the crude hazard ratios (HRs), adjusted HRs and the 95% confidence intervals (CIs), with adjustment for potential confounders. All statistical tests were two-sided. P<0.05 was considered to indicate a statistically significant difference.
Results
COX-2, XRCC1 and RASSF1 protein expression in ESCC tissues
As presented in Fig. 1, positive expression of COX-2 and RASSF1 in ESCC tissues manifested as brown staining in the cytoplasm or in the cell membrane, whereas XRCC1 was exclusively expressed in the nuclei. The intensity of COX-2 staining was significantly higher in ESCC tissues compared with in matched healthy tissues; high levels of COX-2 expression were identified in 62/76 (81.6%) of ESCC tissues and 2/20 (10.0%) of healthy tissues (P<0.05). XRCC1 and RASSF1 expression levels were significantly decreased in 40/76 (52.6%) and 45/76 (59.2%) of ESCC tissues, respectively, compared with in the matched healthy tissues (P<0.05); XRCC1 and RASSF1 expression was only observed in 1/20 (5%) of the healthy tissues. As presented in Table I, no significant correlation was observed between the expression of COX-2 and XRCC1, COX-2 and RASSF1 or XRCC1 and RASSF1 (P>0.05).
Figure 1.
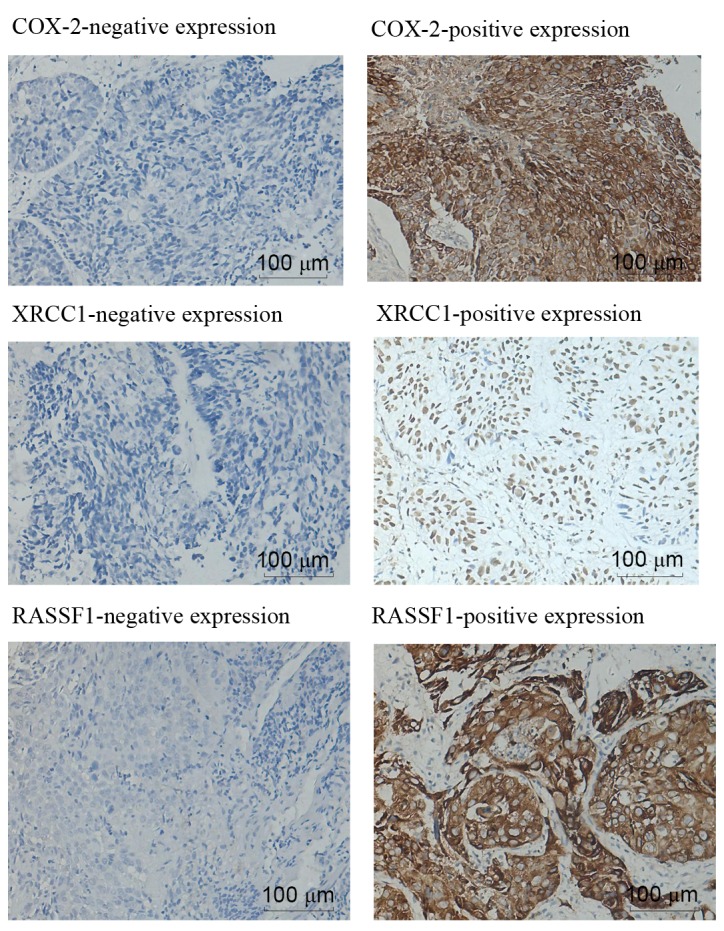
Immunohistochemical staining for COX-2, XRCC1 and RASSF1 in ESCC tissues (magnification, 200x). COX-2, cyclooxygenase-2; XRCC1, X-ray repair cross complementing group 1; RASSF1, ras association domain family 1; ESCC, esophageal squamous cell carcinoma.
Table I.
Rank correlation between COX-2, XRCC1 and RASSF1 protein expression.
| A, Rank correlation between COX-2 and XRCC1 protein expression | |||||
|---|---|---|---|---|---|
| XRCC1 expression | |||||
| COX-2 expression | Negative | Positive | rs | P-value | |
| Negative | 8 | 6 | 0.093 | 0.424 | |
| Positive | 28 | 34 | |||
| B, Rank correlation between COX-2 and RASSF1 protein expression | |||||
| RASSF1 expression | |||||
| COX-2 expression | Negative | Positive | rs | P-value | |
| Negative | 5 | 9 | −0.049 | 0.674 | |
| Positive | 26 | 36 | |||
| C, Rank correlation between XRCC1 and RASSF1 protein expression | |||||
| RASSF1 expression | |||||
| XRCC1 expression | Negative | Positive | rs | P-value | |
| Negative | 15 | 21 | 0.017 | 0.885 | |
| Positive | 16 | 24 | |||
rs, spearman's rank correlation coefficient; COX-2, cyclooxygenase-2; XRCC1, X-ray repair cross-complementing group 1; RASSF1, ras association domain family 1.
Association between COX-2, XRCC1 and RASSF1 expression and the clinicopathological features of ESCC
The correlation between COX-2, XRCC1 and RASSF1 expression patterns and the clinical/pathological factors of ESCC are listed in Table II. The patients with a higher clinical stage (III–IV vs. I–II), T stage (T3-4 vs. T1-2) and the presence of regional LN metastases (N+ vs. N-) exhibited significantly higher expression levels of COX-2 (P=0.021, 0.023 and 0.031, respectively). By contrast, positive COX-2 expression levels were not associated with gender, age, tumor location, grade or tumor size (P>0.05). In addition, the expression of XRCC1 revealed no significant correlation with the clinicopathological features of ESCC (P>0.05). RASSF1 expression exhibited a significant correlation with clinical stage (P=0.014); patients with a higher clinical stage (III–IV vs. I–II) had significantly lower expression levels of RASSF1. However, there was no significant correlation between RASSF1 expression and gender, age, tumor location, T stage, N stage, grade or tumor size (P>0.05).
Table II.
Association between COX-2, XRCC1 and RASSF1 expression and the clinicopathological features of ESCC.
| COX-2 expression | XRCC1 expression | RASSF1 expression | ||||||||
|---|---|---|---|---|---|---|---|---|---|---|
| Characteristics | Number | Positive | χ2 | P-value | Positive | χ2 | P-value | Positive | χ2 | P-value |
| Gender | 2.653 | 0.092 | 1.171 | 0.818 | 0.166 | 0.815 | ||||
| Male | 42 | 37 | 23 | 24 | ||||||
| Female | 34 | 25 | 17 | 21 | ||||||
| Age (years) | 0.000 | 1.000 | 1.900 | 0.251 | 0.490 | 0.641 | ||||
| >70 | 38 | 31 | 23 | 24 | ||||||
| ≤70 | 38 | 31 | 17 | 21 | ||||||
| Tumor location | 0.349 | 1.000 | 2.404 | 0.502 | 0.629 | 0.936 | ||||
| Cervical | 10 | 8 | 6 | 5 | ||||||
| Upper | 20 | 16 | 13 | 12 | ||||||
| Middle | 39 | 32 | 18 | 24 | ||||||
| Lower | 7 | 6 | 3 | 4 | ||||||
| T stage | 7.152 | 0.023a | 0.592 | 0.831 | 0.152 | 1.000 | ||||
| T1 | 6 | 2 | 3 | 4 | ||||||
| T2 | 37 | 25 | 21 | 23 | ||||||
| T3–4 | 33 | 28 | 16 | 20 | ||||||
| N stage | 5.759 | 0.031a | 0.045 | 1.000 | 2.213 | 0.180 | ||||
| N+ | 54 | 32 | 12 | 12 | ||||||
| N- | 22 | 19 | 28 | 39 | ||||||
| Clinical stage | 5.894 | 0.021a | 0.023 | 1.000 | 6.658 | 0.014a | ||||
| I–II | 26 | 16 | 14 | 20 | ||||||
| III–IV | 50 | 43 | 26 | 23 | ||||||
| Grade | 1.260 | 0.626 | 0.523 | 0.850 | 1.298 | 0.503 | ||||
| I | 5 | 3 | 2 | 4 | ||||||
| II | 57 | 45 | 30 | 34 | ||||||
| III | 14 | 11 | 8 | 7 | ||||||
| Tumor size | 0.561 | 0.514 | 0.001 | 0.978 | 0.154 | 0.794 | ||||
| ≤6 cm | 55 | 46 | 29 | 34 | ||||||
| >6 cm | 21 | 16 | 11 | 14 | ||||||
P<0.05; COX-2, cyclooxygenase-2; XRCC1, X-ray repair cross complementing group 1; RASSF1, ras association domain family 1; ESCC, esophageal squamous cell carcinoma; T, tumor; N, node.
Association between COX-2, XRCC1 and RASSF1 expression and the response to radiotherapy
The association between COX-2, XRCC1 or RASSF1 expression and the response to RT 4 weeks following evaluation are presented in Table III. Complete remission (CR) was observed in 48 cases (63.2%), partial response (PR) in 14 (18.4%), stable disease (SD) in 11 (14.5%) and disease progression (PD) in 3 cases (3.9%). The objective response rate (RR=CR + PR) was 81.6%, and these patients were judged to be sensitive to radiation therapy.
Table III.
Association between COX-2, XRCC1 and RASSF1 expression and the tumor response.
| Response (number) | |||||
|---|---|---|---|---|---|
| Categories | CR | Non-CR | χ2 | rs | P-value |
| COX-2 | 6.505 | −0.293 | 0.013a | ||
| Positive | 35 | 27 | |||
| Negative | 13 | 1 | |||
| XRCC1 | 2.415 | Non | 0.094 | ||
| Positive | 22 | 18 | |||
| Negative | 26 | 10 | |||
| RASSF1 | 13.449 | 0.421 | 0.000a | ||
| Positive | 36 | 9 | |||
| Negative | 12 | 19 | |||
P<0.05; CR, complete remission; COX-2, cyclooxygenase-2; XRCC1, X-ray repair cross-complementing group 1; RASSF1, ras association domain family 1.
The CR in the COX-2 negative expression group was 13/14 (92.9%), which was higher than the COX-2 positive expression group (35/62, 56.5%; P=0.013). There was a significant negative correlation between COX-2 expression and the tumor response to RT (rs=−0.293; P=0.010). The CR in the XRCC1 negative expression group was 26/36 (72.2%), whereas only 22/40 (55.0%) of cases in the XRCC1 positive expression group demonstrated CR; however, no significant differences were identified (P>0.05). Finally, the CR in the RASSF1 positive expression group was 36/45 (80.0%), which was significantly higher compared with the RASSF1 negative expression group (38.7%, 12/31; P<0.001). There was also a significant positive correlation between RASSF1 expression and the tumor response to RT (rs=0.421; P<0.001).
Association between survival outcomes and COX-2, XRCC1 and RASSF1 expression
By the time of the final follow-up in October 2015, the median follow-up duration was 19 months (range, 7–78 months). In the complete study, the median OS was 19.60 months, the 5-year OS was 12.0%, the median progression-free survival (PFS) was 16.66 months and the 5-year PFS was 9.0%. The median OS for patients with COX-2-positive expression and COX-2-negative expression was 18.0 months (95% CI: 14.281–21.719 months) and 20.0 months (95% CI: 11.180–28.820 months), respectively (χ2=0.229; P=0.633; Fig. 2A). Similarly, no significant difference was identified in the median OS between the COX-2-positive expression and COX-2-negative expression groups (18.0 vs. 22.0 months; χ2=0.40; P=0.526; Fig. 2B). Conversely, patients with positive RASSF1 expression had an increased median OS (31.0 months; 95% CI: 19.17–42.83 months) compared with patients with negative RASSF1 expression (15.0 months; 95% CI: 12.27–17.73 months; χ2=19.90; P<0.001; Fig. 2C). Patients with negative RASSF1 expression had a poorer median PFS compared with patients with positive expression (11.0 months; 95% CI: 7.98–14.02 months vs. 21.0 months; 95% CI: 15.70–26.30; χ2=16.42; P<0.001; Fig. 2D). Conversely, no significant difference was identified in the median PFS of the patients according to COX-2 and XRCC1 expression levels (P>0.05). When stratified by regimens, the subgroup analysis revealed that RASSF1 positive/XRCC1 negative expression levels were correlated with a longer median OS (34.0 vs. 17.0 months; P=0.024; Fig. 2E) and median PFS (24.0 vs. 15.0 months; P=0.044; Fig. 2F). In addition, those with a higher CR had an improved median OS and median PFS (P<0.001; Fig. 2G and H).
Figure 2.

Kaplan-Meier curves (correlation) for patients with ESCC treated by RT, according to COX-2, XRCC1 and RASSF1 expression. (A) Correlation between OS and COX-2 expression. (B) Correlation between OS and XRCC1 expression. (C) Correlation between OS and RASSF1 expression. (D) Correlation between PFS and RASSF1 expression. (E) Correlation between OS and RASSF1 positive/XRCC1 negative expression. (F) Correlation between PFS and RASSF1 positive/XRCC1 negative expression. (G) Correlation between OS and tumor response. (H) Correlation between PFS and tumor response. COX-2, cyclooxygenase-2; XRCC1, X-ray repair cross complementing group 1; RASSF1, ras association domain family 1; ESCC, esophageal squamous cell carcinoma; RT, radiotherapy; OS, overall survival; PFS, progression-free survival.
Univariate regression analyses demonstrated that tumor response, RASSF1 expression and RASSF1 positive/XRCC1 negative expression significantly affected the treatment outcomes of radiation therapy (P<0.05). Other potential factors affecting overall survival (age, gender, tumor site, T stage, N stage, clinical stage, grade and tumor length) revealed no significant correlations (P>0.05). Cox multivariate analyses revealed that the tumor response (OS, HR=3.110; 95% CI: 1.792–5.399; P<0.001; PFS, HR=3.029; 95% CI: 1.719–5.340; P<0.001) and RASSF1 expression (OS HR=3.374; 95% CI: 1.806–6.300; P<0.001; PFS, HR=2.634; 95% CI: 1.439–4.819; P=0.002) were significant prognostic factors (Table IV).
Table IV.
Univariate and multivariate analysis for mortality (OS) and progression or mortality (PFS) endpoints in the overall study population.
| Univariate (P-value) | Multivariate [P-value, HR (95% CI)] | |||
|---|---|---|---|---|
| Variables | PFS | OS | PFS | OS |
| Treatment response (CR vs. non-CR) | <0.001a | <0.001a | <0.001a, 3.029 (1.719–5.340) | <0.001a, 3.110 (1.792–5.399) |
| COX-2 (positive vs. negative) | 0.611 | 0.650 | ns | ns |
| XRCC1 (positive vs. negative) | 0.702 | 0.526 | ns | ns |
| RASSF1 (positive vs. negative) | <0.001a | <0.001a | 0.002a, 2.634 (1.439–4.819) | <0.001a, 3.374 (1.806–6.300) |
| RASSF1 positive and XRCC1 negative (yes vs. no) | 0.044a | 0.024a | 0.651, 0.849 (0.417–1.729) | 0.600, 0.825 (0.402–1.693) |
P<0.05; COX-2, cyclooxygenase-2; XRCC1, X-ray repair cross complementing group 1; RASSF1, ras association domain family 1; ESCC, esophageal squamous cell carcinoma; RT, radiotherapy; OS, overall survival; PFS, progression-free survival; CI, confidence interval; CR, complete response; HR, hazard ratio; ns, not statistically significant.
Discussion
Although findings from previous molecular biology studies have improved general understanding of the pathogenesis of ESCC, appropriate biomarkers for high-risk population screening, clinical diagnosis and prognosis have not yet been identified (5). The current study demonstrated that COX-2 expression levels were significantly increased in ESCC, and that the expression levels were correlated with advanced clinical stage, T stage, the presence of regional LN metastases and a poor response to RT, but that they were not associated with survival (OS or PFS). The present study also revealed that XRCC1 and RASSF1 expression levels were significantly reduced in ESCC tissues vs. healthy tissues, indicating a potentially important role for these genes in ESCC. No significant correlation was identified between XRCC1 expression and the clinicopathological features, the response to RT, PFS or OS. Conversely, positive RASSF1 expression exhibited a significant correlation with lower clinical stage, an improved response to RT and increased rates of PFS and OS (P<0.05). The subgroup analysis also indicated that RASSF1 positive/XRCC1 negative expression levels correlated with a longer median OS and median PFS.
Similar to previous studies, the results of the present study demonstrated a significant increase (81.6%) in COX-2 expression levels in ESCC tissues (17,18). Patients with a higher clinical stage (III–IV), T stage (T3-4) and with regional LN metastases exhibited significantly higher expression levels of COX-2 (P<0.05). By contrast, positive COX-2 expression levels were not determined to be associated with gender, age, tumor location, grade or size (P>0.05). COX is a key enzyme for prostanoid biosynthesis and is involved in the inflammatory response, tumorigenesis and tumor progression (19). In particular, the overexpression of COX-2 and prostaglandins is associated with the development of various types of cancer (20). Similar to the results of the present study, marked overexpression of COX-2 has previously been observed in esophageal squamous epithelium in human EC, but not in healthy tissues (21). Previous studies have reported that COX-2 overexpression is significantly associated with a poor response to RT and a poor OS (7,8). The results of the present study determined that COX-2 expression levels were significantly associated with a poor response to RT, but did not significantly affect OS. The exact mechanism underlying how COX-2 influences tumor sensitivity to RT remains unclear. Apoptosis suppression may be one possibility; when there are high expression levels of COX-2 in ESCC tissues the tumor cells may not be sensitive to the apoptosis signal, resulting in abnormal proliferation (7). The present study demonstrated that COX-2 expression does not significantly affect OS; therefore, it may not be a useful biomarker in RT treated ESCC.
The present study revealed significantly lower expression levels of XRCC1 proteins in ESCC tissues vs. healthy tissues. XRCC1 facilitates efficient DNA damage processing, which is particularly pertinent in patients undergoing chemoradiation (22). This is mitigated to a certain extent by non-specific DNA repair systems; therefore, high XRCC1 expression levels may increase the DNA repair capacity of tumor cells, leading to an increased tolerance to DNA damage induced by chemoradiation (22). The role of XRCC1 in the prognosis and susceptibility of EC has previously been examined (15). XRCC1 gene polymorphisms may predict the response to cisplatin based neoadjuvant chemoradiotherapy in patients with EC (23). Polymorphisms of the XRCC1 gene care able to alter the phenotype of the XRCC1 protein and cause a deficiency in its DNA repair mechanism, which is significantly associated with patient survival rate (24). However, a number of studies have investigated XRCC1 expression in human tumors; low XRCC1 expression levels were reported in pancreatic cancer tissues and may be used to predict treatment outcomes following bladder cancer RT (25,26). Additionally, Ang et al (27) previously evaluated the association between XRCC1 protein expression in patients with head and neck squamous cell carcinoma (HNSCC) and the clinical outcomes. Patients with HNSCC and high XRCC1 expression levels had a poorer OS and PFS; among those receiving chemoradiation, high XRCC1 protein expression levels were independently associated with a poorer survival rate (27). Conversely, Ge et al (15) revealed that patients with ESCC and low expression levels of XRCC1 had a similar survival rate to patients with high XRCC1 protein expression levels. Although this may have been due to the small number of patients examined in the aforementioned study, the current study also revealed no significant correlation between XRCC1 expression levels and the clinicopathological features, the response to RT, PFS or OS. Therefore, the results indicate that XRCC1 is not a useful indicator of RT response and prognosis in ESCC.
RASSF1 expression levels were significantly decreased in ESCC compared with the healthy tissues. Other studies have exhibited decreased expression levels of RASSF1 in certain types of tumor cells, including lymphoma, pulmonary carcinoma and melanoma, suggesting an association between reduced expression of the RASSF1 gene and tumor oncogenesis (28). In addition, there is increasing evidence that RASSF1 is a tumor suppressor, able to influence cell-cycle events, microtubule stability, apoptosis and autophagy (29). Patients with lower RASSF1 expression levels exhibit a higher probability of recurrence, indicating an unfavorable prognosis (30). In the present study, patients with a higher clinical stage (III–IV) had significantly lower expression levels of RASSF1. However, no significant correlation was identified between RASSF1 expression and gender, age, tumor location, T stage, N stage, grade or tumor size. In addition, RASSF1 positive/XRCC1 negative expression in ESCC correlated with a longer median OS and PFS. Positive expression of RASSF1 was significantly associated with an improved response to RT, PFS and OS, which may be used to predict the survival rate of patients with ESCC prior to the administration of RT. Multivariate analyses revealed that the tumor response and RASSF1 expression were significant prognostic factors in ESCC. Therefore, positive RASSF1 expression may be used as a biomarker for predicting the survival rate of ESCC patients prior to RT.
In conclusion, the positive expression of COX-2 is significantly associated with a poor response to RT, but is not associated with the survival rate in ESCC. No significant correlation was identified between XRCC1 expression and ESCC clinicopathological data. The tumor response and RASSF1 expression were determined to be significant prognostic factors in ESCC. However, as the present study was retrospective, the results are limited by the small sample size and allow only preliminary conclusions to be made. Future prospective studies with a larger sample size are required in order to confirm the predictive significance of the expression of these proteins.
Acknowledgements
The present study was funded by The National Natural Science Foundation of China (grant nos. 81201945 and 81502247), The Youth Program of Tianjin Nature Science Foundation (grant no. 13JCQNJC10700) and The Anyang Science Foundation of Henan province (grant no. 2014).
References
- 1.Ferlay J, Soerjomataram I, Dikshit R, Eser S, Mathers C, Rebelo M, Parkin DM, Forman D, Bray F. Cancer incidence and mortality worldwide: Sources, methods and major patterns in GLOBOCAN 2012. Int J Cancer. 2015;136:E359–E386. doi: 10.1002/ijc.29210. [DOI] [PubMed] [Google Scholar]
- 2.Holmes RS, Vaughan TL. Epidemiology and pathogenesis of esophageal cancer. Semin Radiat Oncol. 2007;17:2–9. doi: 10.1016/j.semradonc.2006.09.003. [DOI] [PubMed] [Google Scholar]
- 3.Chen W, He Y, Zheng R, Zhang S, Zeng H, Zou X, He J. Esophageal cancer incidence and mortality in China, 2009. J Thorac Dis. 2013;5:19–26. doi: 10.3978/j.issn.2072-1439.2013.01.04. [DOI] [PMC free article] [PubMed] [Google Scholar]
- 4.D'Journo XB, Thomas PA. Current management of esophageal cancer. J Thorac Dis. 2014;6(Suppl 2):S253–S264. doi: 10.3978/j.issn.2072-1439.2014.04.16. [DOI] [PMC free article] [PubMed] [Google Scholar]
- 5.Wu S, Wang X, Chen JX, Chen Y. Predictive factors for the sensitivity of radiotherapy and prognosis of esophageal squamous cell carcinoma. Int J Radiat Biol. 2014;90:407–413. doi: 10.3109/09553002.2014.894649. [DOI] [PubMed] [Google Scholar]
- 6.Nam TK, Lee JH, Cho SH, Chung IJ, Ahn SJ, Song JY, Yoon MS, Chung WK, Nah BS. Low hMLH1 expression prior to definitive chemoradiotherapy predicts poor prognosis in esophageal squamous cell carcinoma. Cancer Lett. 2008;260:109–117. doi: 10.1016/j.canlet.2007.10.026. [DOI] [PubMed] [Google Scholar]
- 7.Huang WZ, Fu JH, Wang DK, Hu Y, Liu MZ, Yang H, Feng YF, Zheng B, Wang G, Luo KJ, et al. Overexpression of cyclooxygenase-2 is associated with chemoradiotherapy resistance and prognosis in esophageal squamous cell carcinoma patients. Dis Esophagus. 2008;21:679–684. doi: 10.1111/j.1442-2050.2008.00824.x. [DOI] [PubMed] [Google Scholar]
- 8.Yoon MS, Nam TK, Lee JS, Cho SH, Song JY, Ahn SJ, Chung IJ, Jeong JU, Chung WK, Nah BS. VEGF as a predictor for response to definitive chemoradiotherapy and COX-2 as a prognosticator for survival rate in esophageal squamous cell carcinoma. J Korean Med Sci. 2011;26:513–520. doi: 10.3346/jkms.2011.26.4.513. [DOI] [PMC free article] [PubMed] [Google Scholar]
- 9.Wang S, Wu X, Chen Y, Zhang J, Ding J, Zhou Y, He S, Tan Y, Qiang F, Bai J, et al. Prognostic and predictive role of JWA and XRCC1 expressions in gastric cancer. Clin Cancer Res. 2012;18:2987–2996. doi: 10.1158/1078-0432.CCR-11-2863. [DOI] [PubMed] [Google Scholar]
- 10.Abdel-Fatah T, Sultana R, Abbotts R, Hawkes C, Seedhouse C, Chan S, Madhusudan S. Clinicopathological and functional significance of XRCC1 expression in ovarian cancer. Int J Cancer. 2013;132:2778–2786. doi: 10.1002/ijc.27980. [DOI] [PubMed] [Google Scholar]
- 11.Vaezi A, Feldman CH, Niedernhofer LJ. ERCC1 and XRCC1 as biomarkers for lung and head and neck cancer. Pharmgenomics Pers Med. 2011;4:47–63. doi: 10.2147/PGPM.S20317. [DOI] [PMC free article] [PubMed] [Google Scholar]
- 12.Haluskova J, Lachvac L, Nagy V. The investigation of GSTP1, APC and RASSF1 gene promoter hypermethylation in urine DNA of prostate-diseased patients. Bratisl Lek Listy. 2015;116:79–82. doi: 10.4149/bll_2015_014. [DOI] [PubMed] [Google Scholar]
- 13.Perez-Janices N, Blanco-Luquin I, Torrea N, Liechtenstein T, Escors D, Cordoba A, Vicente-Garcia F, Jauregui I, De La Cruz S, Illarramendi JJ, et al. Differential involvement of RASSF2 hypermethylation in breast cancer subtypes and their prognosis. Oncotarget. 2015;6:23944–23958. doi: 10.18632/oncotarget.4062. [DOI] [PMC free article] [PubMed] [Google Scholar]
- 14.Sobin LH, Wittekind CH. TNM classification of malignant tumours. New York: Wildy-Liss; 2002. [Google Scholar]
- 15.Ge H, Lu Y, Chen Y, Zheng X, Wang W, Yu J. ERCC1 expression and tumor regression predict survival in esophageal squamous cell carcinoma patients receiving combined trimodality therapy. Pathol Res Pract. 2014;210:656–661. doi: 10.1016/j.prp.2014.06.013. [DOI] [PubMed] [Google Scholar]
- 16.Eisenhauer EA, Therasse P, Bogaerts J, Schwartz LH, Sargent D, Ford R, Dancey J, Arbuck S, Gwyther S, Mooney M, et al. New response evaluation criteria in solid tumours: Revised RECIST guideline (version 1.1) Eur J Cancer. 2009;45:228–247. doi: 10.1016/j.ejca.2008.10.026. [DOI] [PubMed] [Google Scholar]
- 17.Gomes TS, Noguti J, Forones NM, Lima FO, Dobo C, Junior JA Fernandes, Oshima CT, Ribeiro DA. Correlation analysis of c-myc, p21 (WAF/CIP1), p53, C-erbB-2 and COX-2 proteins in esophageal squamous cell carcinoma. Pathol Res Pract. 2013;209:6–9. doi: 10.1016/j.prp.2012.08.011. [DOI] [PubMed] [Google Scholar]
- 18.Zhai YC, Dong B, Wei WQ, He Y, Li XQ, Cormier RT, Wang W, Liu F. Overexpression of phospholipase A2 Group IIA in esophageal squamous cell carcinoma and association with cyclooxygenase-2 expression. Asian Pac J Cancer Prev. 2014;15:9417–9421. doi: 10.7314/APJCP.2014.15.21.9417. [DOI] [PubMed] [Google Scholar]
- 19.Greenhough A, Smartt HJ, Moore AE, Roberts HR, Williams AC, Paraskeva C, Kaidi A. The COX-2/PGE2 pathway: Key roles in the hallmarks of cancer and adaptation to the tumour microenvironment. Carcinogenesis. 2009;30:377–386. doi: 10.1093/carcin/bgp014. [DOI] [PubMed] [Google Scholar]
- 20.Misra S, Sharma K. COX-2 signaling and cancer: New players in old arena. Curr Drug Targets. 2014;15:347–359. doi: 10.2174/1389450115666140127102915. [DOI] [PubMed] [Google Scholar]
- 21.Yu HP, Shi LY, Lu WH, Su YH, Li YY, Xu SQ. Expression of cyclooxygenase-2 (COX-2) in human esophageal cancer and in vitro inhibition by a specific COX-2 inhibitor, NS-398. J Gastroenterol Hepatol. 2004;19:638–642. doi: 10.1111/j.1440-1746.2004.03345.x. [DOI] [PubMed] [Google Scholar]
- 22.Horton JK, Watson M, Stefanick DF, Shaughnessy DT, Taylor JA, Wilson SH. XRCC1 and DNA polymerase beta in cellular protection against cytotoxic DNA single-strand breaks. Cell Res. 2008;18:48–63. doi: 10.1038/cr.2008.7. [DOI] [PMC free article] [PubMed] [Google Scholar]
- 23.Warnecke-Eberz U, Vallböhmer D, Alakus H, Kütting F, Lurje G, Bollschweiler E, Wienand-Dorweiler A, Drebber U, Hölscher AH, Metzger R. ERCC1 and XRCC1 gene polymorphisms predict response to neoadjuvant radiochemotherapy in esophageal cancer. J Gastrointest Surg. 2009;13:1411–1421. doi: 10.1007/s11605-009-0881-z. [DOI] [PubMed] [Google Scholar]
- 24.Wu X, Gu J, Wu TT, Swisher SG, Liao Z, Correa AM, Liu J, Etzel CJ, Amos CI, Huang M, et al. Genetic variations in radiation and chemotherapy drug action pathways predict clinical outcomes in esophageal cancer. J Clin Oncol. 2006;24:3789–3798. doi: 10.1200/JCO.2005.03.6640. [DOI] [PubMed] [Google Scholar]
- 25.Crnogorac-Jurcevic T, Efthimiou E, Nielsen T, Loader J, Terris B, Stamp G, Baron A, Scarpa A, Lemoine NR. Expression profiling of microdissected pancreatic adenocarcinomas. Oncogene. 2002;21:4587–4594. doi: 10.1038/sj.onc.1205570. [DOI] [PubMed] [Google Scholar]
- 26.Sak SC, Harnden P, Johnston CF, Paul AB, Kiltie AE. APE1 and XRCC1 protein expression levels predict cancer-specific survival following radical radiotherapy in bladder cancer. Clin Cancer Res. 2005;11:6205–6211. doi: 10.1158/1078-0432.CCR-05-0045. [DOI] [PubMed] [Google Scholar]
- 27.Ang MK, Patel MR, Yin XY, Sundaram S, Fritchie K, Zhao N, Liu Y, Freemerman AJ, Wilkerson MD, Walter V, et al. High XRCC1 protein expression is associated with poorer survival in patients with head and neck squamous cell carcinoma. Clin Cancer Res. 2011;17:6542–6552. doi: 10.1158/1078-0432.CCR-10-1604. [DOI] [PMC free article] [PubMed] [Google Scholar]
- 28.Alkatan HM, Al-Harkan DH, Al-Mutlaq M, Maktabi A, Elkhamary SM. Epithelial lacrimal gland tumors: A comprehensive clinicopathologic review of 26 lesions with radiologic correlation. Saudi J Ophthalmol. 2014;28:49–57. doi: 10.1016/j.sjopt.2013.12.007. [DOI] [PMC free article] [PubMed] [Google Scholar]
- 29.Gordon M, El-Kalla M, Baksh S. RASSF1 polymorphisms in cancer. Mol Biol Int. 2012;2012:365213. doi: 10.1155/2012/365213. [DOI] [PMC free article] [PubMed] [Google Scholar]
- 30.Zeng CH, Guo B, Chen J, He WM, Luo QL. Expression profile of tumor suppressor gene RASSF1 in lacrimal gland carcinoma. Genet Mol Res. 2015;14:6993–6998. doi: 10.4238/2015.June.26.8. [DOI] [PubMed] [Google Scholar]