Abstract
Objective
In rodent osteoarthritis models, behavioral changes are often subtle and require highly sensitive methods to detect these changes. Gait analysis is one assay that may provide sensitive, quantitative measurement of these behavioral changes1. To increase detection sensitivity of gait assessments relative to spatiotemporal gait collection alone, we combined our spatiotemporal and dynamic gait collection systems. Using this combined system, gait was assessed in the rat medial meniscus transection model and monoiodoacetate injection model of knee osteoarthritis.
Design
36 male Lewis rats were separated into medial meniscus transection (n=8), medial collateral ligament transection (n=8), skin incision (n=4), monoiodoacetate injection (n=8), and saline injection (n=8) groups. After initiation of osteoarthritis, gait data were collected weekly in each group out to 4 weeks.
Results
The medial meniscus transection and monoiodoacetate injection models produced unique pathologic gait profiles, with medial meniscus transection animals developing a shuffling gait and monoiodoacetate injection animals exhibiting antalgic gait. Spatiotemporal changes were also observed in the medial meniscus transection model at week 1 (p<0.01), but were not observed in the monoiodoacetate injection model until week 3 (p<0.01). Dynamic gait changes were observed in both models as early as 1 week post-surgery (p<0.01).
Conclusion
Combined analysis of spatiotemporal and dynamic gait data increased detection sensitivity for gait modification in two rat osteoarthritis models. Analyzing the combined gait data provided a robust characterization of the pathologic gait produced by each model. Furthermore, this characterization revealed different patterns of gait compensations in two common rat models of knee osteoarthritis.
Keywords: osteoarthritis, preclinical rodent models, gait analysis, behavioral analysis, monoiodoacetate, medial meniscus transection
Introduction
Preclinical animal models are the basis for research and development of many clinical treatments. For some diseases, the preclinical model is analogous to a clinical condition, and the efficacy of a treatment, or lack thereof, is apparent. Unfortunately, translation of osteoarthritis (OA) therapies is complicated by unknown and diverse etiologies, as well as complex relationships between joint degeneration and OA-related pain and disability.
OA is characterized by progressive cartilage breakdown and maladaptive repair throughout the joint, which may ultimately lead to pain and disability. Clinical diagnosis for OA primarily revolves around patient reported pain2–4, and clinical treatments are primarily palliative care for painful symptoms. Meanwhile, preclinical OA research has heavily focused on prevention of cartilage loss. However, the severity of cartilage damage does not correlate to patient reports of pain5; thus, a disparity in focus, or a conflict in defining efficacious treatments between the clinic and preclinical research, has contributed to challenges in successful OA therapy development.
Fortunately, preclinical OA research is shifting to include pain measures in the evaluation of emerging OA therapies6–8. However, quantification of pain and disability in animals is challenging9–11. Significant attention has been given to the development of pain assessments8,9,12–14, and while some of these assessments have been useful for OA models, pain and disability related to OA are often very subtle in rodents. Thus, many behavioral assays developed for acute pain may not translate to OA, and new behavioral techniques may be needed.
Toward this goal, gait analysis may be used as a sensitive quantitative measure of behavioral changes related to knee OA1. While past methods to quantify spatiotemporal gait patterns in rodent OA models have described compensatory behaviors, direct measure of ground reaction forces may provide an even more sensitive measurement of gait compensations1,15,16. To this end, our group has developed a gait analysis system called the Experimental Dynamic Gait Arena for Rodents (EDGAR). EDGAR allows simultaneous characterization of spatiotemporal and dynamic gait parameters in a single trial. By combining spatiotemporal and dynamic gait analysis, we hypothesized an increase in detection sensitivity for behavioral changes could be achieved in common OA models. To test EDGAR, the behavioral consequences of joint disease were investigated in a surgically- and chemically-induced model of knee OA.
Methods
Experimental Design
All experiments were conducted under approved Institutional Animal Care and Use Committee protocols at the University of Florida. Experiments conducted maintained uniform testing schedules for all animals, regardless of group. A total of 36 male Lewis rats (3 months/200–250 g, Charles Rivers Laboratories, Wilmington, MA, USA) were used. Animals were acclimated to behavioral equipment for one week prior to study participation. Animals were randomly separated into medial meniscus transection (MMT+MCLT)17 (n=8), medial collateral ligament transection (MCLT) (n=8), skin incision sham (n=4), monoiodoacetate (MIA) injection18–23 (n=8), and saline injection sham (n=8). MCLT alone was included to resolve gait compensations associated with medial collateral ligament-related joint instability, as the meniscal injury simulated in this study required transection of the medial collateral ligament prior to meniscal transection. Animals underwent weekly behavioral testing for 4 weeks post-surgery and were then euthanized for histological characterization.
EDGAR Design
EDGAR is a modification of previous gait arenas developed by our group15,16,24. Technical and build specifications for EDGAR are provided as an open-source resource at www.orthobme.com/resources.html. EDGAR was developed to combine spatiotemporal and dynamic gait data collection, which enables spatiotemporal gait data to be associated with ground reaction forces from specific steps.
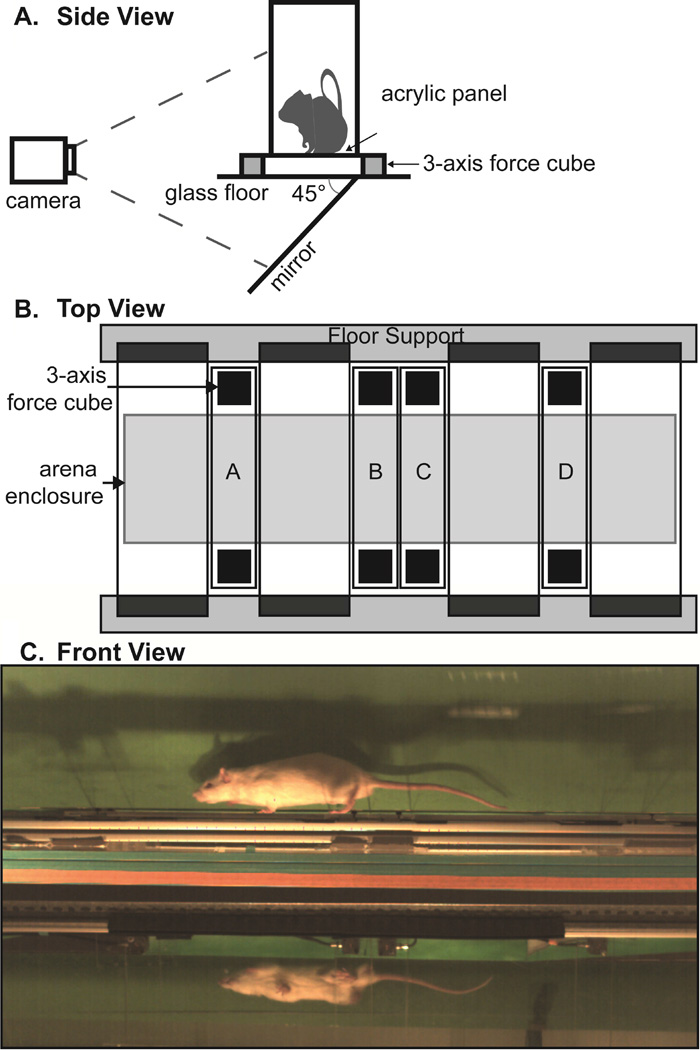
To increase the accuracy of spatiotemporal data collection, EDGAR requires an unobstructed view of the lateral and ventral planes of the animal, achieved by placing a 45° mirror below the arena floor (Fig. 1a). To allow simultaneous dynamic data collection, a secondary floor was constructed from a series of transparent instrumented panels and non-instrumented floor sections (Fig. 1b). Instrumented panels were placed between non-instrumented sections, which were set on damping material placed on a rigid frame. Each instrumented panel measures 3.2 cm by 24 cm, with 3-component force-links (Type 9317B Kistler, Winterthur, Switzerland) mounted on either end of the panel and centered along the short edge. The force-link outputs were summed using 4 gang connectors (107B Kistler, Winterthur, Switzerland), providing a single set of force data from each panel. Instrumented panels were calibrated prior to use by placing weights (20, 50, 100, 200, and 500 g) on each panel and collecting voltage data via custom LabVIEW code. These data were used to verify the linear behavior of the force-links and determine a gram-force conversion factor for each panel. The arena enclosure measures 14 cm wide by 150.5 cm long by 25.5 cm tall with a removable lid. An image of a rat in EDGAR is provided in Figure 1C. Spatiotemporal characteristics were captured with a high-speed camera at 250 fps (M3 Redlake, San Diego, CA, USA). Ground reaction forces were collected via custom LabVIEW code, and hind-paw strikes contacting the instrumented panels were verified via video.
Figure 1.
Illustration of EDGAR setup; 1A: side view of EDGAR with mirror and camera orientation; 1B: floor design with instrumented panels A–D; 1C: single frame from an animal trial video.
Surgery
Animals were placed in a 3–5% isoflurane induction chamber, with anesthesia subsequently maintained via mask inhalation of 3% isoflurane. The right hind limb was aseptically prepared for surgery using povidone-iodine and alcohol, with a final preparation of povidone-iodine. For any procedure, animals were administered perioperative buprenorphine maintained to 48 h post-operation.
For the MMT+MCLT, MCLT, and skin incision groups, a 1–2 cm midline skin incision was made along the medial aspect of the animal's knee. The skin was retracted and the medial collateral ligament was exposed. For skin incision, the skin was then closed (n=4). In MCLT and MMT+MCLT animals, the medial collateral ligament was transected. For MCLT, the skin was then closed (n=8). For MMT+MCLT animals, the knee was moved into a valgus orientation to allow access to the central aspects of the medial meniscus, which was grasped with forceps and cut radially (n=8). The skin was closed with 5-0 nylon sutures for all surgeries.
For MIA and saline injection, a 29-gauge needle was inserted through the patellar ligament, guided behind the patella, and directed into the femoral groove. For MIA injection, 3 mg of MIA suspended in 25 µL of 1× phosphate buffered saline (PBS) was delivered (n=8). For saline animals, 25 µL of PBS alone was delivered (n=8). After injection, the needle was withdrawn and sterile gauze pressed on the injection site to ensure bleeding had stopped.
Gait Analysis
Animals underwent weekly gait testing for 4 weeks, with animals tested once per week over two days. To minimize testing effects due to time of day or time from last test, animals were tested in random order.
Gait testing was conducted as follows: each rat was individually placed in the arena and allowed to explore until 16 trials were collected or for 20 minutes. Trials in which the rat crossed the arena at approximately constant velocity and contacted at least one instrumented panel with a hind paw were kept.
Spatiotemporal gait data were processed with the method described previously by our group24. Briefly, videos were digitized by hand using the DLTdataviewer subroutine for MATLAB25. Digitization data were then processed to identify velocity, stance times, step width, stride length, spatial gait symmetry, temporal gait symmetry, and stance time imbalance, as described in our methodological review1. Only the hind paws were considered for both spatiotemporal and dynamic gait data.
Ground reaction force outputs were processed through a custom MATLAB code, which isolates segments of data containing the desired steps. From ground reaction force data, peak vertical force and vertical impulse were determined. Data for each step was maintained with identifiers for foot (left or right), animal, trial, and time point, such that these data could later be associated with spatiotemporal outputs.
Histology
After 4 weeks, animals were euthanized and hind limbs were collected for histology. Collected joints were fixed in 10% neutral buffered formalin for 48 h, decalcified in Cal-Ex Decalcifier (Fisher Scientific, Pittsburg, PA, USA) for 3 weeks, and then paraffin embedded using vacuum infiltration (Tissue-Tek VIP 6, Sakura Finetek, Torrance, CA, USA). Frontal sections were taken at 10 µm starting after the anterior horn of the medial meniscus through to the posterior horn of the medial meniscus. Sections representing the loading region were stained with toluidine blue.
Statistics
To correct for the velocity covariate, stride length, step width, stance times, peak vertical force, and vertical impulse residual changes were calculated using skin incision shams as the control group for MCLT and MMT+MCLT group animals (See our methodological review1 or prior work24). Saline shams were used as a control group for MIA group animals. Differences between surgical groups, ipsilateral and contralateral feet, and across time were analyzed using multifactorial ANOVAs. Planned comparisons were conducted using Tukey’s HSD post hoc test. To assess changes from expected gait profiles (symmetries ≠ 0.5, stance time imbalance ≠ 0, or residuals ≠ 0), non-parametric sign tests were performed. For all statistics, Statistica was used and a p-value<0.05 was accepted as significant.
Results
Model Confirmation
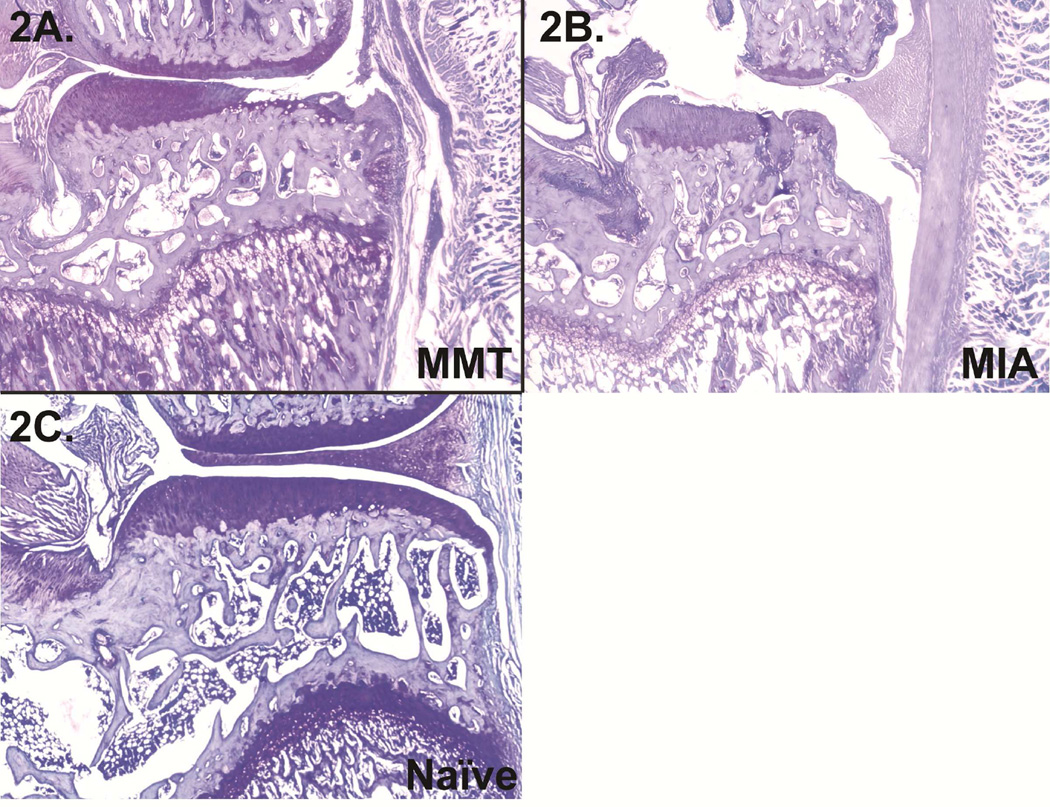
Histology was used to verify models were initiated successfully. MMT+MCLT animals developed cartilage lesions, pre-osteophytes, and some reduced staining of the articular cartilage (Fig. 2a), and MIA animals presented widespread cartilage loss and collapse of the articular surface (Fig. 2b); a representative healthy knee is provided in Fig. 5c.
Figure 2.
2A: Right knee from an MMT group animal 4 weeks post-operation with a large lesion and some reduced staining of the articular cartilage; 2B: right knee from an MIA animal 4 weeks post-injection with significant collapse of the articular surface; 2C: naïve knee for reference.
Figure 5.
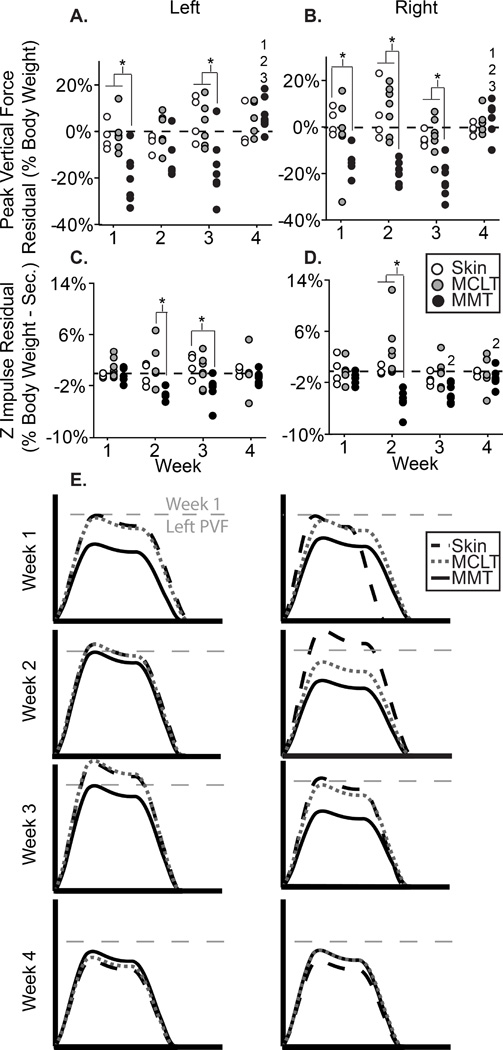
5A–D: Peak vertical force (A–B) and z impulse (C–D) residual for the left and right feet of all animals in the MMT, MCLT, and skin incision groups; 5E: visual representation of MMT group dynamic changes, where the x-axis represents stance time and the y-axis represents vertical force. *: difference between indicated groups; 1–3: difference from indicated week.
MMT+MCLT Model
Both spatiotemporal and dynamic gait abnormalities were detected in MMT+MCLT animals. Velocity-corrected spatial gait parameters are presented in Fig. 3, temporal parameters in Fig. 4, and dynamic parameters in Fig. 5.
Figure 3.
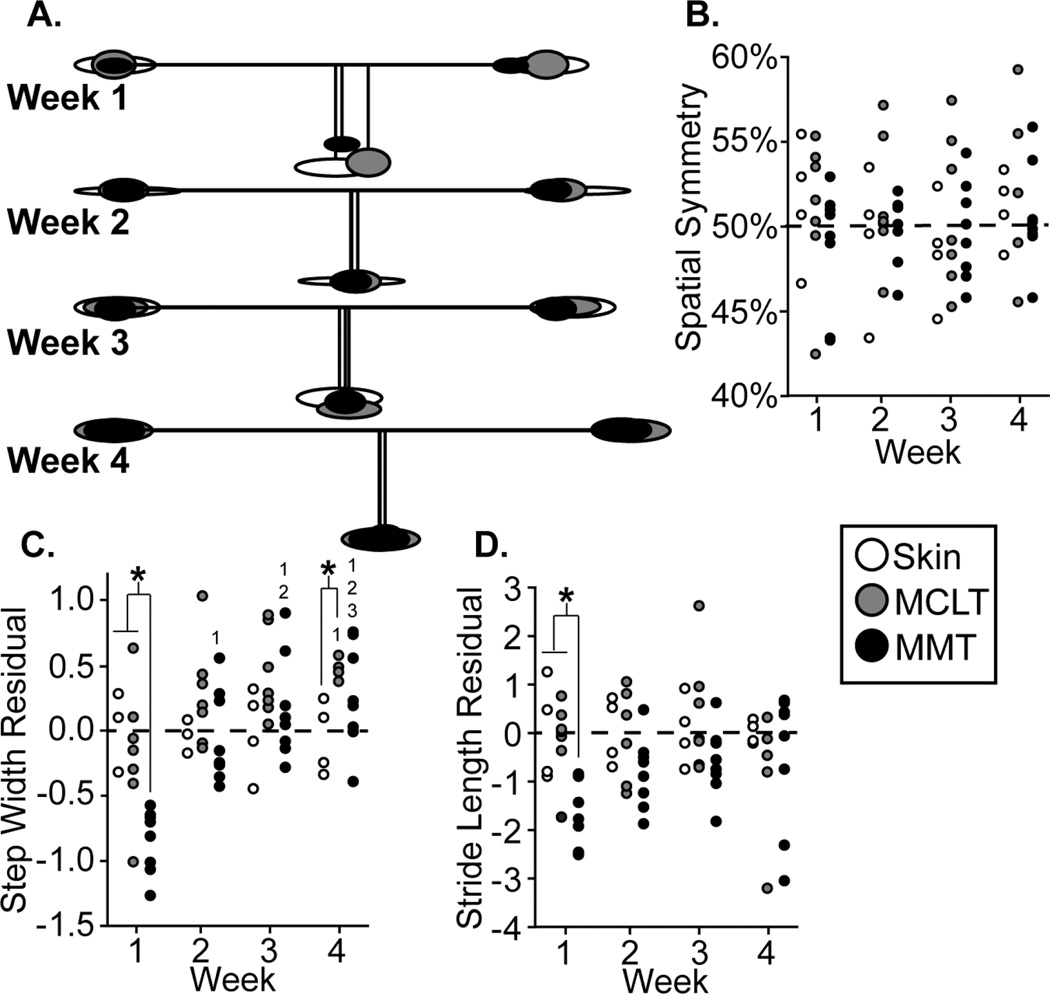
3A: Visual representation of MMT group spatial changes relative to control, where ellipse size indicates variance, horizontal lines indicate stride length, and vertical lines indicate step widths; 3B–D: spatial symmetry, step width residuals, and stride length residuals of all animals in the MMT, MCLT, and skin incision groups. *: difference between indicated groups; 1–3: difference from indicated week.
Figure 4.
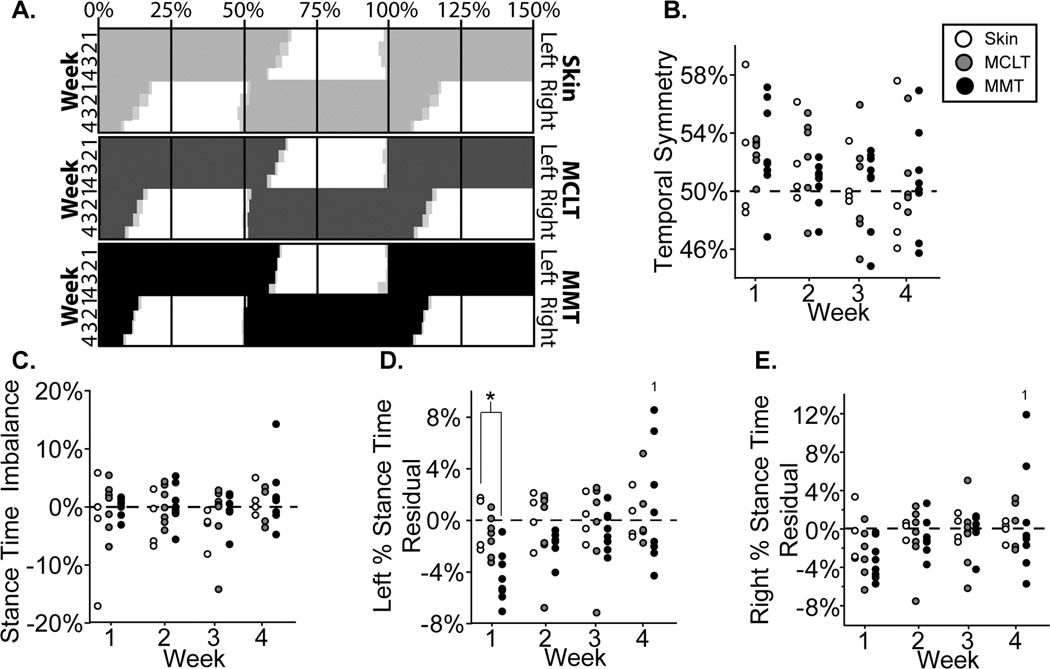
4A: Visual representation of MMT group temporal changes relative to control, shown as “Hildebrand plots” where percent indicates percent of a single gait cycle and light gray boxes indicate variance; 4B–D: temporal symmetry, stance time imbalance, left percent stance time residuals, and right percent stance time residuals of all animals in the MMT, MCLT, and skin incision groups. *: difference between indicated groups; 1: difference from indicated week.
A visual representation of spatial changes in the MMT+MCLT model and associated controls can be seen in Fig. 3a. MMT+MCLT animals and the associated control groups maintained spatially symmetric gaits over 4 weeks (Fig. 3b), where a value of 50% indicates the right foot hit the group approximately halfway between two left footsteps. However, at week 1, MMT+MCLT animals had reduced step widths compared to skin incision and MCLT (p<0.01), with MMT+MCLT step widths becoming progressively wider at 2–4 weeks (p<0.01, Fig 3c). A wider than expected step width (residual > 0) usually indicates balance compensations, whereby the animal’s base of support is broadened. By week 4, MCLT animals exhibited the same behavior (p<0.05) and both MCLT (8 of 8, p=0.008) and MMT+MCLT animals (7 of 8, p=0.07) tended to have increased step widths (Fig. 3c). At week 1, stride lengths were shorter for MMT+MCLT animals compared to skin incision (residual < 0, p<0.05) (Fig. 3d). While non-significant, MMT+MCLT animals tended to use shorter stride lengths at 2 and 3 weeks (7 of 8 residuals below 0, p=0.07).
A visual representation of temporal changes in the MMT+MCLT model and associated controls can be seen through Hildebrand plots of the hind limb foot-strike, toe-off sequence26 (Fig. 4a). No groups showed significant temporal asymmetry or stance time imbalance at any time point (Figs. 4b–c), meaning foot-strikes were equally spaced in time (symmetry ≈ 0.5) and the amount of time spent on each hind limb was similar (balance ≈ 0). However, at early time points, left percent stance times were lower in MMT+MCLT animals compared to skin incision (p<0.05), with all MMT+MCLT animals having a lower than expected left percentage stance time at 1 and 2 weeks (8 of 8, p=0.008) (Fig. 4d). In MMT+MCLT, left and right percent stance times were significantly longer by week 4 compared to week 1 (p<0.05 and p<0.01, respectively), with greater variability than previous weeks (Fig. 4d–e).
Dynamic data in the MMT+MCLT model and associated controls can be seen in Fig. 5, with peak vertical forces presented in Fig. 5a–b and vertical impulse in Fig.5c–d. In the left (contralateral) foot, peak vertical forces were lower than both MCLT and skin incision animals at weeks 1 and 3 (p<0.01), lower than expected at 1 week (8 of 8, p=0.008), and tended to be lower than expected at 2 and 3 weeks (7 of 8, p=0.07, Fig. 5a). For the right (ipsilateral) foot, peak vertical forces were lower for MMT+MCLT animals compared to skin incision at weeks 1, 2, and 3 (p<0.01), lower than MCLT at week 2 and 3 (p<0.01), and were lower than expected at weeks 1, 2, and 3 (8 of 8, p=0.008, Fig. 5b). Vertical impulses for MMT+MCLT animals were lower in the left foot compared to MCLT at week 2 (p<0.05), and skin incision at week 3 (p<0.05) (Fig. 5c). In the right foot, vertical impulses were lower than MCLT and skin incision only at week 2 (p<0.01) (Fig. 5d). At weeks 2 and 3, vertical impulses on both limbs were lower than expected in MMT+MCLT animals (8 of 8, p=0.008). A visual representation of vertical force-time curves can be seen in Fig. 5e. Reduced peak vertical force in both hind limbs is indicative of compensatory shuffling, which may be conceptually equated to marche a petit pas compensations in humans. A return to expected peak vertical forces (seen by week 4) may be the effect of establishing a spatiotemporally modified protective gait or resolution of pain symptoms; further time points would be required for a thorough assessment of this recovery.
MIA Model
Spatiotemporal and dynamic gait abnormalities were detected in MIA animals. Velocity-corrected spatial gait data are presented in Fig. 6, temporal data in Fig. 7, and dynamic data in Fig. 8.
Figure 6.
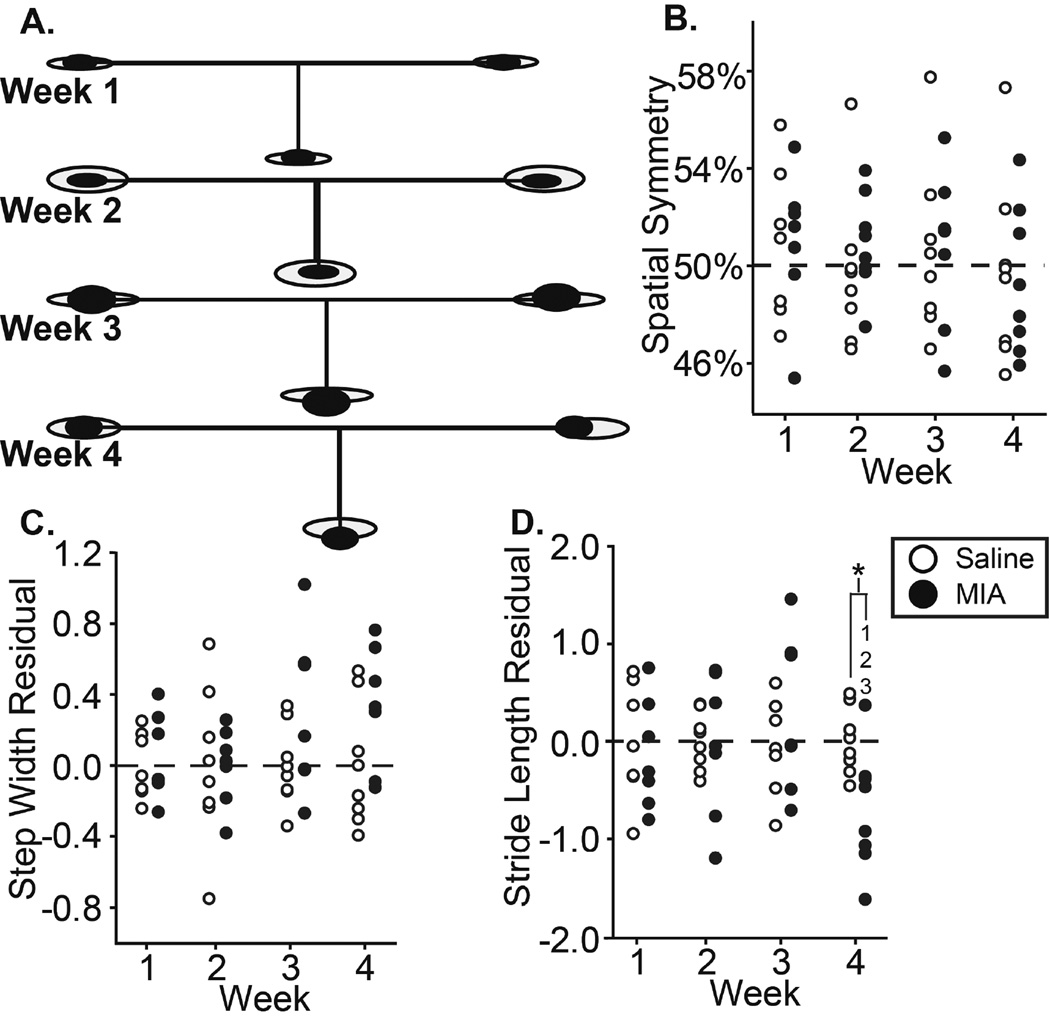
6A: Visual representation of MIA group spatial changes relative to control, where ellipse size indicates variance, horizontal lines indicate stride length, and vertical lines indicate step widths; 6B–D: spatial symmetry, step width residuals, and stride length residuals of all animals in the MIA and saline groups. *: difference between indicated groups; 1–3: difference from indicated week.
Figure 7.
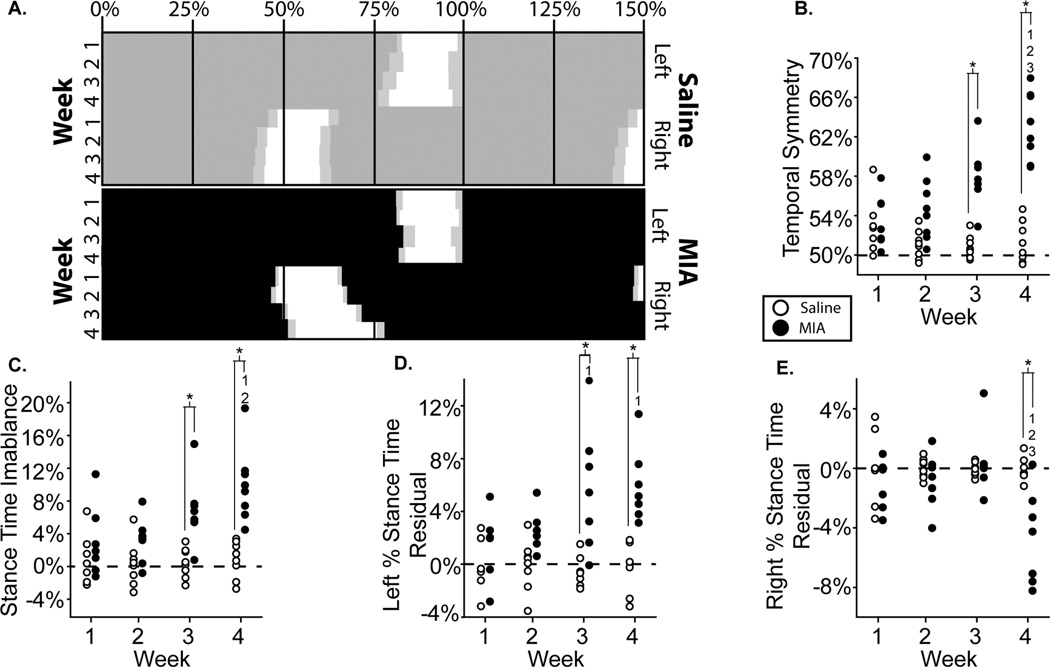
7A: Visual representation of MIA group temporal changes relative to control, shown as “Hildebrand plots” where percent indicates percent of a single gait cycle and light gray boxes indicate variance; 7B–D: temporal symmetry, stance time imbalance, left percent stance time residuals, and right percent stance time residuals of all animals in the MIA and saline groups. *: difference between indicated groups; 1–3: difference from indicated week.
Figure 8.
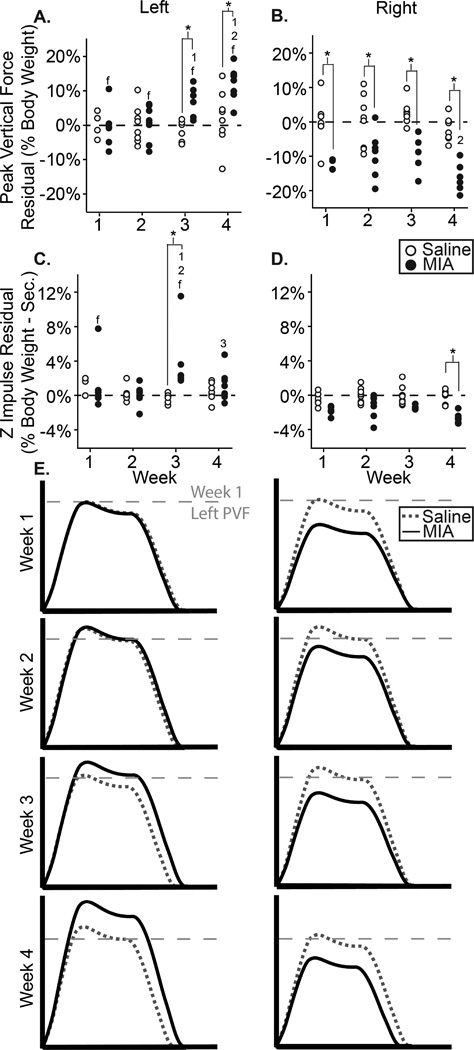
8A–D: PVF (A–B) and z impulse (C–D) residual for the left and right feet of all animals in the MIA and saline groups; 8E: visual representation of MMT group dynamic changes, where the x-axis represents stance time and the y-axis represents vertical force. *: difference between indicated groups; 1–3: difference from indicated week; f: difference between feet of the same group.
A visual representation of spatial changes in the MIA and saline injection groups can be seen in Fig. 6a. No changes were observed in spatial symmetry or step width in MIA animals (Fig. 6b–c). By week 4, stride length was reduced in MIA animals compared to prior weeks (p<0.05), as well as compared to saline animals (p<0.01) (Fig 6d).
A visual representation of temporal changes in the MIA and saline injection groups can be seen through Hildebrand plots of the hind limb foot-strike, toe-off sequence (Fig. 7a). MIA animals were temporally asymmetric at all time points (symmetry > 0.5, 8 of 8, p=0.008), with more asymmetric gaits found at week 4 relative to weeks 1, 2, and 3 (p<0.01) (Fig 7b). Saline animals were also temporally asymmetric at week 1 (8 of 8, p=0.008). Temporal asymmetry values above 50% are consistent with unilateral right limb injury, where the animal’s right foot-strikes occur after 50% of the gait cycle. Temporal symmetry was different in MIA animals relative to saline animals at weeks 3 and 4 (p<0.01, Fig 7b).
At weeks 3 and 4, stance time was imbalanced in MIA animals (8 of 8, p=0.008) and different from saline controls (p<0.01, Fig. 7c); at week 4, stance time imbalance in MIA animals was also greater than weeks 1 and 2 (p<0.01). Similar to temporal symmetry, stance time imbalance values above 0 are consistent with unilateral right limb injury, where the animal is spending less time on the right foot. These imbalanced gaits were primarily achieved through increases in left (contralateral) limb stance time at week 2 (8 of 8, p=0.008), week 3 (7 of 8, p=0.07), and week 4 (8 of 8, p=0.008, Fig. 7d). Left percent stance time was significantly longer for MIA animals compared to saline at weeks 3 and 4 (p<0.01). MIA animals also produced longer percent stance times at weeks 3 and 4 compared to week 1 (p<0.01) (Fig 7d). The right (ipsilateral) stance time residual was not reduced until week 4 (7 of 8, p=0.07), where right percent stance times were significantly reduced for MIA animals at week 4 compared to weeks 1, 2, and 3 (p<0.01) and also compared to saline animals at week 4 (p<0.01, Fig 7e).
Dynamic data in the MIA model and saline controls can be seen in Fig. 8, with peak vertical forces presented in Fig. 8a–b and vertical impulse in Fig. 8c–d. Peak vertical forces were significantly higher in the contralateral left foot than the ipsilateral right foot of MIA animals at all time points (p<0.01, Fig. 8a). At weeks 3 and 4, left foot peak vertical forces for the MIA group were greater than the left foot of saline animals (p<0.01) and greater than MIA animals at week 1 (p<0.05, Fig 8a). Peak vertical forces were found to be significantly lower for the right foot of MIA animals compared to saline animals at all time points (p<0.01, Fig. 8b). Additionally, peak vertical forces were lower for the right foot of MIA animals at week 4 compared to week 2 (p<0.01, Fig 8b). Left foot vertical impulse was only higher than expected at week 3 (8 of 8, p=0.008, Fig. 8c). However, at all weeks vertical impulse was lower than expected on the right limb (8 of 8, p=0.008, Fig. 8d). A visual representation of dynamic changes in the MIA and saline injection sham animals can be seen in Fig. 8e. Lowered peak vertical forces in the right limb and elevated peak vertical forces in the left are consistent with the development of antalgic gait in response to right limb unilateral injury.
Discussion
Though quadrupedal gait cannot provide a perfect analogue to human locomotion, both MMT+MCLT and MIA produced gait modifications that have human parallels. The MMT+MCLT group may be best described with a “cautious” gait, whereby dynamic changes reflected a shuffle-like compensation with peak vertical force reductions in both limbs. MMT+MCLT animals also tended to use reduced stride lengths (though statistical significance was only seen at week 1) and progressively wider step widths over 4 weeks. Both reduced stride lengths and wider step widths may be compensations due to balance or proprioceptive deficits. Similar to the gait patterns observed in MMT+MCLT animals, “cautious” gait in humans is generally characterized by slower movements with shorter steps and increased base of support. Moreover, “cautious” human gait is often attributed to adaptations to disease limitations and is common in the elderly27.
Interestingly, dynamic gait changes seen in MIA animals were indicative of antalgic gait, rather than shuffling. Generally, peak vertical force was elevated in the contralateral limb and reduced in the ipsilateral limb. Temporal changes corroborated this dynamic data, as MIA animals showed significant temporal asymmetry at weeks 3 and 4 with reduced ipsilateral stance times and increased contralateral stance times. These data all characteristically describe a “limp” consistent with unilateral right limb injury, where the animal protects an injured limb by reducing weight transfer and spending less time on the injured limb. This pattern is analogous to human antalgic gait patterns.
The MIA model is known to progress in two distinct phases, wherein the first 7 days post injection are characterized by rapid inflammation and chronic pain, with cartilage degeneration occurring at day 10 and later28,29. Furthermore, in high concentrations, such as the dose used in this study, a biphasic behavioral response has been observed, where animals show early behavioral changes (1–2 days post injection) which briefly return to normal before appearing again at time points beyond 2 weeks. We did not observe this biphasic response in the rodent’s gait pattern; however, it should be noted that very early time points were not explored in this study (within 7 days of injection).
While there are many possible causes for either antalgic or shuffling gait, shuffling gaits are often observed in humans with balance deficits. Conversely, antalgic gait in humans is a common response to movement-evoked pain. It is not known when or why rodents would adapt similar compensations; however, analyzing dynamic gait components in multiple types of painful and non-painful musculoskeletal injuries may be useful in learning how to differentiate pain-related behaviors from mechanical or proprioceptive dysfunction in rodents in the future. Moreover, gait data may also provide insightful metrics in preclinical examinations of acute versus chronic pain that traditional behavioral pain assessments, such as tactile sensitivity or static weight bearing, cannot accomplish alone.
The combination of spatiotemporal and dynamic data can provide a more complete characterization of the gait profile than either set of parameters can illustrate independently. For example, in MIA animals, spatially symmetric gait patterns were seen at week 1, but differences in gait dynamics (peak vertical forces) were also observed without corresponding temporal changes. By week 3, the pattern remained spatially symmetric, but advanced to include both dynamic and temporal evidence of antalgia. By week 4, stride length began to shorten in addition to the aforementioned changes. Combined, these elements can be understood intuitively as components of a stereotypical limp, with the increasing severity of this compensation indicated by the continuum of multiple variables rather than a single measure alone. In this sense, dynamic data provides additional sensitivity by increasing the “resolution” of the data; however, this is due to providing further detail of the compensation strategy, rather than being independently more sensitive than spatiotemporal data.
Both MIA and MMT+MCLT are unilateral injury models; however, the compensation patterns used by these models were markedly different. While producing robust behavioral changes, the MIA model does not well replicate clinical OA pathology. MIA is a glycolysis inhibitor that causes wide-spread chondrocyte death and, consequently, damage to articular cartilage23,30. This pathogenesis does not mimic clinical etiologies of OA. However, the antalgic gait observed in MIA animals is seen clinically in OA patients31. Antalgic gait in humans may result from either acute or chronic pain, where the former is used to reduce pain and discomfort and the latter is a maladaptive response to long-term degenerative conditions like OA32,33. It is possible antalgic gaits could evolve in MMT+MCLT animals at later time points, associating with long-term degenerative changes in the MMT+MCLT knee. Nonetheless, it is not clear why MMT+MCLT animals use shuffling gaits after meniscus injury, as one might hypothesize this injury would also result in antalgia. However, this study represents our third independent identification of shuffling gait in the MMT+MCLT model24,34. While the reasons for this compensation are currently unknown, shuffling does appear to be the preferred compensatory gait at 4–6 weeks in the MMT+MCLT model.
Of course, inherent differences in quadrupedal and bipedal gait may contribute to the dissimilarities seen between the gaits of OA patients and OA models. Nonetheless, MMT+MCLT and MIA animals clearly presented modified behavior detectable as early as 1 week post-surgery. Additionally, while this study suggests highly variable behavioral responses in quadrupedal rodent gait, this gait diversity is consistent with the diversity seen in disease-altered human locomotion, where different diseases produce unique pathologic gaits. Ultimately, this study showed unique responses to MMT+MCLT and MIA that imply a high degree of specificity in the rodent behavioral response to injury, which cannot be reduced to a unified response to osteoarthritic pain and dysfunction.
A limitation of this study was the duration of the experiment. Our group selected 4 weeks, as our previous work had identified shuffling gait compensations and clear OA-like histological changes after MMT+MCLT at this time. The MIA model has also been shown to produce behavioral changes and histological changes by 4 weeks. However, extending our studies to later time points would have provided more information on how gait evolves over time. An additional limitation was the high dosage of MIA, which may have contributed to the severity of the gait changes. Lower MIA dosages may have produced a less severe response with different characteristic gait changes. Furthermore, as noted in our build specifications, the force-plates used in EDGAR have the capability to record 3 forces with proper filtering and isolation. Though only vertical ground reaction forces were collected for this study, future studies will aim to include x- and y-axis ground reaction forces.
The unique behavioral responses observed in two unilateral OA models suggest there may not be a single preclinical model that sufficiently replicates the complex clinical OA experience, which is unsurprising given the complex and variable etiology of OA. Additionally, characterization of multiple preclinical OA models using sensitive behavioral tests, like gait analysis, may allow focused model selection when assessing specific OA etiologies and therapies. As such, model selection may also require refinement for targeting the acute or chronic component of osteoarthritic pain or proprioceptive and mechanical dysfunction. Ultimately, these data demonstrate that the continuum of gait data, including dynamic gait measures, are able to detect unique pathologic gait patterns in different rodent models of OA, where the different models may offer unique advantages in addressing the complex disease state that is clinical OA.
Acknowledgments
The research reported in this publication was supported by the National Institute of Arthritis and Musculoskeletal and Skin Diseases (NIAMS) of the National Institutes of Health under award number K99/R00AR057426, R21AR064402, and R01AR068424.
Role of the Funding Source
The funding sources of this study had no involvement in the design and conduct of this study or the decision to submit this manuscript.
Footnotes
Publisher's Disclaimer: This is a PDF file of an unedited manuscript that has been accepted for publication. As a service to our customers we are providing this early version of the manuscript. The manuscript will undergo copyediting, typesetting, and review of the resulting proof before it is published in its final citable form. Please note that during the production process errors may be discovered which could affect the content, and all legal disclaimers that apply to the journal pertain.
Contributions
B. Y. Jacobs, along with K. D. Allen, designed and conducted the study, analyzed the data, drafted the manuscript, and created the figures. B. Y. Jacobs and K. Dunnigan designed the EDGAR platform and built and tested the prototype. M. Pires-Fernandes conducted all histology for the study with B. Y. Jacobs. All studies were conducted under the supervision and direction of K. D. Allen. All authors participated in the final analysis of the data, editing of the manuscript and have approved the final version.
Competing Interests
The authors have no competing interests to disclose.
References
- 1.Jacobs BY, Kloefkorn HE, Allen KD. Gait analysis methods for rodent models of osteoarthritis. Current pain and headache reports. 2014;18:456. doi: 10.1007/s11916-014-0456-x. [DOI] [PMC free article] [PubMed] [Google Scholar]
- 2.Zhang W, Nuki G, Moskowitz RW, Abramson S, Altman RD, Arden NK, et al. OARSI recommendations for the management of hip and knee osteoarthritis. Part III: Changes in evidence following systematic cumulative update of research published through January 2009. Osteoarthritis and Cartilage. 2010;18:476–499. doi: 10.1016/j.joca.2010.01.013. [DOI] [PubMed] [Google Scholar]
- 3.Zhang W, Moskowitz RW, Nuki G, Abramson S, Altman RD, Arden N, et al. OARSI recommendations for the management of hip and knee osteoarthritis, Part II: OARSI evidence-based, expert consensus guidelines. Osteoarthritis and Cartilage. 2008;16:137–162. doi: 10.1016/j.joca.2007.12.013. [DOI] [PubMed] [Google Scholar]
- 4.Zhang W, Moskowitz RW, Nuki G, Abramson S, Altman RD, Arden N, et al. OARSI recommendations for the management of hip and knee osteoarthritis, Part I: Critical appraisal of existing treatment guidelines and systematic review of current research evidence. Osteoarthritis and Cartilage. 2007;15:981–1000. doi: 10.1016/j.joca.2007.06.014. [DOI] [PubMed] [Google Scholar]
- 5.Bedson J, Croft PR. The discordance between clinical and radiographic knee osteoarthritis: a systematic search and summary of the literature. BMC musculoskeletal disorders. 2008;9:116. doi: 10.1186/1471-2474-9-116. [DOI] [PMC free article] [PubMed] [Google Scholar]
- 6.Zhang R-X, Ren K, Dubner R. Osteoarthritis pain mechanisms: basic studies in animal models. Osteoarthritis and cartilage / OARS, Osteoarthritis Research Society. 2013;21:1308–1315. doi: 10.1016/j.joca.2013.06.013. [DOI] [PMC free article] [PubMed] [Google Scholar]
- 7.Malfait A-M, Schnitzer TJ. Towards a mechanism-based approach to pain management in osteoarthritis. Nature reviews Rheumatology. 2013;9:654–664. doi: 10.1038/nrrheum.2013.138. [DOI] [PMC free article] [PubMed] [Google Scholar]
- 8.Malfait AM, Little CB, McDougall JJ. A commentary on modelling osteoarthritis pain in small animals. Osteoarthritis and Cartilage. 2013;21:1316–1326. doi: 10.1016/j.joca.2013.06.003. [DOI] [PMC free article] [PubMed] [Google Scholar]
- 9.Vierck CJ, Hansson PT, Yezierski RP. Clinical and pre-clinical pain assessment: Are we measuring the same thing? Pain. 2008;135:7–10. doi: 10.1016/j.pain.2007.12.008. [DOI] [PubMed] [Google Scholar]
- 10.Tappe-Theodor A, Kuner R. Studying ongoing and spontaneous pain in rodents - challenges and opportunities. European Journal of Neuroscience. 2014;39:1881–1890. doi: 10.1111/ejn.12643. [DOI] [PubMed] [Google Scholar]
- 11.Mogil JS. Animal models of pain: progress and challenges. Nature reviews Neuroscience. 2009;10:283–294. doi: 10.1038/nrn2606. [DOI] [PubMed] [Google Scholar]
- 12.McDougall JJ, Linton P. Neurophysiology of arthritis pain. Current Pain and Headache Reports. 2012;16:485–491. doi: 10.1007/s11916-012-0300-0. [DOI] [PubMed] [Google Scholar]
- 13.Little CB, Zaki S. What constitutes an “animal model of osteoarthritis” - the need for consensus? Osteoarthritis and Cartilage. 2012;20:261–267. doi: 10.1016/j.joca.2012.01.017. [DOI] [PubMed] [Google Scholar]
- 14.Mogil JS, Davis KD, Derbyshire SW. The necessity of animal models in pain research. Pain. 2010;151:12–17. doi: 10.1016/j.pain.2010.07.015. [DOI] [PubMed] [Google Scholar]
- 15.Allen KD, Adams SB, Mata BA, Shamji MF, Gouze E, Jing L, et al. Gait and behavior in an IL1β-mediated model of rat knee arthritis and effects of an IL1 antagonist. Journal of Orthopaedic Research. 2011;29:694–703. doi: 10.1002/jor.21309. [DOI] [PMC free article] [PubMed] [Google Scholar]
- 16.Allen KD, Mata BA, Gabr MA, Huebner JL, Adams SB, Kraus VB, et al. Kinematic and dynamic gait compensations resulting from knee instability in a rat model of osteoarthritis. Arthritis Research & Therapy. 2012;14:R78. doi: 10.1186/ar3801. [DOI] [PMC free article] [PubMed] [Google Scholar]
- 17.Janusz MJ, Bendele AM, Brown KK, Taiwo YO, Hsieh L, Heitmeyer SA. Induction of osteoarthritis in the rat by surgical tear of the meniscus: Inhibition of joint damage by a matrix metalloproteinase inhibitor. Osteoarthritis and Cartilage. 2002;10:785–791. doi: 10.1053/joca.2002.0823. [DOI] [PubMed] [Google Scholar]
- 18.Combe R, Bramwell S, Field MJ. The monosodium iodoacetate model of osteoarthritis: A model of chronic nociceptive pain in rats? Neuroscience Letters. 2004;370:236–240. doi: 10.1016/j.neulet.2004.08.023. [DOI] [PubMed] [Google Scholar]
- 19.Ferland CE, Laverty S, Beaudry F, Vachon P. Gait analysis and pain response of two rodent models of osteoarthritis. Pharmacology Biochemistry and Behavior. 2011;97:603–610. doi: 10.1016/j.pbb.2010.11.003. [DOI] [PubMed] [Google Scholar]
- 20.Guzman RE, Evans MG, Bove S, Morenko B, Kilgore K. Mono-iodoacetate-induced histologic changes in subchondral bone and articular cartilage of rat femorotibial joints: an animal model of osteoarthritis. Toxicologic pathology. 2003;31:619–624. doi: 10.1080/01926230390241800. [DOI] [PubMed] [Google Scholar]
- 21.Schuelert N, McDougall JJ. Grading of monosodium iodoacetate-induced osteoarthritis reveals a concentration-dependent sensitization of nociceptors in the knee joint of the rat. Neuroscience Letters. 2009;465:184–188. doi: 10.1016/j.neulet.2009.08.063. [DOI] [PubMed] [Google Scholar]
- 22.Bove SE, Calcaterra SL, Brooker RM, Huber CM, Guzman RE, Juneau PL, et al. Weight bearing as a measure of disease progression and efficacy of anti-inflammatory compounds in a model of monosodium iodoacetate-induced osteoarthritis. Osteoarthritis and Cartilage. 2003;11:821–830. doi: 10.1016/s1063-4584(03)00163-8. [DOI] [PubMed] [Google Scholar]
- 23.Kalbhen DA. Chemical model of osteoarthritis--a pharmacological evaluation. The Journal of rheumatology. 1987;14(Spec No):130–131. [PubMed] [Google Scholar]
- 24.Kloefkorn HE, Jacobs BY, Loye AM, Allen KD. Spatiotemporal gait compensations following medial collateral ligament and medial meniscus injury in the rat: correlating gait patterns to joint damage. Arthritis Research & Therapy. 2015;17:287. doi: 10.1186/s13075-015-0791-2. [DOI] [PMC free article] [PubMed] [Google Scholar]
- 25.Hedrick TL. Software techniques for two- and three-dimensional kinematic measurements of biological and biomimetic systems. Bioinspiration & biomimetics. 2008;3:34001. doi: 10.1088/1748-3182/3/3/034001. [DOI] [PubMed] [Google Scholar]
- 26.Hildebrand M. Vertebrate locomotion : an introduction. BioScience. 1989;39:764–765. [Google Scholar]
- 27.Lam R. Office management of gait disorders in the elderly. Canadian Family Physician. 2011;57:765–770. [PMC free article] [PubMed] [Google Scholar]
- 28.Guingamp C, Gegout-Pottie P, Philippe L, Terlain B, Netter P, Gillet P. Mono-iodoacetate-induced experimental osteoarthritis. A dose-response study of loss of mobility, morphology, and biochemistry. Arthritis & Rheumatism. 1997;40:1670–1679. doi: 10.1002/art.1780400917. [DOI] [PubMed] [Google Scholar]
- 29.Kuyinu EL, Narayanan G, Nair LS, Laurencin CT. Animal models of osteoarthritis: classification, update, and measurement of outcomes. Journal of orthopaedic surgery and research. 2016;11:19. doi: 10.1186/s13018-016-0346-5. [DOI] [PMC free article] [PubMed] [Google Scholar]
- 30.Orthop C, Res R, A-m M. 3.2 Animal Models of Osteoarthritis. 1999:228–238. [Google Scholar]
- 31.Ling SM, Bathon JM. Osteoarthritis in older adults. Journal of the American Geriatrics Society. 1998;46:216–225. doi: 10.1111/j.1532-5415.1998.tb02543.x. [DOI] [PubMed] [Google Scholar]
- 32.Lim MR, Huang RC, Wu A, Girardi FP, Cammisa FP. Evaluation of the elderly patient with an abnormal gait. The Journal of the American Academy of Orthopaedic Surgeons. 2007;15:107–117. doi: 10.5435/00124635-200702000-00005. [DOI] [PubMed] [Google Scholar]
- 33.Perry J. Gait Analysis: Normal and Pathological Function. 2010 [Google Scholar]
- 34.Kloefkorn HE, Pettengill TR, Turner SMF, Streeter KA, Gonzalez-Rothi EJ, Fuller DD, et al. Automated Gait Analysis Through Hues and Areas (AGATHA): a method to characterize the spatiotemporal pattern of rat gait. Annals of Biomedical Engineering. 2016:1–15. doi: 10.1007/s10439-016-1717-0. [DOI] [PMC free article] [PubMed] [Google Scholar]


