

Abstract
Introduction
MET gene copy number gain (CNG) may be a predictive biomarker for MET inhibition in lung cancer, but the most appropriate method and criteria for defining MET positivity are uncertain.
Methods
MET copy number was assessed by fluorescence in situ hybridization (FISH) in lung adenocarcinoma. Positivity criteria included mean MET/cell ≥5 (low ≥5 – <6, intermediate ≥6 –<7, high ≥7) and MET/CEP7 ratio ≥1.8 (low ≥1.8 – ≤2.2, intermediate >2.2 – < 5, high ≥5). Associated clinical and molecular characteristics were captured.
Results
99/686 cases (14%) had mean MET/cell ≥ 5, 52/1164 (4.5%) had MET/CEP7 ≥1.8. Other oncogenic drivers (in EGFR, KRAS, ALK, ERBB2, BRAF, NRAS, ROS1 or RET) were detectable in 56% of the mean MET/cell ≥ 5 group and 47% of the MET/CEP 7 ratio ≥1.8 group, suggesting many MET ‘positive’ cases are not truly MET-addicted. Concomitant drivers in low, indeterminate and high categories of mean MET/cell were 32/52 (62%), 12/19 (63%) and 11/27 (41%) (p=0.2) and in MET/CEP7: 15/29 (52%), 9/18 (50%) and 0/4 (0%) respectively (p=0.04). MET/CEP7 ≥1.8, in the absence of other oncogenes, was associated with a higher rate of adrenal metastases (p=0.03), but not with never smoking status.
Conclusions
FISH MET/CEP7 ≥ 5 defined a MET ‘positive’ group with no oncogenic overlap. As this method and criteria are also associated with the highest response rate to MET inhibition it represents the clearest definition of a MET CNG-addicted state. However, a MET-associated phenotype may also exist across MET/CEP7 ≥ 1.8 cases when no other oncogene overlap occurs.
Keywords: MET copy number gain, lung adenocarcinoma
Introduction
The recognition that non-small cell lung cancer (NSCLC) is a heterogeneous disease, divided into different, clinically-relevant subtypes according to the dominant oncogenic driver of the tumor, has changed the paradigm for managing advanced lung cancer (1). Tumors bearing specific mutations in the epidermal growth factor receptor (EGFR) or BRAF genes or rearrangements in the anaplastic lymphoma kinase (ALK) or ROS1 genes have shown dramatic and prolonged responses to targeted inhibitors (2–5). Many other putative oncogenic molecular drivers exist in NSCLC, such as KRAS, ERBB2, and NRAS mutations and RET gene rearrangements, although not all are currently associated with active targeted therapies (1,6–9).
Recently, c-Mesenchymal-epithelial transition factor-1 (c-MET), a transmembrane tyrosine kinase receptor encoded by the proto-oncogene, MET, which lies on chromosome 7, has been explored as a potential targetable oncogenic driver (10,11). First described in 1984, it was not until 1991 that it was identified as the receptor for hepatocyte growth factor (HGF), which is expressed by stromal and mesenchymal cells (12,13). Activation of MET in cancer cells occurs in several ways, including receptor and ligand overexpression, gene mutation, gene amplification and chromosomal rearrangements, and is linked to tumor growth and metastases (14–22). Two forms of MET activation have been identified as potentially targetable primary oncogenic drivers in NSCLC: MET exon 14 skipping alterations and MET gene copy number gain (CNG) (23,24). In addition, MET gene amplification has also been described as a mechanism of acquired resistance to EGFR targeted therapies (25,26).
Beyond the sensitivity threshold of specific assays, oncogenic drivers that are mutations or gene rearrangements largely represent binary variables – the oncogenic change is either detected or not. In contrast, for gene copy number alteration, the relevant definition of ‘positivity’ is more challenging. When using fluorescence in situ hybridization (FISH) technology (the most common method in assessing gene dosage) 2 different quantification criteria may be used: either increases in the absolute copy number (e.g. the mean copy number of the gene/cell) or an increase in the ratio of the gene copies relative to other targets on the same chromosome (typically the centromere of the chromosome on which the gene sits). The latter would identify copy number increases due to focal amplification of a specific gene or region of a chromosome, whereas the former would also include increases secondary to more general chromosome polysomy without necessarily reflecting selection of one gene over another. Both measures represent continuous variables and a threshold to separate a ‘positive’ from a ‘negative’ result across the continuum of values must be established.
The reported frequency of MET CNG in NSCLC ranges from 0.7–21% depending on the technique used and the cut-point for positivity (1,26). FISH characterized MET/CEP7 ratios of ≥ 1.8, ≥ 2.0 and >2.2 and mean MET/cell ≥ 4 and ≥ 5 copies have defined MET positivity in different studies (1,24,27–29). Recently, in a small series, the objective response rate (ORR) to crizotinib (a MET/ALK/ROS1 inhibitor) dramatically differed between cases with different MET/CEP7 ratios (ratio ≥1.8−≤2.2 ORR 0%; ratio >2.2−<5 ORR 17%; ratio ≥5 ORR 67%) (24). In EGFR mutant NSCLC with acquired resistance to EGFR TKIs, the ORR to the combination of an EGFR inhibitor and a MET inhibitor (INC280) was 0% among those with a mean MET/cell of <5 and 40% among those with mean MET/cell ≥5 (30).
Determining the appropriate measure and threshold for predicting benefit from MET inhibition continues to be explored. Oncogene overlap analysis is based on the fact that, in general, most oncogenic mutations occur in a mutually exclusive fashion. For example, in the Lung Cancer Mutation Consortium (LCMC) study looking at the incidence of 10 potential molecular drivers (EGFR, ALK, KRAS, NRAS, BRAF, ERBB2, PIK3CA, MEK, AKT1 and MET) in over 1000 adenocarcinomas of the lung, the rate of co-incident oncogenic drivers in the same tumor was only 3%. Among the 24 cases with >1 potential driver, 50% had PIK3CA mutations and 33% had MET CNG, where a MET/CEP7 ratio >2.2 was used to define MET positivity (1,31).
Similarly, another study from the Network Genomic Medicine program in Germany demonstrated overlap between MET CNG, defined as MET/CEP7 ratio ≥ 2.0 and EGFR and KRAS mutations (22).
PIK3CA mutations often overlap with other oncogenes and is now thought to perform more of a facilitator function rather than acting as a dominant oncogenic driver in NSCLC (32,33). While the same explanation could also apply to MET, given the continuous nature of MET CNG estimates and the fact that a proportion of such tumors clearly respond to MET inhibition, the overlap with other drivers in the LCMC may be evidence that the positivity level used within the initial LCMC report and the Network Genomic Medicine program was too inclusive.
Here, we report our use of oncogene overlap analysis on cases from both the LCMC and the Colorado Molecular Correlates (CMOCO) Laboratory of the University of Colorado, as a means to identify the appropriate positivity threshold for a true MET-driven subset of NSCLC. We also explored the clinical characteristics of differently defined MET FISH positive patients in an effort to define a potential MET-associated clinical phenotype in lung cancer.
Materials and Methods
Study Design and Patient Selection
We performed a retrospective analysis of patients with lung adenocarcinoma who had MET gene copy number status assessed by CMOCO and/or the LCMC from 2009 to 2014.
The LCMC collected tissue samples from patients with stage IV lung adenocarcinoma across 14 sites within the USA and these were analyzed in 6 Clinical Laboratory Improvement Amendments (CLIA) certified laboratories as previously described (31). Patients provided written informed consent for the analysis of their tumor specimens and the collection of clinical and demographic information. Following approval from the executive committee of the LCMC, we received anonymized data detailing gender, race, date of birth, smoking history, date of lung cancer diagnosis, date of recurrence/metastases, date of last follow up/death, number and type of disease sites at metastatic diagnosis, molecular testing and best response to first line chemotherapy.
Additionally, following Institutional Review Board approval, data were collected on lung cancer patients who had MET FISH testing done by CMOCO at the University of Colorado but were not included in the LCMC cohort.
Molecular analysis
Formalin-fixed paraffin embedded (FFPE) tumor samples were submitted for testing. All samples were tested for MET gene copy number by FISH (31). The MET FISH assays were performed with laboratory developed reagents or commercial reagents encompassing the genomic sequences of MET. The centromere 7 (CEP7), as a control probe, was used to define the relative CNG (31). Gene CNG was reported by two methods: mean MET copy number per cell (mean MET/cell) and the MET copy number per centromere 7 ratio (MET/CEP7). Positivity for mean MET/cell was defined as: low: ≥5 to <6 copies, intermediate: ≥ 6 to <7 copies, or high: ≥7 copies. Ratio MET/CEP7 positivity was defined as: low: ≥1.8 to ≤2.2, intermediate: >2.2 to < 5, or high: ≥5.
We also assessed the impact of a MET/CEP7 ratio ≥ 2.0 as this is a standardized ratio for gene amplification in other settings (e.g. HER2 in breast cancer) and > 2.2 which had been used previously by the LCMC (31,34).
Statistical Analysis
MET metrics were correlated with race (Caucasian/Asian/African American/Other), sex, smoking status (current, former or never (<100 cigarettes in their lifetime)), number and site of metastatic disease sites, presence of other known oncogenic drivers (EGFR, KRAS, ALK, ERBB2, BRAF, NRAS, ROS1 and/or RET), best response to first line chemotherapy (stable disease, partial response, complete response or progressive disease (by investigator assessment)) and overall survival using Fisher’s exact tests, chi-square tests, Spearman correlations and log-rank tests, as appropriate.
Statistical significance was set at the 0.05 level without adjustment for multiple comparisons.
Results
Patient Datasets
Between 2009 and 2014, 884 patients with confirmed lung adenocarcinoma were subjected to MET FISH testing by the LCMC. 26 cases were screen-fails and no data was available on 3 patients, leaving 855 evaluable patients.
Over the same time period, 1000 patients received MET FISH testing by CMOCO. Of these, 418 patients were included in the LCMC dataset. Of the remaining 582 patients, 180 cases were subsequently excluded. There were 44 duplicate entries, i.e. patients that had 2 samples tested on separate occasions; the sample with the most comprehensive molecular testing was included. The other exclusions were: 104 cases had no available associated data, 4 cases had a non-malignant diagnosis and 50 cases had a malignancy other than lung cancer, leaving 402 unique evaluable patients from the CMOCO dataset.
Combining both datasets, 1257 unique patients with MET testing were available for evaluation. 72 patients had a non-adenocarcinoma diagnosis (52 patients had squamous cell carcinoma, 12 had large cell neuroendocrine carcinoma, 3 had carcinoma with neuroendocrine features, 2 had small cell lung carcinoma, 2 had mucoepidermoid tumors and 1 had a sarcomatoid tumor). 7 patients had unknown histology. Overall, 1178 patients with adenocarcinoma of the lung, MET testing and available clinical and demographic data were identified. MET/CEP7 data were available on all 1178 patients. Mean MET/cell data was only available on the patients tested by CMOCO (700 patients).
14 cases with both an EGFR mutation and MET positivity (by either criteria) represented biopsies taken from EGFR mutant patients in the known EGFR TKI acquired resistance setting, rather than de novo specimens and these were excluded leaving 1164 unique adenocarcinoma patients with MET/CEP7 information and 686 with mean MET/cell information.
A consort diagram illustrating the cases available for analysis is shown in Figure 1.
Figure 1. Patient Disposition.
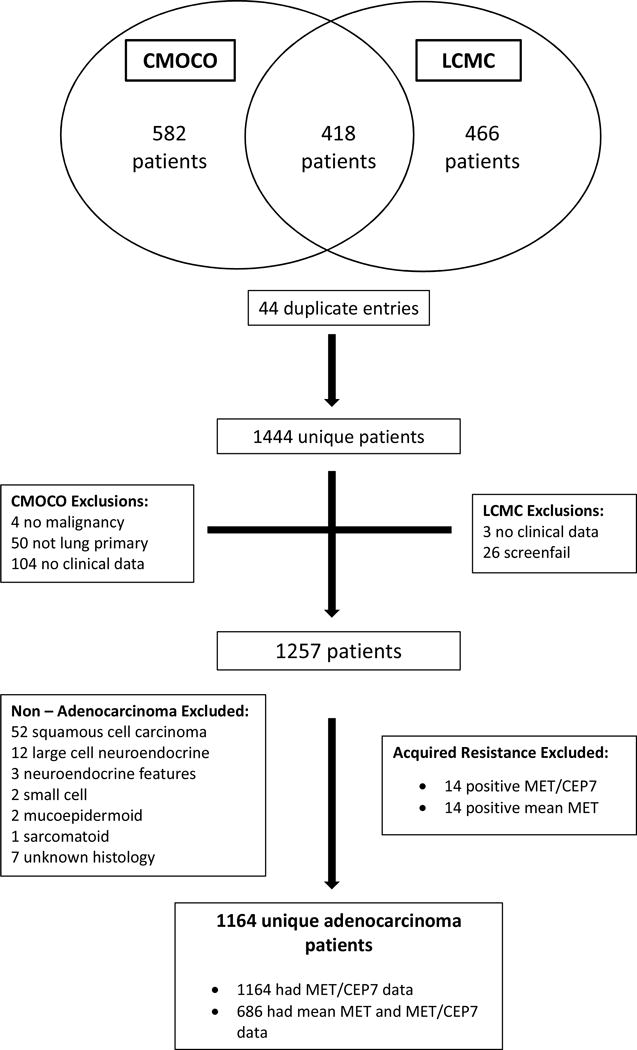
CMOCO= Colorado Molecular Correlates Laboratory. LCMC = Lung Cancer Mutation Consortium
Patient Demographics
Demographic and clinical characteristics of the overall MET tested dataset are summarized in Table 1.
Table 1. Patient Demographics and Clinical Characteristics.
Characteristics in adenocarcinoma patients selected according to different measurements of MET. Mean MET = mean MET per cell. MET/CEP7 = mean MET per cell and chromosome 7 centromere ratio. Age at Diagnosis = Median age at lung cancer diagnosis. Response to 1st line = best response to 1st line chemotherapy as assessed by treating physician. SD = stable disease. PD = progressive disease. PR = partial response. CR = complete response.
| ALL | MEAN MET | MET /CEP7 RATIO | |||||||||
|---|---|---|---|---|---|---|---|---|---|---|---|
| n=1164 | <5 n=587 (%) |
≥ 5 n=99 (14%) |
p value | <1.8 n=1112 (%) |
≥1.8 n=52 (4.5%) |
p value | ≥2.0 n=33 (2.9%) |
p value | >2.2 n=22 (1.9%) |
p value | |
| Gender | |||||||||||
| Male | 461 (40) | 236 (40) | 43 (43) | 0.6 | 434 (39) | 27 (52) | 0.08 | 17 (52) | 0.2 | 11 (50) | 0.4 |
| Female | 703 (60) | 351 (60) | 56 (57) | 678 (61) | 25 (48) | 16 (48) | 11 (50) | ||||
| Race | |||||||||||
| Caucasian | 989 (85) | 490 (83) | 81 (82) | 0.2 | 946 (85) | 43 (83) | 0.5 | 27 (81) | 0.8 | 20 (91) | 0.5 |
| African Am | 53 (5) | 22 (4) | 8 (8) | 49 (4) | 4 (8) | 2 (6) | 0 | ||||
| Asian | 50 (4) | 25 (4) | 2 (2) | 49 (4) | 1 (2) | 1 (3) | 0 | ||||
| Smoking Hx: | |||||||||||
| Yes | 769 (66) | 383 (65) | 65 (66) | 0.6 | 733 (66) | 36 (70) | 0.7 | 24 (73) | 0.7 | 17 (77) | 0.5 |
| Never | 384 (33) | 197 (34) | 34 (34) | 368 (33) | 16 (30) | 9 (27) | 5 (23) | ||||
| Age at Dx: (yrs) | 62 | 63 | 61 | 62 | 62 | 62 | 0.9 | 63 | 0.3 | ||
| Site of Mets | |||||||||||
| Adrenal | 79 (7) | 37 (7) | 14 (16) | 0.004 | 73 (7) | 6 (12) | 0.3 | 5 (17) | 0.08 | 4 (19) | 0.09 |
| Bone | 268 (24) | 143 (28) | 20 (23) | 0.7 | 258 (25) | 10 (20) | 0.4 | 5 (17) | 0.2 | 2 (10) | 0.07 |
| Brain | 232 (21) | 106 (20) | 19 (22) | 0.5 | 220 (21) | 12 (24) | 0.7 | 8 (25) | 0.7 | 5 (24) | 1.0 |
| Liver | 99 (9) | 53 (10) | 8 (9) | 1.0 | 95 (9) | 4 (8) | 1.0 | 3 (9) | 1.0 | 2 (10) | 1.0 |
| Lung | 515 (47) | 276 (53) | 43 (49) | 1.0 | 489 (47) | 26 (53) | 0.9 | 16 (47) | 1.0 | 12 (57) | 1.0 |
| Response to 1st Line Tx: | |||||||||||
| PD | 122 (27) | 63 (24) | 21 (45) | 0.09 | 116 (27) | 6 (24) | 0.06 | 3 (25) | 0.8 | 3 (30) | 0.5 |
| SD | 133 (29) | 80(30) | 15 (32) | 123 (28) | 10 (40) | 5 (41) | 4 (40) | ||||
| PR | 178 (39) | 114 (43) | 10 (21) | 172 (40) | 6 (24) | 3 (25) | 2 (20) | ||||
| CR | 25 (5) | 10 (4) | 1 (2) | 22 (5) | 3 (1) | 1 (8) | 1 (10) | ||||
| Other Oncogenic Driver | |||||||||||
| ALK | 89 (9) | 47 (9) | 8 (9) | 84 (8) | 5 (10) | 3 (6) | 3 (14) | ||||
| EGFR | 264 (23) | 128 (22) | 21 (22) | 260 (24) | 4 (8) | 1 (2) | 0 | ||||
| KRAS | 291 (26) | 155 (27) | 20 (21) | 281 (26) | 10 (20) | 7 (13) | 5 (23) | ||||
| BRAF | 26 (3) | 12 (3) | 1 (1) | 26 (3) | 0 | 0 | 0 | ||||
| ERBB2 | 24 (3) | 8 (2) | 4 (6) | 20 (2) | 4 (11) | 2 (5) | 1 (8) | ||||
| NRAS | 7 (1) | 5 (1) | 1 (1) | 6 (1) | 1 (3) | 0 | 0 | ||||
| ROS1 | 2 (1) | 2 (2) | 0 | 2 (2) | 0 | 0 | 0 | ||||
| RET | 5 (7) | 5 (7) | 0 | 5 (7) | 0 | 0 | 0 | ||||
Most patients were female (703/1164 (60%)), and Caucasian (989/1164 (85%)). 53/1164 (5%) were African American and 50/1164 (4%) were Asian. The median age at initial diagnosis of lung cancer was 62 years. 66% (769/1164) of patients were current or former smokers, 60% (699/1164) of patients had metastatic disease at diagnosis and a further 401 patients previously diagnosed with earlier stage disease later developed metastatic disease. Of the stage IV patients, 515/1100 (47%) had lung metastases, 268/1100 (24%) had bone metastases, 232/1100 (21%) had brain metastases, 99/1100 (9%) had liver metastases, 79/1100 (7%) had adrenal metastases, and 288/1100 (26%) had metastases involving another site. 406/1100 (37%) had 1 site of metastasis at diagnosis, 236/1100 (21%) had 2 sites, 141/1100 (13%) had 3 sites and 43/1100 (4%) had 4 or more sites of disease at diagnosis. Data regarding best response to first line chemotherapy were available on 458 patients; 133 (29%) had stable disease, 122 (27%) had progressive disease, 178 (39%) had a partial response and 25 (5%) had a complete response to treatment.
99/686 (14%) of patients had a mean MET ≥ 5 and 52/1164 (4.5%) of patients had a MET/CEP7 ratio ≥ 1.8. There was no significant difference between age, race, smoking status or response to first line therapy between the MET positive and MET negative populations using initial positivity criteria (mean MET/cell ≥ 5 or a MET/CEP7 ratio ≥ 1.8) (Table 1).
Patients with mean MET/cell ≥ 5 were more likely to have adrenal metastases at diagnosis than those with mean MET < 5 (16% Vs 7%, p = 0.004). Numerically, a similar pattern was seen in the overall MET/CEP7 positive group relative to the negative group, but this was not statistically significant (12% Vs 7%, p = 0.3) (Table 1).
Using a MET/CEP7 cut-off point of ≥ 2.0 and 2.2 there was no difference between the positive and negative groups (Table 1).
Correlation between mean MET and MET/CEP7 tests
There was a good correlation between the negative results of both the mean MET/cell and MET/CEP7 methods of measuring MET gene CNG in that 84% of patients were negative by both criteria (Table 2). However, only a small proportion of patients had positive results by either criterion and within this there was a disparity between the two criteria. For example, 70% (69/99) of the positive mean MET/cell cases were negative using the MET/CEP7 criteria (Table 2).
Table 2. Correlation between mean MET and MET/CEP7 ratio.
A)Correlation between mean MET and MET /CEP7 measurements. B) Correlation between mean MET and MET/CEP7 measurements when other oncogenic drivers are excluded
| A | |||||
|---|---|---|---|---|---|
| MET /CEP7 | Mean MET | Total | |||
| Negative < 5 | Low ≥ 5 | Intermediate ≥ 6 | High ≥ 7 | ||
| Negative < 1.8 | 577 | 42 | 16 | 11 | 646 |
| Low ≥ 1.8 ≤ 2.2 | 9 | 8 | 0 | 6 | 23 |
| Intermediate >2.2 <5 | 1 | 2 | 3 | 7 | 13 |
| High ≥ 5 | 0 | 0 | 0 | 4 | 4 |
| Total | 587 | 52 | 19 | 28 | 686 |
| 2B | |||||
|---|---|---|---|---|---|
| Drivers Excluded MET/CEP7 | Mean MET | Total | |||
| Negative < 5 | Low ≥ 5 | Intermediate ≥ 6 | High ≥ 7 | ||
| Negative < 1.8 | 221 | 17 | 6 | 7 | 251 |
| Low ≥ 1.8 ≤ 2.2 | 6 | 3 | 0 | 0 | 9 |
| Intermediate >2.2 <5 | 0 | 0 | 1 | 5 | 6 |
| High ≥ 5 | 0 | 0 | 0 | 4 | 4 |
| Total | 227 | 20 | 7 | 16 | 270 |
Rate of concomitant oncogenic drivers
Almost all (99.6%, 1160/1164) patients were tested for at least one other known oncogenic driver (EGFR, KRAS, ALK, ERBB2, BRAF, NRAS, ROS1 and/or RET) and 61% (702/1160) had another driver detected. Of these, 8% (89/1047) were ALK positive, 23% (264/1137) had an EGFR mutation, 26% (291/1134)) had a KRAS mutation, 3% (24/845) had an ERBB2 mutation, 3% (26/952) had a BRAF mutation, 1% (7/949) had an NRAS mutation, 1% (2/137) had a ROS1 rearrangement and 7% (5/75) had a RET rearrangement (Table 1).
Among patients with mean MET/cell ≥ 5, 99% (98/99) had additional molecular testing and 56% (55/98) were positive for another potential oncogenic driver; 9% (8/90) were ALK positive, 22% (21/96) had an EGFR mutation, 21% (20/96) had a KRAS mutation, 6% (4/64) had an ERBB2 mutation, 1% (1/78) had a BRAF mutation and 1% (1/77) had an NRAS mutation. Among patients with ≥ 1 additional driver oncogene tested, concomitant drivers in low, indeterminate and high categories of mean MET/cell were 62% (32/52), 63% (12/19) and 41% (11/27), respectively. There was no significant difference in the presence of a concomitant molecular driver between the three groups (p = 0.2) (Figure 2).
Figure 2 and Table 3.
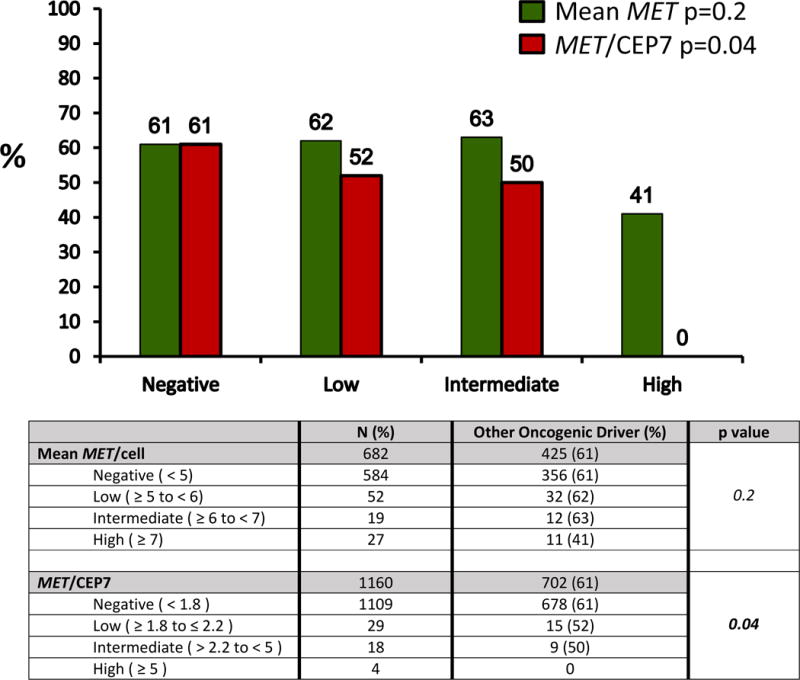
Rate of oncogenic drivers according to low, intermediate and high mean MET/cell and MET/CEP7.
Distribution of oncogenic drivers according to MET amplification measured by mean MET/cell and MET/CEP7. There was no difference in the percentage of patients that had another oncogenic driver between negative/low/intermediate and high levels of mean MET/cell (p=0.13). There was a significant difference in the percentage of patients that had another oncogenic driver between the negative/low/intermediate and high groups, with no concomitant oncogenic driver identified in the MET/CEP7 high group (p=0.04).
Similarly, 98% (51/52) of the MET/CEP7 ≥ 1.8 group had additional molecular testing and 47% (24/51) were positive for another driver; 10% (5/48) were ALK positive, 8% (4/50) had an EGFR mutation, 20% (10/50) had a KRAS mutation, 11% (4/35) had an ERBB2 mutation and 3% (1/37) had an NRAS mutation. Among patients with ≥1 additional driver oncogene tested, concomitant drivers in low, indeterminate and high categories of MET/CEP7 were 52% (15/29), 50% (9/18) and 0% (0/4), respectively and these differences were statistically significant (p = 0.04) (Figure 2).
Characteristics of patients with MET gene CNG when cases with other molecular drivers were excluded
With so few cases in the highest MET/CEP7 category, we enriched our dataset for true MET-driven states by excluding cases with other potential oncogenic drivers and looking for associated clinical characteristics in the dataset with mean MET/cell ≥ 5 and/or a MET/CEP7 ratio ≥ 1.8 (Table 3).
44 (6.4%) patients had mean MET/cell ≥ 5 exclusive of another molecular driver. Of these, 45% (20/44) were female, 80% (35/44) were Caucasian, 11% (5/44) were African American and 2% (1/44) were Asian. 80% (35/44) were current or former smokers. The median age at diagnosis was 64 years. There was no difference between the mean MET ≥ 5 group compared to the mean MET < 5 group with regards to race (p=0.1), smoking status (p=0.15), age at diagnosis (p=0.4) or best response to first line chemotherapy (p =0.09). There was a trend towards significance with regard to gender, with men (9.3%) more likely than women (5.4%) to have mean MET ≥ 5 (p=0.08). 12% of patients with adrenal metastases had mean MET ≥ 5, compared to 5% of patients without adrenal metastases, and again there was a trend toward significance (p=0.08).
28 (2.4%) patients had a MET/CEP7 ratio ≥1.8 exclusive of another molecular driver. Of these 40% (11/28) were female, 86% (24/28) were Caucasian, 7% (2/28) were African American and 79% (22/28) were current or former smokers. The median age at diagnosis was 63 years. There was no difference between the MET/CEP7 ≥ 1.8 group compared to the MET/CEP7 < 1.8 group with regards to race (p=0.6), smoking status (p=0.4), age at diagnosis (p=0.2) or response to first line chemotherapy (p=0.06). There was a significant difference in age (62 Vs 65 years, p = 0.03) when the cut-point MET/CEP7 ≥2.0 and when MET/CEP7 >2.2 (62 Vs 69 years, p=0.008) was used (Table 3). However, the number of patients in these groups was small.
3.8% of men had MET/CEP7 ≥ 1.8 compared to 1.6% of women with MET/CEP7 ≥1.8 and this was statistically significant (p=0.03) (Table 3). Similarly, 6.4% of patients with adrenal metastases had mean MET/CEP7 ≥ 1.8, compared to 2% of patients without adrenal metastases (p=0.03) (Table 3).
When we used MET/CEP7 ≥ 2.0 as cut-off points for positivity, the association with adrenal metastases remained significant (p = 0.04), when MET/CEP7 >2.2 was used, there was a trend towards significance (p = 0.06). However, the association with male gender was not seen at these levels (Table 3).
Clinical experience with MET inhibition
Three patients with MET/CEP7 ≥ 1.8 were treated with crizotinib in a clinical trial (24). None of these patients had a known alternative molecular driver. All patients were considered to have ‘high’ MET CNG by mean MET/cell selection criteria. Using the MET/CEP7 ratio, 2 patients had an intermediate ratio and only one had a high MET/CEP7 ratio.
One patient had a MET/CEP7 ratio of 2.58 and a mean MET/cell of 8.8 and received crizotinib in the third line setting. Their best response to treatment was disease progression. Another patient with a MET/CEP7 ratio of 4.47 and a mean MET/cell of 17.94 was treated with crizotinib in the fifth line setting and had a partial response to treatment lasting 5 months. The third patient, with a MET/CEP7 ratio of 10.1 and a mean MET/cell of 28.5, was treated in the first line setting and had a complete response to treatment lasting 7 months (Figure 3).
Figure 3.
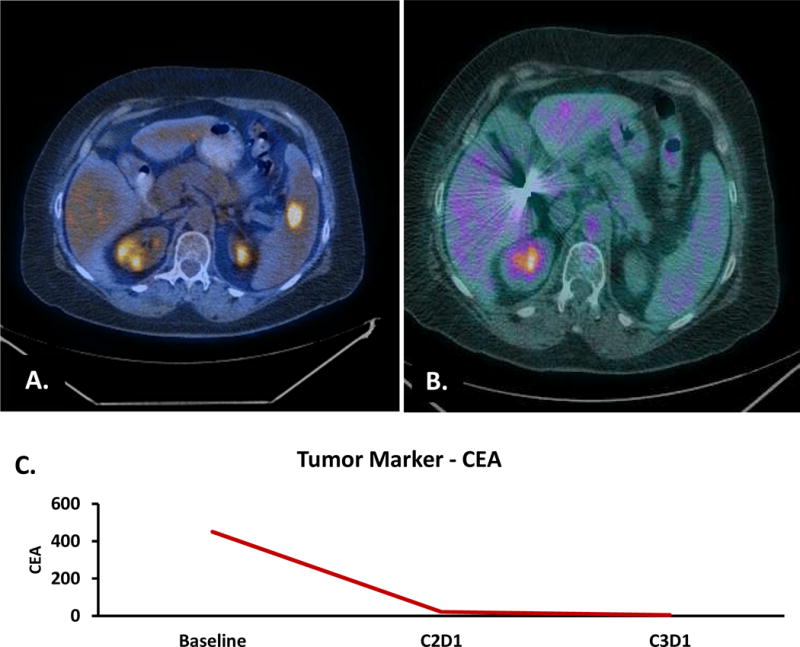
Complete Response to first line crizotinib in a patient with high MET/CEP7. A. Baseline Scan demonstrating splenic metastases. B. Complete metabolic and anatomic response on scan after 8 weeks of treatment. C. Corresponding carcinoembryonic antigen (CEA) at baseline, after one cycle and after two cycles. C2D1 = cycle 2 day 1. C3D1 = cycle 3 day 1.
There were 507 (45%) deaths in the overall patient population. There was no correlation between MET positivity defined by either FISH criteria and overall survival since initial cancer diagnosis or overall survival since metastatic diagnosis.
Discussion
This is the first large-scale study to attempt to define a molecularly and clinically distinct MET gene CNG-driven subset of lung adenocarcinoma. Two previously described methods of defining MET positivity using FISH were evaluated; mean MET/cell copy number of ≥ 5 and a mean MET/CEP7 ratio of ≥ 1.8 (24,27,29).
Minimal mean MET/cell positivity criteria identified over 3 times as many cases as the minimal MET/CEP7 ratio positivity criteria (14% Vs 4.5%) because the mean MET/cell criteria also includes cases of CNG due to general polysomy of chromosome 7.
Whether the positivity rates seen in our analysis can be directly extrapolated to a general lung adenocarcinoma population is debatable. Our dataset contained an excess of females (60%), Caucasians (85%), never smokers (33%) and the median age at diagnosis (62 years) was younger than in the general USA lung cancer population (35). EGFR mutations, the earliest widely identified targetable oncogene addicted subset of NSCLC, have well described associations with adenocarcinoma histology, female gender, Asian race and never smoking status, similarly ALK gene rearrangements are associated with adenocarcinomas and never smokers suggesting inherent biases could have existed in the cases being referred and/or being sent for molecular profiling (36–39).
Perhaps the greatest challenge with regard to confidently defining a MET CNG-driven subset of NSCLC is that MET CNG may be assessed using numerous criteria and the output of each is a continuous variable. In 56% and 47% of cases meeting minimal mean MET/cell and MET/CEP7 ratio positivity criteria respectively, there was overlap with other known oncogenic drivers (Table 1). While, like PIK3CA mutations, MET may perform an oncogenic supporting rather than a lead role, these data also suggest that these minimally MET positive criteria are, simply, too inclusive and many of these cases are not manifesting a true MET-driven state. Consistent with the latter hypothesis, a significant difference between the incidence of a concurrent molecular drivers was detected between groups with different degrees of MET/CEP7 positivity (p = 0.04) (Table 3). In fact, as the only MET positive group associated with zero oncogenic driver overlap, high level amplification with a MET/CEP7 ratio ≥ 5 represents the clearest candidate for a pure MET CNG-driven state, albeit with a very small absolute number of cases identified within this group in our study. This group was also associated with the highest ORR to crizotinib (67% in a separate report), where the median duration of response was 73.6 weeks (24). However, our dataset only includes 4 cases in this category and MET positive cases without other oncogenic drivers clearly exist in the lower MET/CEP7 categories. Responses, albeit less common and of shorter duration (ORR 17% and median duration of response of 16 weeks), were seen in the same study in cases with MET/CEP7 ratio >2.2 – <5 (24). Some of these cases may represent other, as yet unidentified, non-MET related oncogenic states, but the fact that responses to crizotinib (in patients known to be both ALK and ROS1 negative) do occur is consistent with a proportion of these also representing true MET-driven cases (24).
With so few cases in the highest MET/CEP7 category, conducting analyses of associated clinical variables would have been uninformative. Instead, we enriched our minimally MET positive cases for true MET-driven states by excluding all cases with other known molecular drivers. Using this approach, we saw evidence that men and those with adrenal metastases at diagnosis were more likely to have MET/CEP7 positive tumors (3.8% men Vs 1.6% women, p = 0.03 and 6.4% Vs 2%, p = 0.03, respectively). As the MET/CEP7 ratio identifies tumors where the MET region of chromosome 7 has been selected, the lack of an association in the enriched mean MET/cell group and in the unenriched MET/CEP7 group supports the idea that male predisposition and adrenal metastases could genuinely be associated with a true MET-driven NSCLC state, defined by MET/CEP7 and oncogene overlap methodologies. However, the association with male gender did not remain significant using MET/CEP7 cut-points of ≥ 2.0 and > 2.2 (Table 3).
The association with adrenal metastases was noted in the unenriched mean MET/cell group (p=0.004, Table 1) but this actually became less significant once cases with other known oncogenic drivers were excluded (p=0.08, Table 3). An LCMC study which defined MET positivity as ratio MET/CEP7 ≥ 2.0, also noted a marginal association with adrenal metastases (40). This association with adrenal metastases remained when we used ratios ≥ 2.0 as a cut-off point (p = 0.04) and trended towards significance with >2.2 (p = 0.06, Table 3). There is precedent for a defined oncogene-driven subgroup to manifest specific patterns of metastatic spread in both ALK and EGFR driven cancers (41).
The apparent lack of association with never-smoking status for MET-driven lung cancer has to be interpreted in a population dominated by cases with a smoking history. The lack of association seen here for MET may, in fact, be interpreted as consistent with a smoking etiology underlying the disease. Indeed 86% of the MET positive cases assessed within the reported crizotinib treated dataset to date had a smoking history, including 100% (6 of 6) within the highest MET/CEP7 amplified category (24).
MET exon 14 mutants have recently been described as sensitive to crizotinib inhibition (22). In the initial series on exon 14 skipping mutations, only 2 of 7 cases overlapped with MET CNG (with MET/CEP7 ratios of 6 and 3.8), suggesting that MET exon 14 mutation-driven cases can exist independently of MET CNG (22). In another series 10 of 28 cases with an MET exon 14 mutation had a MET/CEP7 ≥ 1.8, but as we have seen, use of a low threshold for defining MET CNG will produce overlap with a large number of known dominant oncogenes (42). However, whether the criteria described here for a MET-driven subtype of lung adenocarcinoma exists independently of exon 14 mutants, or is simply a surrogate marker for some of these cases (which may be missed by current assays) remains to be determined.
Other methods of analyzing the MET pathway, such as measuring protein expression were not assessed in this cohort of patients.
In conclusion, this is the first study to use oncogene overlap analysis to identify a subset of adenocarcinoma of the lung highly likely to manifest a MET-driven state based on MET copy number, specifically those with high MET/CEP7 amplification (MET/CEP7 ratio ≥ 5). This group, representing only 0.34% of adenocarcinomas within our dataset, is also associated with prominent responses to MET inhibitors in ongoing clinical trials (Figure 3) (24). Oncogene overlap is more marked when mean MET/cell is used and no group free from oncogene overlap could be identified using this method, suggesting that it is inferior to the MET/CEP7 ratio in identifying a true MET-driven state. Although it is less likely that cases with MET/CEP7 ratios below 5 are clinically relevant from a MET perspective, cases without overlap of other known oncogenes could still be detected at lower MET/CEP7 ratios, and some clinical responses to MET inhibition have been reported in this group, suggesting MET-driven cancers may still be enriched, if not uniformly identified, within a broader group (MET/CEP7 ratio ≥ 1.8 and free from oncogene overlap) representing 2.4% of our dataset. Admittedly this group could also contain cases driven by as yet unidentified dominant oncogenes or combinations of co-operating oncogenic changes. Given this caveat, within this group alone, an association between MET positivity and male gender, adrenal metastases and, importantly, no association with never smoking status, could be identified raising the possibility of definable clinical features being associated with what may still be cases enriched for a MET-driven state. Ongoing screening for MET/CEP7 positive lung cancer cases and exploration of their overlap with exon 14 alterations and responsiveness to MET inhibitors is warranted.
Table 4.
Clinical and demographic characteristics in patients with MET positivity when cases with other oncogenic drivers are excluded.
| MET positive patients with oncogenic drivers excluded | MEAN MET | MET/CEP7 RATIO | ||||||
|---|---|---|---|---|---|---|---|---|
| ≥ 5 | p value | ≥ 1.8 | p value | ≥ 2.0 | p value | > 2.2 | p value | |
| n = 44 (6.4%) | n = 28 (2.4%) | n = 20 (1.7%) | n=13 (1.1%) | |||||
| Gender: | n (%) | n (%) | n (%) | n (%) | ||||
| Male | 24 (55) | 0.08 | 17 (60) | 0.03 | 12 (60) | 0.07 | 6 (46) | 0.4 |
| Female | 20 (45) | 11 (40) | 8 (40) | 7 (54) | ||||
| Race: | ||||||||
| Caucasian | 35 (80) | 0.1 | 24 (86) | 0.6 | 17 (85) | 0.7 | 12 (92) | 0.7 |
| African Am. | 5 (11) | 2 (7) | 1 (5) | 0 | ||||
| Asian | 1 (2) | 0 | 0 | 0 | ||||
| Smoking Hx: | ||||||||
| Yes | 35 (80) | 0.15 | 22 (79) | 0.4 | 17 (85) | 0.2 | 12 (92) | 0.1 |
| Never | 9 (20) | 6 (21) | 3 (15) | 1 (8) | ||||
| Age at Diagnosis (yrs) | 64 | 0.4 | 63 | 0.2 | 65 | 0.03 | 69 | 0.008 |
| Site of Mets: | ||||||||
| Adrenal | 5 (13) | 0.08 | 5 (18) | 0.03 | 4 (20) | 0.04 | 3 (23) | 0.06 |
| Bone | 7 (18) | 0.5 | 5 (18) | 0.6 | 2 (10) | 0.2 | 1 (8) | 0.2 |
| Brain | 7 (18) | 0.8 | 5 (18) | 1.0 | 4 (20) | 1.0 | 2 (15) | 0.7 |
| Liver | 4 (10) | 0.6 | 1 (4) | 0.7 | 1 (5) | 1.0 | 1 (8) | 1.0 |
| Lung | 20 (50) | 0.4 | 15 (54) | 0.3 | 11 (55) | 0.6 | 7 (54) | 1.0 |
| Response to 1st Line: | ||||||||
| SD | 7 (20) | 0.09 | 4 (27) | 0.06 | 3 (33) | 0.8 | 3 (38) | 0.5 |
| PD | 9 (45) | 4 (27) | 3 (33) | 3 (38) | ||||
| PR | 3 (15) | 4 (27) | 2 (22) | 1 (13) | ||||
| CR | 0 | 3 (20) | 1 (11) | 1 (13) | ||||
Acknowledgments
The executive committee and the investigators of the Lung Cancer Mutation Consortium, Nancy Hart of the University of Colorado Pathology Dept. for assistance with data collection.
Disclosure of funding: This study was supported in part by the University of Colorado Lung Cancer SPORE (NCI-P50 CA058187) including the Tissue Banking and Biomarkers Core and the Biostatistics/Informatics/Bioinformatics Core, by the University of Colorado Cancer Center Support Grant (NCI-P30 CA046934) including the Molecular Pathology Shared Resource, and by the Lung Cancer Mutation Consortium (NCI-1RC2 CA48148394)
Footnotes
Publisher's Disclaimer: This is a PDF file of an unedited manuscript that has been accepted for publication. As a service to our customers we are providing this early version of the manuscript. The manuscript will undergo copyediting, typesetting, and review of the resulting proof before it is published in its final citable form. Please note that during the production process errors may be discovered which could affect the content, and all legal disclaimers that apply to the journal pertain.
DISCLOSURES:
Sinéad A. Noonan has nothing to disclose.
Lynne Berry has nothing to disclose.
Xian Lu has nothing to disclose.
Dexiang Gao has nothing to disclose.
Anna E. Barón has nothing to disclose.
Patrick Chesnut has nothing to disclose.
Jamie Sheren has nothing to disclose.
Dara L. Aisner reports personal fees from AstraZeneca, personal fees from Clovis Oncology, outside the submitted work.
Dan Merrick reports personal fees from ARIAD, outside the submitted work.
Robert C. Doebele reports grants from Mirati, Loxo Oncology, Ignyta, and Threshold; personal fees from Pfizer, Ariad, Clovis, AstraZeneca, and Array, outside the submitted work; In addition, Dr. Doebele has a patent NTRK1 biomarkers with royalties paid from Abbott Molecular and Licensing fees from Chugai, Ariad, GVKbio, and Blueprint Medicines.
Marileila Varella-Garcia reports non-financial support from Abbott Molecular, grants from Abbott Molecural, other from Merck, outside the submitted work.
D. Ross Camidge reports other from Pfizer, outside the submitted work.
Prior Presentations:
Defining MET Copy Number Driven Lung Cancer Molecularly and Clinically International Association of the Study of Lung Cancer (IASLC), September, 2015 Oral 37.06 abstr 2379
References
- 1.Kris MG, Johnson BE, Berry LD, Kwiatkowski DJ, Iafrate AJ, Wistuba II, et al. Using multiplexed assays of oncogenic drivers in lung cancers to select targeted drugs. JAMA. American Medical Association. 2014 May 21;311(19):1998–2006. doi: 10.1001/jama.2014.3741. [DOI] [PMC free article] [PubMed] [Google Scholar]
- 2.Rosell R, Carcereny E, Gervais R, Vergnenegre A, Massuti B, Felip E, et al. Erlotinib versus standard chemotherapy as first-line treatment for European patients with advanced EGFR mutation-positive non-small-cell lung cancer (EURTAC): a multicentre, open-label, randomised phase 3 trial. Lancet Oncol. 2012 Mar;13(3):239–46. doi: 10.1016/S1470-2045(11)70393-X. [DOI] [PubMed] [Google Scholar]
- 3.Planchard D, Kim TM, Mazières J, Quoix E, Riely GJ, Barlesi F, Souquet P, Smit EF, Groen HJM, Kelly R, Cho B, Socinski MA, Tucker C, Ma B, Mookerjee B, Curtis CM, Jr, Johnson BE. Dabrafenib in patients with BRAF V600E-mutant advanced non-small cell lung cancer (NSCLC): A multicenter, open-label, phase II trial (BRF113928) Ann Oncol. 2014;25(suppl 4) abstract LBA38_PR. [Google Scholar]
- 4.Camidge DR, Bang Y-J, Kwak EL, Iafrate AJ, Varella-Garcia M, Fox SB, et al. Activity and safety of crizotinib in patients with ALK-positive non-small-cell lung cancer: updated results from a phase 1 study. Lancet Oncol. 2012 Oct;13(10):1011–9. doi: 10.1016/S1470-2045(12)70344-3. [DOI] [PMC free article] [PubMed] [Google Scholar]
- 5.Shaw AT, Ou S-HI, Bang Y-J, Camidge DR, Solomon BJ, Salgia R, et al. Crizotinib in ROS1-Rearranged Non–Small-Cell Lung Cancer. N Engl J Med. 2014 Sep 27;371(21) doi: 10.1056/NEJMoa1406766. 140927034510006. [DOI] [PMC free article] [PubMed] [Google Scholar]
- 6.Guibert N, Ilie M, Long E, Hofman V, Bouhlel L, Brest P, et al. KRAS Mutations in Lung Adenocarcinoma: Molecular and Epidemiological Characteristics, Methods for Detection, and Therapeutic Strategy Perspectives. Curr Mol Med. 2015 May 5; doi: 10.2174/1566524015666150505161412. [DOI] [PubMed] [Google Scholar]
- 7.Arcila ME, Chaft JE, Nafa K, Roy-Chowdhuri S, Lau C, Zaidinski M, et al. Prevalence, clinicopathologic associations, and molecular spectrum of ERBB2 (HER2) tyrosine kinase mutations in lung adenocarcinomas. Clin Cancer Res. 2012 Sep 15;18(18):4910–8. doi: 10.1158/1078-0432.CCR-12-0912. [DOI] [PMC free article] [PubMed] [Google Scholar]
- 8.Ohashi K, Sequist LV, Arcila ME, Lovly CM, Chen X, Rudin CM, et al. Characteristics of lung cancers harboring NRAS mutations. Clin Cancer Res. 2013 May 1;19(9):2584–91. doi: 10.1158/1078-0432.CCR-12-3173. [DOI] [PMC free article] [PubMed] [Google Scholar]
- 9.Kohno T, Ichikawa H, Totoki Y, Yasuda K, Hiramoto M, Nammo T, et al. KIF5B-RET fusions in lung adenocarcinoma. Nat Med. 2012 Mar;18(3):375–7. doi: 10.1038/nm.2644. [DOI] [PMC free article] [PubMed] [Google Scholar]
- 10.Ma PC, Maulik G, Christensen J, Salgia R. c-Met: Structure, functions and potential for therapeutic inhibition. Cancer Metastasis Rev. 2003;22(4):309–25. doi: 10.1023/a:1023768811842. [DOI] [PubMed] [Google Scholar]
- 11.Gherardi E, Youles ME, Miguel RN, Blundell TL, Iamele L, Gough J, et al. Functional map and domain structure of MET, the product of the c-met protooncogene and receptor for hepatocyte growth factor/scatter factor. Proc Natl Acad Sci U S A. 2003 Oct 14;100(21):12039–44. doi: 10.1073/pnas.2034936100. [DOI] [PMC free article] [PubMed] [Google Scholar]
- 12.Cooper CS, Park M, Blair DG, Tainsky MA, Huebner K, Croce CM, et al. Molecular cloning of a new transforming gene from a chemically transformed human cell line. Nature. Jan;311(5981):29–33. doi: 10.1038/311029a0. [DOI] [PubMed] [Google Scholar]
- 13.Bottaro DP, Rubin JS, Faletto DL, Chan AM, Kmiecik TE, Vande Woude GF, et al. Identification of the hepatocyte growth factor receptor as the c-met proto-oncogene product. Science. 1991 Feb 15;251(4995):802–4. doi: 10.1126/science.1846706. [DOI] [PubMed] [Google Scholar]
- 14.Gaule PB, Crown J, O’Donovan N, Duffy MJ. cMET in triple-negative breast cancer: is it a therapeutic target for this subset of breast cancer patients? Expert Opin Ther Targets. 2014 Sep;18(9):999–1009. doi: 10.1517/14728222.2014.938050. [DOI] [PubMed] [Google Scholar]
- 15.Noguchi E, Saito N, Kobayashi M, Kameoka S. Clinical significance of hepatocyte growth factor/c-Met expression in the assessment of gastric cancer progression. Mol Med Rep. 2015 May;11(5):3423–31. doi: 10.3892/mmr.2015.3205. [DOI] [PMC free article] [PubMed] [Google Scholar]
- 16.Mesteri I, Schoppmann SF, Preusser M, Birner P. Overexpression of CMET is associated with signal transducer and activator of transcription 3 activation and diminished prognosis in oesophageal adenocarcinoma but not in squamous cell carcinoma. Eur J Cancer. 2014 May;50(7):1354–60. doi: 10.1016/j.ejca.2014.01.022. [DOI] [PubMed] [Google Scholar]
- 17.Lee J, Jain A, Kim P, Lee T, Kuller A, Princen F, et al. Activated cMET and IGF1R-driven PI3K signaling predicts poor survival in colorectal cancers independent of KRAS mutational status. PLoS One. 2014 Jan;9(8):e103551. doi: 10.1371/journal.pone.0103551. [DOI] [PMC free article] [PubMed] [Google Scholar]
- 18.Balan M, Mier y Teran E, Waaga-Gasser AM, Gasser M, Choueiri TK, Freeman G, et al. Novel roles of c-Met in the survival of renal cancer cells through the regulation of HO-1 and PD-L1 expression. J Biol Chem. 2015 Mar 27;290(13):8110–20. doi: 10.1074/jbc.M114.612689. [DOI] [PMC free article] [PubMed] [Google Scholar]
- 19.Li H, Zhang H, Zhao S, Shi Y, Yao J, Zhang Y, et al. Overexpression of MACC1 and the association with hepatocyte growth factor/c-Met in epithelial ovarian cancer. Oncol Lett. 2015 May;9(5):1989–96. doi: 10.3892/ol.2015.2984. [DOI] [PMC free article] [PubMed] [Google Scholar]
- 20.PC Ma, Jagadeeswaran R, Jagadeesh S, Tretiakova MS, Nallasura V, Fox EA, et al. Functional Expression and Mutations of c-Met and Its Therapeutic Inhibition with SU11274 and Small Interfering RNA in Non – Small Cell Lung Cancer. 2005;(13):1479–88. doi: 10.1158/0008-5472.CAN-04-2650. [DOI] [PubMed] [Google Scholar]
- 21.Gherardi E, Birchmeier W, Birchmeier C, Vande Woude G. Targeting MET in cancer: rationale and progress. Nat Rev Cancer. 2012 Feb;12(2):89–103. doi: 10.1038/nrc3205. [DOI] [PubMed] [Google Scholar]
- 22.Schildhaus H-U, Schultheis AM, Rüschoff J, Binot E, Merkelbach-Bruse S, Fassunke J, et al. MET amplification status in therapy-naïve adeno- and squamous cell carcinomas of the lung. Clin Cancer Res. 2015 Feb 15;21(4):907–15. doi: 10.1158/1078-0432.CCR-14-0450. [DOI] [PubMed] [Google Scholar]
- 23.Paik PK, Drilon A, Fan P-D, Yu H, Rekhtman N, Ginsberg MS, et al. Response to MET Inhibitors in Patients with Stage IV Lung Adenocarcinomas Harboring MET Mutations Causing Exon 14 Skipping. Cancer Discov. 2015 May 13;5(8):842–9. doi: 10.1158/2159-8290.CD-14-1467. [DOI] [PMC free article] [PubMed] [Google Scholar]
- 24.Camidge DR, Ou SH, Shapiro G, et al. Efficacy and safety of crizotinib in patients with advanced c-MET-amplified non-small cell lung cancer (NSCLC) J Clin Oncol. 2014;32(5 suppl) abstr 8001. [Google Scholar]
- 25.Bean J, Brennan C, Shih J-Y, Riely G, Viale A, Wang L, et al. MET amplification occurs with or without T790M mutations in EGFR mutant lung tumors with acquired resistance to gefitinib or erlotinib. Proc Natl Acad Sci U S A. 2007 Dec 26;104(52):20932–7. doi: 10.1073/pnas.0710370104. [DOI] [PMC free article] [PubMed] [Google Scholar]
- 26.Beau-Faller M, Ruppert A-M, Voegeli A-C, Neuville A, Meyer N, Guerin E, et al. MET gene copy number in non-small cell lung cancer: molecular analysis in a targeted tyrosine kinase inhibitor naïve cohort. J Thorac Oncol. 2008 Apr;3(4):331–9. doi: 10.1097/JTO.0b013e318168d9d4. [DOI] [PubMed] [Google Scholar]
- 27.Casadevall D, Gimeno J, Clavé S, Taus Á, Pijuan L, Arumí M, et al. MET expression and copy number heterogeneity in nonsquamous non-small cell lung cancer (nsNSCLC) Oncotarget. 2015 Jun 30;6(18):16215–26. doi: 10.18632/oncotarget.3976. [DOI] [PMC free article] [PubMed] [Google Scholar]
- 28.Watermann I, Schmitt B, Stellmacher F, Müller J, Gaber R, Kugler C, et al. Improved diagnostics targeting c-MET in non-small cell lung cancer: expression, amplification and activation? Diagn Pathol. 2015 Jan;10(1):130. doi: 10.1186/s13000-015-0362-5. [DOI] [PMC free article] [PubMed] [Google Scholar]
- 29.Cappuzzo F, Marchetti A, Skokan M, Rossi E, Gajapathy S, Felicioni L, et al. Increased MET gene copy number negatively affects survival of surgically resected non-small-cell lung cancer patients. J Clin Oncol. 2009;27(10):1667–74. doi: 10.1200/JCO.2008.19.1635. [DOI] [PMC free article] [PubMed] [Google Scholar]
- 30.Bang Y-J, Su W-C, Nam D-H, Lim W-T, Bauer TM, Brana I, et al. Phase I study of the safety and efficacy of INC280 in patients with advanced MET-dependent solid tumors. J Clin Oncol. 2014;32:5s. (suppl; abstr 2520) [Google Scholar]
- 31.Sholl LM, Aisner DL, Varella-Garcia M, Berry LD, Dias-Santagata D, Wistuba II, et al. Multi-institutional Oncogenic Driver Mutation Analysis in Lung Adenocarcinoma. J Thorac Oncol. 2015;10(5):768–77. doi: 10.1097/JTO.0000000000000516. [DOI] [PMC free article] [PubMed] [Google Scholar]
- 32.Wang L, Hu H, Pan Y, Wang R, Li Y, Shen L, et al. PIK3CA mutations frequently coexist with EGFR/KRAS mutations in non-small cell lung cancer and suggest poor prognosis in EGFR/KRAS wildtype subgroup. PLoS One. 2014 Jan;9(2):e88291. doi: 10.1371/journal.pone.0088291. [DOI] [PMC free article] [PubMed] [Google Scholar]
- 33.Chaft JE, Arcila ME, Paik PK, Lau C, Riely GJ, Pietanza MC, et al. Coexistence of PIK3CA and other oncogene mutations in lung adenocarcinoma-rationale for comprehensive mutation profiling. Mol Cancer Ther. 2012 Feb;11(2):485–91. doi: 10.1158/1535-7163.MCT-11-0692. [DOI] [PMC free article] [PubMed] [Google Scholar]
- 34.Wolff AC, Hammond MEH, Hicks DG, Dowsett M, McShane LM, Allison KH, et al. Recommendations for human epidermal growth factor receptor 2 testing in breast cancer: American Society of Clinical Oncology/College of American Pathologists clinical practice guideline update. J Clin Oncol. 2013 Nov 1;31(31):3997–4013. doi: 10.1200/JCO.2013.50.9984. [DOI] [PubMed] [Google Scholar]
- 35.American Cancer Society [Internet] Available from: http://www.cancer.org/research/cancerfactsstatistics/cancerfactsfigures2015/index.
- 36.Pao W, Miller V, Zakowski M, Doherty J, Politi K, Sarkaria I, et al. EGF receptor gene mutations are common in lung cancers from “never smokers” and are associated with sensitivity of tumors to gefitinib and erlotinib. Proc Natl Acad Sci U S A. 2004 Sep 7;101(36):13306–11. doi: 10.1073/pnas.0405220101. [DOI] [PMC free article] [PubMed] [Google Scholar]
- 37.D’Angelo SP, Pietanza MC, Johnson ML, Riely GJ, Miller VA, Sima CS, et al. Incidence of EGFR Exon 19 Deletions and L858R in Tumor Specimens From Men and Cigarette Smokers With Lung Adenocarcinomas. J Clin Oncol. 2011;29(15):2066–70. doi: 10.1200/JCO.2010.32.6181. [DOI] [PMC free article] [PubMed] [Google Scholar]
- 38.Girard N, Sima CS, Jackman DM, Sequist LV, Chen H, Yang JC-H, et al. Nomogram to predict the presence of EGFR activating mutation in lung adenocarcinoma. Eur Respir J. 2012 Feb;39(2):366–72. doi: 10.1183/09031936.00010111. [DOI] [PubMed] [Google Scholar]
- 39.Camidge DR, Kono SA, Flacco A, Tan A-C, Doebele RC, Zhou Q, et al. Optimizing the detection of lung cancer patients harboring anaplastic lymphoma kinase (ALK) gene rearrangements potentially suitable for ALK inhibitor treatment. Clin Cancer Res. 2010 Nov 15;16(22):5581–90. doi: 10.1158/1078-0432.CCR-10-0851. [DOI] [PMC free article] [PubMed] [Google Scholar]
- 40.Varella-Garcia M, Berry L, Su Pei-Fang, Franklin WA, Iafrate JA, Ladanyi M, Camidge DR, Garon EB, Haura EB, Horn L, Khuri FR, Pao W, Rudin C, Shaw AT, Schiller JH. Lung adenocarcinomas: The Lung Cancer Mutation Consortium experience. 2012. J Clin Oncol. 2012;30 (suppl; abstr 7589) [Google Scholar]
- 41.Doebele RC, Lu X, Sumey C, Maxson DA, Weickhardt AJ, Oton AB, et al. Oncogene status predicts patterns of metastatic spread in treatment-naive nonsmall cell lung cancer. Cancer. 2012 Sep 15;118(18):4502–11. doi: 10.1002/cncr.27409. [DOI] [PMC free article] [PubMed] [Google Scholar]
- 42.Awad MM, Oxnard GR, Jackman DM, Savukoski DO, Hall D, Shivdasani P, et al. MET Exon 14: Mutations in Non-Small-Cell Lung Cancer Are Associated With Advanced Age and Stage-Dependent MET Genomic Amplification and c-Met Overexpression. J Clin Oncol. 2016 Jan 4; doi: 10.1200/JCO.2015.63.4600. JCO.2015.63.4600 –. [DOI] [PubMed] [Google Scholar]