Abstract
Histones are involved in epigenetic control of a wide variety of cellular processes through their multiple post-translational modifications. Their strongly cationic nature makes them challenging to separate with reversed-phase liquid chromatography coupled to mass spectrometry (RPLC-MS), where trifluoroacetic acid is avoided due to adduct formation. Columns with higher resolution are needed. In this work, RPLC-MS is performed on a histone sample using difluoroacetic acid and a 20-minute gradient. Columns with C18 surfaces are compared for two different types of particle morphologies: 1) fully porous particles of 5 μm in diameter, 2) superficially porous particles of 3 μm in diameter with a shell of 0.2 μm. The resolution for the histone separation is better for the latter column, but only when the modifier is trifluoroacetic acid, which is used with UV absorbance detection. When difluoroacetic acid is used for LCMS, the peaks broaden enough to erase the advantage in efficiency for the superficially porous particles. The fully porous and superficially porous cases show similar performance in RPLC-MS, with slightly higher resolution for the fully porous particles. The expected advantage of the shorter diffusion distances for the superficially porous particles is shown to be outweighed by the lower selectivity of its bonded phase.
INTRODUCTION
Histones, including core histones (H2A, H2B, H3 and H4) and linker histones (H1), are basic chromosomal proteins that are thought to regulate many physiological processes, mostly through their post-translational modifications (PTMs) [1,2]. These PTMs, most frequently phosphorylation, methylation, acetylation and ubiquitination [3], can work individually or cooperatively to generate a ‘histone code’ that participates in the regulation of various cellular responses, such as gene transcription and DNA repair [1,4,5]. Recent studies showed that the levels of histone PTMs correlate with different stages of cancer [6,7]. Therefore, understanding the function and mechanism of histones PTMs could benefit early diagnosis and treatment for cancer, as well as other diseases. The analysis of PTMs on intact histones is difficult due to the large number of histone variants, which can differ by only a few amino acid sequences, and the large number of known modification sites [2]. Conventional bottom-up proteomics loses PTM information in the digestion processes by disconnecting sites of modification, making the direct readout of a histone code difficult [8,9]. Top-down proteomics has proven to be an effective method for analysis of intact histones because of its unique ability to characterize multiple PTMs on the same protein [9,10]. Characterization of intact histones, rather than digests, is essential to fully utilize histone PTMs as biomarkers for cancer diagnosis.
Kelleher and coworkers discovered 42 proteoforms of histone H4 through the use of an offline RPLC-HILIC-FTMS [11,12]. With RPLC-MS, Su et al. completed the profiling of whole histones and the PTMs, including methylation and acetylation [13]. Contrepois et al. developed a method to characterize core histone variants and PTMs in 20 min via RPLC-LTQ-Orbitrap [14]. However, owing to the poor resolution of RPLC of histone variants, these LC-MS methods suffer from laborious fractionation and long analysis time. Methods that use a faster gradient to reduce analysis time would otherwise sacrifice the resolution and increase the complexity of mass spectra. The highly cationic nature of histones poses a challenge with silica-based chromatographic columns because the lower acidity of the mobile phase additives used with mass spectrometry gives rise to peak broadening from silanols. Hence, higher efficiency columns for RPLC-MS are needed for intact histones in top-down proteomics.
There have been exciting advances in RPLC of small molecules, including the introduction of sub-2 μm particles [15], and more recently, superficially porous particles [16]. These reduce the distance for protein diffusion, which has been shown to significantly improve chromatographic efficiency for proteins [17]. Despite these advances, the conventional 5 fully porous particles continue to be used for RPLC-MS of histones. The purpose of this paper is to compare RPLC-MS for commercial columns of fully porous 5 μm particles and superficially porous 3 μm particles, both with C18 bonded phases, and both with columns dimensions of 1.0 mm × 150 mm.
MATERIALS AND METHODS
Materials
Acetonitrile, TFA, DFA and histones (bovine calf thymus) were purchased from Sigma- Aldrich (St. Louis, MO, USA). Water was dispensed from a Millpore (Milli-Q®) system.
Commercial columns
A column packed with fully porous 5 μm particles, Discovery C18 (1 mm × 150 mm, 5 μm particle size, 30 nm pore size), which has been used for histone proteomics [13], was purchased from Supelco (St. Louis, MO). A column packed with superficially porous particles, Halo (1 mm × 150 mm, 3 μm particle size, 0.2 μm shell thickness, 40 nm pore size), was purchased from Advanced Materials Technology (Wilmington, DE).
Instrumentation
The LCMS experiments were performed with a Thermo Accela UHPLC coupled to a Thermo LTQ Velos mass spectrometer through the standard electrospray interface provided with the instrument. For gradient elution, mobile phases A and B were water and acetonitrile, respectively, with the same amount of acidic modifier in each, as described later. The flow rate was 150 μL/min. After loading, the mobile phase composition was held at 1% B for 2 min, then a gradient was run from 25% to 50% B over the next 20 min. At the end of the gradient, the composition was held at 70% B for 1 min, followed by re-equilibration with a mobile phase composition of 1% B for 8 min. The electrospray voltage was kept at 2.4 kV. All mass spectra were obtained under positive ion mode over the mass range from 650 to 2000 m/z. The deconvolution of all mass spectra was performed with MagTran 1.0 software.
RESULTS AND DISCUSSION
Optimization of the separations for the commercial columns
Gradient elution of proteins requires optimization with respect to gradient time and flow rate to achieve an average retention factor that is between 2 and 10 [18]. For the two commercial columns of fully porous 5 μm particles and superficially porous 3 μm particles with 0.2 μm shell, Figure 1A and B show the chromatograms for varying flow rate with a fixed gradient time of 20 min and Δϕ of 25%. The detection was with ESI-MS, displaying base peak intensity over 650–2000 m/z. A relative change in peak heights with flow rate for the various histones occurs for both columns, and this is due to the concentration nonlinearity of the electrospray process. The higher flow rate gives more dilution, thereby showing fewer peaks for both columns. The resolution is shown to change slowly with flow rate, as one would expect, and a flow rate of 150 μL/min appears to be optimal for both. A closer look at the resolution of the core histones is displayed in Figure 1C and D, which are the same chromatograms as in A and B, respectively, but plotted on an expanded intensity scale. The fully porous particles resolve more peaks in between the two major peaks of the core histones, and again, 150 μL/min is reasonably optimal for both columns. It is not surprising that they have similar optimal flow rates since both columns have C18 bonded phases.
Figure 1.
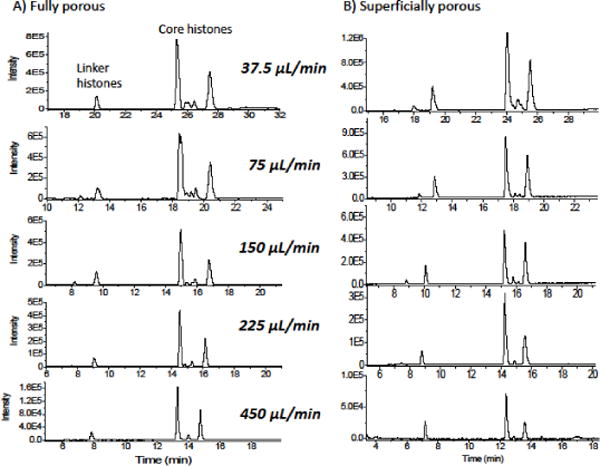
Optimization of gradient for each of the two columns, with detection by mass spectrometry. The peaks for the linker and core histones are indicated for columns having A) fully porous particles B) for superficially porous particles. The core histone region is shown in an expanded time scale for C) fully porous particles B) superficially porous particles. A constant gradient time of 25 to 50% acetonitrile in water with 0.1% DFA was used, with flow rate varying from 37.5 to 450 μL/min. The optimal flow rate is similar for both, indicated by the oval, for 150 μL/min. 0.8 μg were injected in each case.
The dependence of the chromatograms on protein loading is shown in Figure 2. These chromatograms were obtained by varying the injection volume, and the case of 0.8 μg injected corresponds to the chromatograms in Figure 1. The results show that the smaller peaks gain intensity relative to the larger peaks as the amount injected increases. This nonlinear behavior is normal for electrospray, as mentioned earlier. The resolution changes only slightly as the amount injected increases over this range, indicating that there is negligible column overloading.
Figure 2.
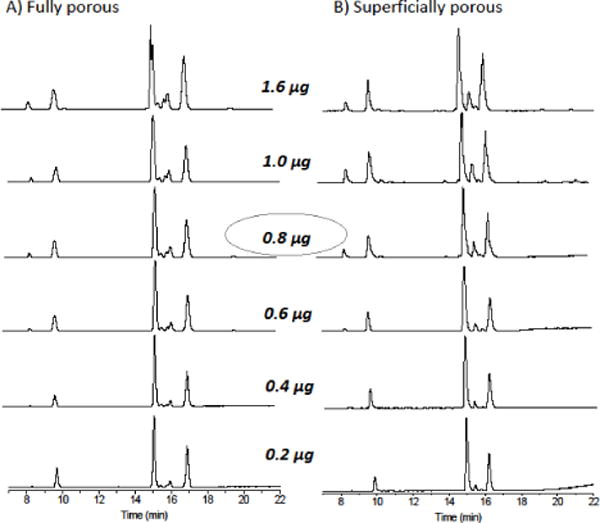
Dependence of chromatograms on the amount loaded for columns with fully porous and superficially porous particles, both at the same gradient as in Figure 1 and for the flow rate of 150 uL/min. The numbers in the middle indicate the amount injected, varying from 1.6 to 0.2 μg/mL, from top to bottom. Mass spectrometry was used for detection.
Peak identification
The peak assignments for the chromatograms from the two columns are shown in Figure 3A and B. Two main peaks for the linker histone, H1, appear earliest, and peaks for the core histones, H2A, H2B, H3 and H4, appear later, with all peaks assigned based on the deconvoluted mass spectra. Some additional H2B peaks are observed at earlier times when a large amount of histone is injected, as indicated in blue in Figures 3A and B. More H3 histone proteoforms appear later, and at higher loading as indicated in magenta. The dashed red lines help to illustrate that elution order of the peaks is the same, except for a reversal of order for the H3-1 and H2A-1 peaks.
Figure 3.
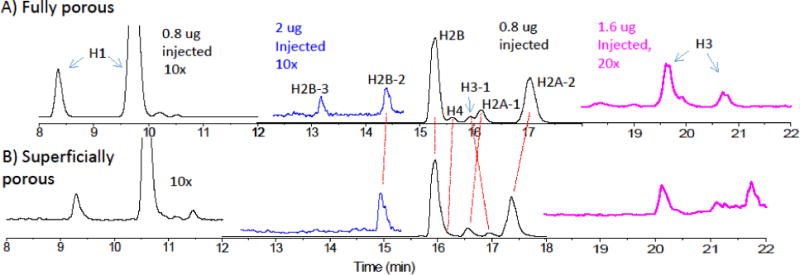
Peak assignments for core histones from LCMS using the columns with superficially porous and fully porous particles. The two chromatograms are shown on the same time axis. The loading was 0.8 μg (black) and 2 μg (red), and the flow rate was 150 uL/min. The assignments, based on the mass spectra, are as indicated on the figure. The deconvoluted mass spectra used to make these assignments are shown for each major peak for the columns with C) the fully porous and D) the superficially porous particles.
The deconvoluted mass spectra for the peaks in Figures 3A and B are shown in Figures 3C and D, respectively. All deconvoluted mass spectra show multiple proteins, which is expected based on the many post-translational modifications of the histones. For the fully porous case, the largest H2B peak and its adjacent H4 peak were resolved, whereas these two peaks overlapped for the superficially porous case. The mass spectra in Figure 3C show a handful of peaks for this same H2B and many peaks for H4, and while the mass spectra for the superficially porous column agreed, the more abundant H2B apparently suppressed ionization for the H4. This underscores the importance of improving chromatographic resolution, showing how a lower chromatographic resolution hampers the sensitivity of mass spectrometry. The mass spectra for the remaining core histones are quite similar, again all showing multiple proteins peaks due to the rich set of post-translational modifications.
Comparison of resolution for the commercial columns
Figure 3A and B suggest that the resolution is higher for the fully porous particles. This result is unexpected, suggesting a deeper look to be in order. One issue that needs to be considered in comparing two columns with respect to resolution in the gradient elution of proteins is that all of the peaks are comprised of multiple proteins. This means that a wider peak could reflect a wider distribution of retention times for the constituent proteins rather than lower column efficiency. This can be addressed by using extracted ion chromatograms, provided that there are few enough proteins to resolve one proteoforms based on its unique m/z. Figure 4 shows the chromatograms for the lowest injected concentration, 0.2 μg of histone, which gives the fewest proteins per peak, for the columns with A) the fully porous particles and B) the superficially porous particles. The extracted ion chromatogram of the H2A peak was obtained from the most abundant protein, which is shown in the deconvoluted mass spectra of Figures 4C and D, illustrating that the peaks have the same protein of mass=14,007±1 Da. The widths of the peaks are similar, with the superficially porous particles giving a 10% narrower peak. This is consistent with the expectation that the column efficiency would be higher for the superficially porous particles. Since these peaks are from gradient elution, they do not directly report on column efficiency since focusing occurs during gradient elution. The question remains as to why this advantage in efficiency for the superficially porous particles does not improve the resolution of the histones.
Figure 4.
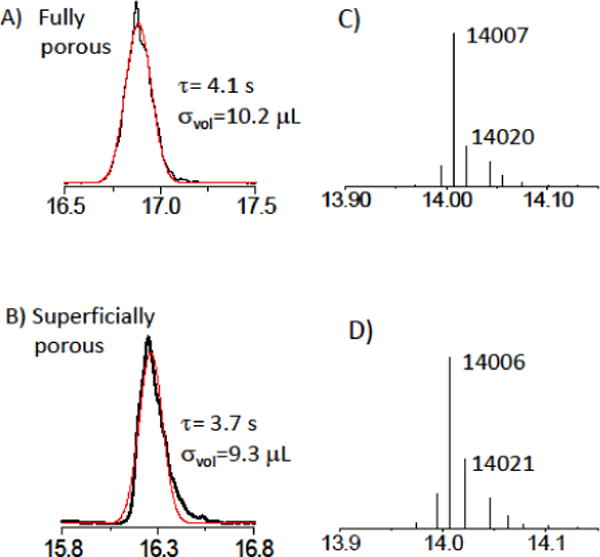
Extracted ion chromatogram for the H2A-2 peak for each of the columns, using the chromatograms for the lowest amount injected, 0.2 μg, for A) fully porous particles B) superficially porous particles. The standard deviation of the Gaussian is indicated as τ in the figure C,D) Deconvoluted mass spectra for the main protein in the H2A-2 peak in the respective chromatograms, showing that the protein content of each peak is the same.
Use of UV detection to determine the effect of the acidic modifier
Histone separations are especially sensitive to acidic modifiers because their high abundances of lysines and arginines invite coulombic interactions with silanols. The modifier used for highest efficiency in RPLC is trifluoroacetic acid (TFA), which has a lower pKa than other organic acids and it also ion-pairs with proteins to increase protein hydrophobicity. On the other hand, TFA does not work well for LCMS because the high surface activity of TFA leads to ineffective spray formation in ESI, resulting in inadequate sensitivity [19]. Formic acid is typically used to replace TFA, but it gives lower chromatographic resolution due to its higher pKa [20]. A compromise is difluoroacetic acid (DFA), which has a lower pKa than formic acid and less surface activity than TFA [21]. To gauge how much chromatographic efficiency is lost in using modifiers other than TFA, RPLC with UV detection was used for the histone separation. The use of UV detection avoids issues in the electrospray process in assessing the chromatographic resolution.
Figure 5 shows chromatograms for the two columns, where detection was done by UV absorbance to enable a comparison of difluoroactic acid (DFA) with trifluoroacetic acid (TFA). The chromatograms show that the superficially porous particles enable impressive resolution when 0.1% TFA is used as the modifier, giving much sharper peaks than does the column with fully porous particles. Nonetheless, the selectivity is somewhat lower. The bonded phases do differ in that the fully porous particles have a conventional C18 monolayer made from chlorodimethyloctadecylsilane, whereas the superficially porous particles have a C18 monolayer made from chlorodiisobutyloctadecylsilane, which will give lower bonding density. The greater peak separation is consistent with the greater hydrophobicity of the bonded phase for the fully porous particles. This is only a small part of the story, the larger effect is the broadening from the use of DFA for the superficially porous particles. The chromatograms of Figure 5 show that there is significant broadening in going from 0.1% TFA to 0.1% DFA for the superficially porous particles, but the already broader peaks of the fully porous particles remain approximately the same width. The numbers are detailed in Table 1. This broadening from using DFA is the essence of the reason why the two columns are so similar: the loss of efficiency in going from TFA to DFA puts the superficially porous particles on par with the fully porous particles. The data of Figure 5 further show that both columns lose efficiency as the amount of DFA is decreased to 0.05%, further supporting the importance of the role of the acidic modifier in column efficiency. Overall, the resolution between the two largest core histone peaks is 10% higher for the fully porous particles, due to the higher selectivity of the bonded phase of the fully porous particles outweighing the higher efficiency of the superficially porous particles. If the two materials had identical bonded phases, the superficially porous particles would be expected, based on the higher efficiency shown in the top two panels of Figure 5, to give 10% higher resolution. Nonetheless, these differences in performance are small.
Figure 5.
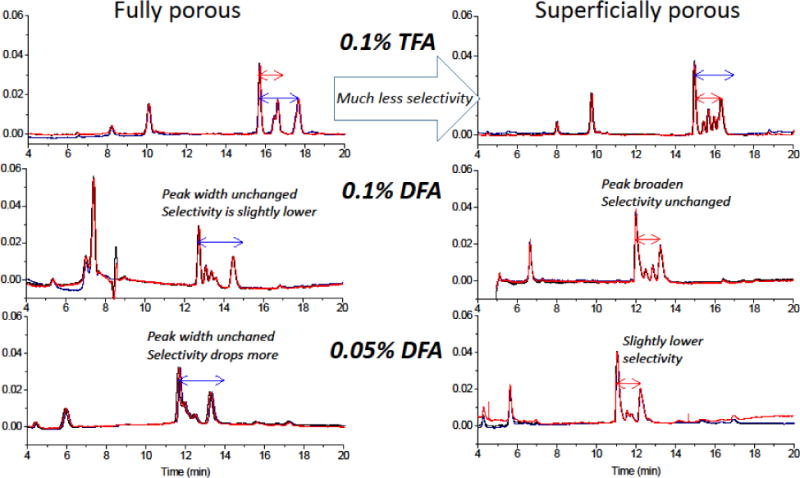
Relation between selectivity and acidic modifier. Using UV detection, the modifier was varied from 0.1% TFA to 0.1% DFA to 0.05% DFA while all else was the same. Triplicate runs of each chromatogram are plotted to show the high precision. The red arrow indicates the spacing between two peaks in the chromatograms for the superficially porous particles using 0.1% TFA, and the same arrow size is positioned on all of the chromatograms for comparison. The results show that the entire chromatogram is shifted to longer times for the fully porous particles in all cases, and that the peak spacing is further for the fully porous particles in all cases. Within a chromatogram, the modifier has negligible effect on selectivity of hydrophobicity of bonded phase. For these chromatograms, the same conditions as in Figure 3 were used. The UV detection wavelength was 210 nm.
Table 1.
Separation times (min) corresponding to the arrows between H2A and H2B core histone peaks in Figure 5, and the averages and standard deviations.
| Fully porous | Superficially porous | |||
|---|---|---|---|---|
| 0.1% TFA | 1.972 | 1.97±0.01 | 1.344 | 1.348±0.004 |
| 1.977 | 1.352 | |||
| 1.952 | 1.347 | |||
| 0.1% DFA | 1.722 | 1.74±0.01 | 1.237 | 1.243±0.007 |
| 1.741 | 1.241 | |||
| 1.743 | 1.251 | |||
| 0.05% DFA | 1.603 | 1.602±0.002 | 1.176 | 1.175±0.002 |
| 1.600 | 1.177 | |||
| 1.604 | 1.173 | |||
Conclusions
Better bonded phases are needed for RPLC-MS of intact histones. The multiplicity of post-translational modifications under one peak, in addition to ion suppression of lower abundance proteins by higher abundance ones, necessitates higher resolution in RPLC. The highly cationic histones have deleterious electrostatic interactions with the surface silanols, giving peak broadening for RPLC-MS since TFA cannot be used. The use of DFA masks the intrinsically higher column efficiency gained by the superficially porous particles. Bonded phases that decrease or screen the surface charge would be valuable. In addition, since selectivity is lower without TFA due to lesser ion-pairing, bonded phases giving higher selectivity in RPLC would be valuable for giving improved resolution of intact histones.
Acknowledgments
This research was carried out in collaboration with the National Resource for Translational and Developmental Proteomics under Grant P41 GM108569 from the National Institute of General Medical Sciences, National Institutes of Health.
Footnotes
Publisher's Disclaimer: This is a PDF file of an unedited manuscript that has been accepted for publication. As a service to our customers we are providing this early version of the manuscript. The manuscript will undergo copyediting, typesetting, and review of the resulting proof before it is published in its final citable form. Please note that during the production process errors may be discovered which could affect the content, and all legal disclaimers that apply to the journal pertain.
References
- 1.Strahl BD, Allis DD. Nature. 2000;403:41. doi: 10.1038/47412. [DOI] [PubMed] [Google Scholar]
- 2.Biterge B, Schneider JJ. Cell Tissue Res. 2014;356:457. doi: 10.1007/s00441-014-1862-4. [DOI] [PubMed] [Google Scholar]
- 3.Thorslund T, Ripplinger A, Hoffmann S, Wild T, Uckelmann M, Villumsen B, Narita T, Sixma TK, Choudhary C, Bekker-Jensen S, Mailand N. Nature. 2015;527:389. doi: 10.1038/nature15401. [DOI] [PubMed] [Google Scholar]
- 4.TaA Jenuwein CD. Science. 2001;293:1074. doi: 10.1126/science.1063127. [DOI] [PubMed] [Google Scholar]
- 5.Kurat C, Recht J, Radovani E, Durbic T, Andrews B, Fillingham J. Cellular and Molecular Life Sciences. 2014;71:599. doi: 10.1007/s00018-013-1443-9. [DOI] [PMC free article] [PubMed] [Google Scholar]
- 6.Telu KH, Abbaoui B, homas-Ahner‖ JM, Zynger DL, Clinton‖ SK, Freitas MA, Mortazavi A. J Proteome Res. 2013;12:3317. doi: 10.1021/pr400143x. [DOI] [PMC free article] [PubMed] [Google Scholar]
- 7.Harshman SW, Hoover ME, Huang C, Branson OE, Chaney SB, Cheney CM, Rosol TJ, Shapiro CL, Wysocki VH, Huebner K, Freitas MA. J Proteome Res. 2014;13:2453. doi: 10.1021/pr401248f. [DOI] [PMC free article] [PubMed] [Google Scholar]
- 8.Garcia BA, Mollah S, Ueberheide BM, Busby SA, Muratore TL, Shabanowitz J, Hunt DF. Nat Protoc. 2007;2:933. doi: 10.1038/nprot.2007.106. [DOI] [PMC free article] [PubMed] [Google Scholar]
- 9.Moradian A, Kalli A, Sweredoski MJ, Hess S. Proteomics. 2014;14:489. doi: 10.1002/pmic.201300256. [DOI] [PubMed] [Google Scholar]
- 10.Britton LM, Gonzales-Cope M, Zee ZM, Garcia BA. Expert Rev Proteomics. 2011;8:631. doi: 10.1586/epr.11.47. [DOI] [PMC free article] [PubMed] [Google Scholar]
- 11.Pesavento JJ, Bullock CR, LeDuc RD, Mizzen CA, Kelleher NL. J Biol Chem. 2008;283:14927. doi: 10.1074/jbc.M709796200. [DOI] [PMC free article] [PubMed] [Google Scholar]
- 12.Zheng YP, Fornelli L, Compton PD, Sharma S, Canterbury J, Mullen C, Zabrouskov V, Fellers RT, Thomas PM, Licht JD, Senko MW, Kelleher NL. Molecular & Cellular Proteomics. 2016;15:776. doi: 10.1074/mcp.M115.053819. [DOI] [PMC free article] [PubMed] [Google Scholar]
- 13.Su X, Jacob NK, Amunugama R, Lucas DM, Knapp AR, Ren C, Davis ME, Marcucci G, Parthun MR, Byrd JC, Fishel R, Freitas MA. Journal of Chromatography B. 2007;850:440. doi: 10.1016/j.jchromb.2006.12.037. [DOI] [PMC free article] [PubMed] [Google Scholar]
- 14.Contrepois K, Ezan E, Mann C, Fenaille F. J Proteome Res. 2010;9:5501. doi: 10.1021/pr100497a. [DOI] [PubMed] [Google Scholar]
- 15.MacNair JE, Patel KD, Jorgenson JW. Analytical Chemistry. 1999;71:700. doi: 10.1021/ac9807013. [DOI] [PubMed] [Google Scholar]
- 16.Gritti F, Horvath K, Guiochon G. Journal of Chromatography A. 2012;1263:84. doi: 10.1016/j.chroma.2012.09.030. [DOI] [PubMed] [Google Scholar]
- 17.Wu NJ, Liu YS, Lee ML. Journal of Chromatography A. 2006;1131:142. doi: 10.1016/j.chroma.2006.07.042. [DOI] [PubMed] [Google Scholar]
- 18.Snyder LR, Stadalius MA, Quarry MA. Analytical Chemistry. 1983;55:1412. [Google Scholar]
- 19.JaC Eshraghi SK. Anal Chem. 1993;65:3528. doi: 10.1021/ac00071a035. [DOI] [PubMed] [Google Scholar]
- 20.You J, Wang L, Saji M, Olesik SV, Ringel MD, Lucas DM, Byrd JC, Freitas MA. Proteomics. 2011;11:3326. doi: 10.1002/pmic.201000445. [DOI] [PMC free article] [PubMed] [Google Scholar]
- 21.Groskreutz SR, Horner AR, Varner EL, Yin BC, Michael AC, Weber SG. Trac-Trends in Analytical Chemistry. 2015;68:133. [Google Scholar]


