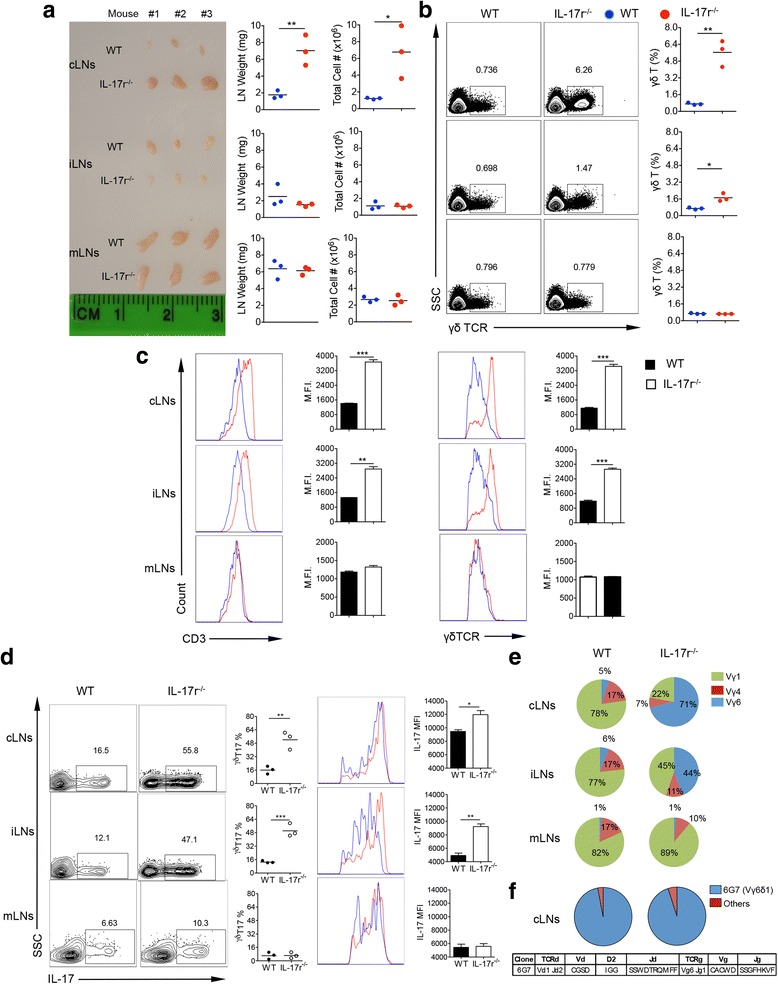
Fig. 2.

cLNs in the neck are specifically enlarged in IL-17r−/− mice with expansion of a 6G7 clone of Vγ6 γδT17 cells. a Photograph showing the difference in size (scale shown in cm) of LNs between WT and IL-17r−/− mice from three different locations with corresponding weight and total cell count from each LN. Plots representative of three different experiments. *p < 0.05, **p < 0.01. b Flow cytometry staining for γδ TCR from corresponding LN locations in (a) to calculate difference in total γδ T cell % between WT and IL-17r−/− mice. Representative of four to five experiments. *p < 0.05, **p < 0.01. c Gated on total γδ T cells in the different LN locations and analyzed for CD3 and γδTCR surface expression intensity using MFI. Representative of three experiments. **p < 0.01, ***p < 0.001. d Gated on total γδ T cells after 5 h PMA/Ionomycin stimulation to analyze γδT17 frequencies. **p < 0.01, ***p < 0.001. e Frequencies of the three subsets of γδT cells Vγ6 (blue), Vγ1 (green), and Vγ4 (red). Pie charts representative of three different experiments. f Deep sequencing of individual clonal γδTCR expression on the Vγ6 γδ T cells sorted from cLNs of WT and IL-17r−/− mice. Pie charts are representative of 192 clones from WT and 192 clones from IL-17r−/−
