Abstract
Macrophages become polarized by cues in their environment and this polarization causes a functional change in their behavior. Two main subsets of polarized macrophages have been described. M1, or “classically activated” macrophages, are pro-inflammatory and M2, or “alternatively activated” macrophages, are anti-inflammatory. In this study, we investigated the motility and force generation of primary human macrophages polarized down the M1 and M2 pathways using chemokinesis assays and traction force microscopy on polyacrylamide gels. We found that M1 macrophages are significantly less motile and M2 macrophages are significantly more motile than unactivated M0 macrophages. We also showed that M1 macrophages generate significantly less force than M0 or M2 macrophages. We further found that M0 and M2, but not M1, macrophage force generation is dependent on ROCK signaling, as identified using the chemical inhibitor Y27632. Finally, using the chemical inhibitor blebbistatin, we found that myosin contraction is required for force generation by M0, M1, and M2 macrophages. This study represents the first investigation of the changes in the mechanical motility mechanisms used by macrophages after polarization.
Keywords: mechanotransduction, chemokinesis, traction force microscopy
3. INTRODUCTION
Macrophages are a highly heterogeneous and plastic group of cells that reside in most tissues throughout the body and perform diverse functions. Originating from circulating monocytes, macrophages differentiate upon entering tissues and can become further activated by cues in their environment 3. It has been shown that a variety of soluble cues can drive this activation. In general, macrophages are categorized into two main ‘activation’ states. Macrophages can be ‘classically activated’ along a pro-inflammatory or M1 pathway by inflammatory cytokines like interferon-gamma (IFNγ) and by microbial stimuli such as lipopolysaccharide (LPS) 1. M1 macrophages are found in active inflammation sites and secrete high amounts of cytokines such as tumor necrosis factor-α (TNFα), interleukin-12 (IL-12), and interleukin-23 (IL-23) that lead to an adaptive immune response 18. In contrast, macrophages can also be ‘alternatively activated’ along an anti-inflammatory or M2 pathway by interleukin-4 (IL-4) or interleukin-10 (IL-10) 18. M2 macrophages are active during the resolution of inflammation and secrete anti-inflammatory cytokines such as CCL17 and CCL22 2.
Differentially polarized macrophages have been associated with the progression of certain disease states. In type II diabetes, chronic inflammation in adipose tissue is caused by the enhanced recruitment of pro-inflammatory (M1) macrophages 20. In contrast, anti-inflammatory M2 macrophages facilitate tumor progression and invasion by suppressing the immune response as well as promoting angiogenesis of the tumorigenic tissue 16, 17. Macrophages have also been seen migrating with tumor cells away from solid tumors and into the vasculature 6.
In response to injury, macrophages first exhibit a predominantly M1 phenotype and then switch to a predominantly M2 phenotype. Changes in the microenvironment can alter macrophage phenotype to either facilitate or hinder the M1-to-M2 transition and the resolution of healing. However, how polarization affects the macrophages’ ability to migrate within different environments is poorly understood. It has been previously shown that the porosity and structure of a microenvironment can alter the morphology and migration potential of macrophages 7. Furthermore, it was shown that the differences in migration between M0, M1, and M2 macrophages depended on the structure of the matrix. It has also been previously shown that protein patterning can cause macrophages to adopt an M1 or M2 phenotype by driving specific cell morphologies 18.
McWhorter et al. found that polarization of murine bone marrow derived macrophages caused rounding of M1 polarized cells and elongation of M2 polarized cells. Furthermore, forced changes in cell geometry could induce a polarized phenotype. They used micropatterned surfaces to control cell shape and found that when macrophages were forced to elongate they adopted an M2 phenotype in the absence of chemical cues and that this elongation protected macrophages from adopting an M1 phenotype even in the presence of pro-inflammatory cues 18. The results of this study are in direct contrast to the findings of Vogel et al. who showed that polarization of primary human macrophages caused an elongation of M1 macrophages and a rounding of M2 macrophages 27. Clearly there is a need to evaluate the changes in the cytoskeleton following polarization. Despite their contrasting findings, these studies indicate that there is a physical and mechanical basis for macrophage polarization. We hypothesized that there will be a change in the mechanical properties of macrophages when they are polarized down M1 and M2 pathways.
Polarization of macrophages has been shown to change the motility of the cells; M1 macrophages have lower overall motility and M2 macrophages have increased random and chemotactic motility 7, 27. Other laboratories have studied the migration of M1 and M2 polarized macrophages using transwell chambers and three-dimensional gels 7, but M1 and M2 macrophage migration has not yet been described on two-dimensional gels of controlled stiffness.
Macrophage polarization has previously been shown to lead to a change in cell morphology; however, the mechanical changes accompanying macrophage polarization have not been described. Unactivated primary human macrophages have been shown to generate strong forces on compliant polyacrylamide gels 12. We therefore hypothesized that macrophage polarization would lead to a change in the force generation of the cells. In this study, we used traction force microscopy and a chemokinesis assay to evaluate the motility and force generation of polarized macrophages on compliant polyacrylamide gels, allowing for the study of polarized macrophage migration on compliant surfaces without the confounding factor of matrix degradation. We have shown that macrophage polarization has a significant effect on the capacity of primary human macrophages to migrate and generate traction forces.
4. MATERIALS AND METHODS
Reagents
Bovine fibronectin, recombinant human M-CSF (macrophage colony stimulating factor), and E. Coli LPS (lipopolysaccharide) were obtained from Sigma (St. Louis, MO). Recombinant human IFNγ (interferon-γ) and recombinant human IL-4 were obtained from Peprotech (Rocky Hill, NJ). We used the ROCK inhibitor Y27632 at 10μM from Millipore (Billerica, MA) and the myosin inhibitor Blebbistatin at 20 μM from Sigma (St. Louis, MO).
Isolation of Monocytes
Whole blood was obtained from healthy human donors by venipuncture and collected in BD Vacutainer tubes containing sodium heparin as an anticoagulant (BD Biosciences, San Jose, CA). Samples were collected with University of Pennsylvania Institutional Review Board approval from four consenting adult volunteers. Blood samples were layered in a 1:1 ratio of whole blood to the density gradient 1-Step Polymorphprep (Axis-Shield, Oslo, Norway). Vials were centrifuged at 1500 rpm for 40 minutes and the mononuclear band was collected into a fresh vial.
Differentiation and Cell Culture of Macrophages
Cells were allowed to adhere to sterile non-tissue culture treated dishes in AimV media overnight. Non-adhered cells were removed and washed with 1x PBS. Adherent monocytes were then differentiated for seven days in AimV supplemented with 2ng/mL M-CSF (Sigma, St. Louis, MO). Cells were used for experimentation 7–12 days following the start of differentiation.
Polarization of Macrophages
Macrophages were plated at 100 cells/mm2 on polyacrylamide gels in AimV media supplemented with 2ng/mL M-CSF and 1% penicillin-streptomycin and incubated for 1 hour. Non-adherent cells were washed away and attached cells were polarized for 24 hours in AimV supplemented with 2ng/mL M-CSF, penicillin-streptomycin, and specific polarization factors. M1 macrophages were polarized with 20ng/mL IFNγ and 100ng/mL LPS. M2 macrophages were polarized with 20ng/mL IL-4. M0 macrophages were plated without polarization factors and incubated on the gels for the same amount of time as the polarized cells.
Surface Preparation
Coverslips (No 1, 45 × 50 mm, Fisher Scientific, Pittsburgh, PA) were chemically activated in preparation for covalent attachment of polyacrylamide gels using a method adapted from the protocol by Pelham and Wang 21 as described in previous papers13, 23.
Synthesis of the Bifunctional Linker
N-6-((acryloyl)amino)hexanoic acid (N-6) was synthesized using the method described by Pless et al 22. The N-6 copolymerizes in the acrylamide to form a reactive polyacrylamide gel. The N-6 contains an n-succinimidyl ester that is displaced by a primary amine to link the amine-containing ligand, such as fibronectin, to the polyacrylamide gel.
Gel Synthesis
Acrylamide solutions were prepared containing acrylamide (40% w/v solution), n,n′-methylene-bis-acrylamide (2% w/v solution), n′-tetramethylethylene di-amine, and ammonium persulfate from Bio-Rad Laboratories (Hercules, CA). Additionally, the gels contained 0.25M HEPES, buffered to pH 8, 5.6mg of N6 dissolved in ethanol, distilled water, and carboxylate-modified fluorescent latex beads (0.5μm Fluorospheres, Molecular Probes, Eugene, OR). Hydrogels were prepared as previously described13. 10,400Pa gels were used for all experiments because previous studies have shown this gel stiffness allows for both robust macrophage migration and consistent traction force measurements13.
Extraction of RNA and cDNA synthesis
RNA was extracted from the cells adherent to the polyacrylamide gels by incubating the samples in 1 mL Trizol Reagant (Life Technologies) for 1 minute. The solution was collected and again incubated at room temperature. After 5 minutes, 200μL of chloroform was added and the mixture was rigorously shaken for 15 seconds. The solution was then incubated for 3 minutes at room temperature. The mixture was centrifuged at 12,000 × g for 15 minutes and RNA extraction from the aqueous phase was performed using the RNeasy Mini Kit (Qiagen) according to the manufacturer’s instructions. The RNA was quantified using a Nanodrop spectrophotometer (ND1000).
DNAse treatment of the RNA was performed using the DNAse I Removal kit (Invitrogen) according to the manufacturers instructions. The High Capacity cDNA Reverse Transciptase kit (Life Technologies) was used for cDNA synthesis according to the manufacturer’s instructions.
Analysis of gene expression using RT-PCR
Quantitative RT-PCR for markers of the M1 and M2 phenotypes was performed using the SYBR Green PCR Master Mix (Life Technologies) and the following primers (all from Life Technologies) as previously described 19: CCR7 (forward: TGAGGTCACGGACGATTACAT, reverse: GTAGGCCCACGAAACAAATGAT), IL1B (forward: ATGATGGCTTATTACAGTGGCAA, reverse: GTCGGAGATTCGTAGCTGGA), MMP9 (forward: GTACTCGACCTGTACCAGCG, reverse: TCAGGGCGAGGACCATAGAG), CCL18 (forward: GCTCTCTGCCCGTCTATACC, reverse: GGGCTGGTTTCAGAATAGTCAACT), CCL22 (forward: GCGTGGTGTTGCTAACCTTCA, reverse: AAGGCCACGGTCATCAGAGT), and TIMP3 (forward: ACCGAGGCTTCACCAAGATG, reverse: CATCATAGACGCGACCTGTCA). Gene expression was quantified using the comparative Ct method and gene expression was normalized to the housekeeping gene GAPDH (forward: AAGGTGAAGGTCGGAGTCAAC, reverse: GGGGTCATTGATGGCAACAATA).
Chemokinesis Assay
Polyacrylamide gels fabricated on 25mm coverslips were attached to 6-well plates with vacuum grease. Cells were plated in each well at 140 cells/mm2 and incubated for one hour. After incubation, the cells were washed with AimV to remove any unattached cells. Cells were polarized for 24 hours in AimV supplemented with polarization factors (Sigma, St. Louis, MO and Peprotech, Rocky Hill, NJ) and 1% penicillin-streptomycin. Cells were imaged at 10x magnification on a Nikon Eclipse TE300 (Nikon, Melville, NY) using custom-built LabView (Texas Instruments, Austin, TX) software that allows for time-lapse imaging of several positions. Fifteen fields of view per condition were imaged and images were captured every 10 minutes for 24 hours. Motility parameters were calculated as previously reported 14. Briefly, cell trajectories were captured using the ImageJ Manual Tracking plugin. Chemokinesis parameters were calculated using a custom written MATLAB (Mathworks, Natick, MA) script. The MATLAB script fits the root-mean-squared speed (S) and persistence time (P) of the tracked cells to the Dunn Equation:10 〈d2〉 = nS2[Pt − P2(1 − e−t/P)] using a nonlinear curve fitting algorithm where 〈d2〉 is the mean squared displacement, n is the dimensionality of the system, and persistence time is defined as the time between significant changes in the direction of cell motion. The random motility coefficient is a relative diffusion coefficient for the cells in a uniform chemokine field. The random motility coefficient, μ, was calculated using the fit parameters in the following equation: .
Traction Force Microscopy of Migrating Macrophages
Traction force microscopy has been described previously 9. Briefly, traction forces were determined based on deformations in the polyacrylamide substrate relative to the relaxed substrate as detected by movements of 0.5-μm beads embedded in the gel.
Primary human macrophages were plated on fibronectin-coated polyacrylamide gels at 100 cells/mm2 and incubated for 1 hour at 37°C. Unattached cells were washed away and fresh AimV with 2ng/mL human M-CSF was added to the gel chamber. The cells were allowed to polarize for 24 hours. Phase contrast images of the cell were taken every 10 minutes during cell migration. Directly after a phase image was taken, a corresponding fluorescent image of the beads embedded beneath the cell was taken. Images were taken over a 4-hour period following the 24 hour polarization period. At the end of migration, the cells were removed using 0.5% SDS and an image of the beads in their unstressed state was taken. Using custom-written LIBTRC software8, the bead displacements within the gel were calculated, the cell and nucleus were drawn, and a mesh that fits within the outline of the cell was created. Using the bead displacements and the material properties of the gel, the most likely surface traction vectors were calculated using the technique described by Dembo and Wang 9.
The overall force, |F|, exerted by the cell on its substrate, is an integral of the traction field magnitude over the area, , where T(x, y) = [Tx(x, y), Ty(x, y)] is the continuous field of traction vectors defined at any spatial position (x,y) within the cell.
Chemical Inhibition of Macrophages
Macrophages were seeded on 10,400Pa gels functionalized with 5μg/mL fibronectin and allowed to adhere for 1 hour. After incubation, the cells were washed with AimV to remove any unattached cells. Cells were polarized for 24 hours in AimV supplemented with polarization factors (Sigma, St. Louis, MO and Peprotech, Rocky Hill, NJ) and 1% penicillin-streptomycin. After 24 hours of polarization, the ROCK inhibitor Y27632 was added to the wells at 10 μM or the myosin inhibitor Blebbistatin was added at 20 μM, each for 1 hr. All traction force measurements were taken in the continued presence of the chemical inhibitor. The forces exerted by inhibited macrophages were compared to the previously measured forces of uninhibited macrophages on 10,400Pa gels.
Statistical analysis
All data are presented as mean +/− standard error. Significance determined using student’s t-test, p < 0.05 considered significant. n > 300 cells used for motility experiments and n > 20 cells used for traction force experiments.
5. RESULTS
Characterization of Macrophage Polarization
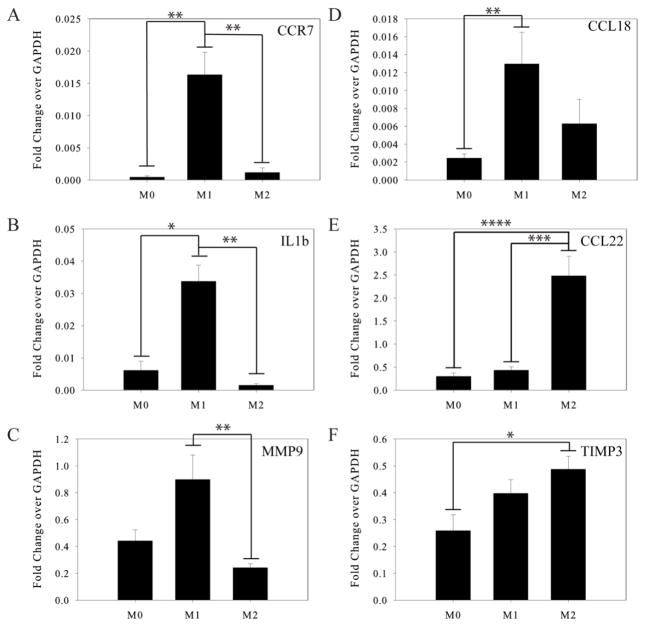
We first measured the gene expression profiles of macrophages to confirm that they polarized as expected on the compliant gel surfaces. The expression of known M1 markers CCR7, IL-1β, and MMP9 was significantly higher in macrophages treated with 20ng/mL IFNγ and 100ng/mL LPS compared to the macrophages treated with 2ng/mL MCSF alone (M0) or 20 ng/mL IL-4 (M2). The known M2 markers CCL22 and TIMP3 were expressed at significantly higher levels in macrophages treated with IL-4, compared to the M0 or M1 macrophages (Figure 1). Gene expression of the M2 marker CCL18 was not significantly different between M1 and M2 macrophages, which has been previously reported 26.
Figure 1.
Characterization of polarized macrophages using RT-PCR. Quantitative RT-PCR for markers of the M1 and M2 phenotypes shown as fold change over GAPDH expression. M1 markers: (A) CCR7, (B) IL1b, (C) MMP9. M2 markers: (D) CCL18, (E) MDC, (F) TIMP3.
Macrophage Polarization Alters Macrophage Motility on Polyacrylamide Gels
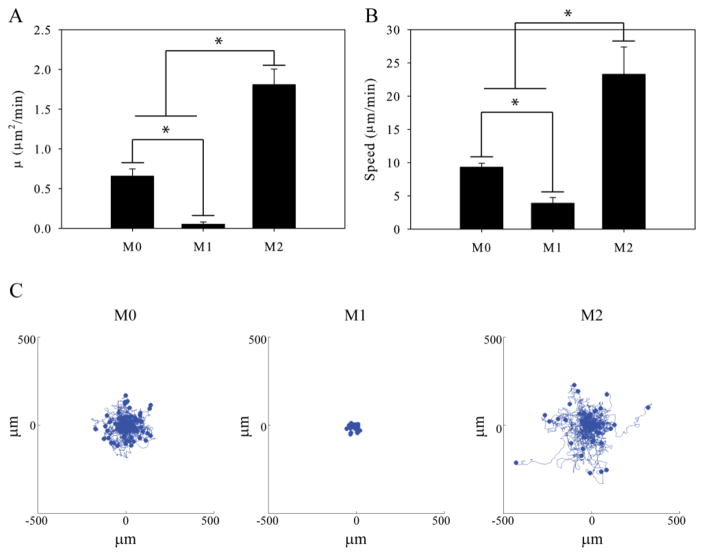
We measured the effect of polarization on macrophage motility on compliant polyacrylamide gels. Control M0, M1, and M2 macrophages were allowed to migrate randomly on polyacrylamide gels in the presence of a uniform concentration of the chemokine CSF-1. The control M0 macrophages were able to efficiently migrate on the polyacrylamide gels (Supplementary Video 1). Motility parameters such as speed and the random motility coefficient were calculated and used to compare the migration of M0, M1, and M2 macrophages. The random motility coefficient of M1 polarized macrophages was significantly reduced when compared to the M0 and M2 macrophages (Figure 2A). Furthermore, the M2 macrophages had a significantly higher random motility coefficient than control M0 macrophages. These differences in motility can be seen in time-lapse videos of M0, M1, and M2 macrophage migrating on the polyacrylamide gels (Supplementary Video 1). Plots showing the dispersion of M0, M1, and M2 macrophages migrating on compliant polyacrylamide gels were created by moving the start point of each cell track to the origin of the axis (Figure 2C). These plots qualitatively show the differences in the migration potential of M0, M1, and M2 polarized macrophages. A change in the speed of the polarized macrophages was also observed. M2 macrophages migrated at a significantly higher speed than M0 or M1 macrophages and M1 macrophages showed a significantly reduced speed relative to M0 macrophages (Figure 2B).
Figure 2.
Motility of polarized macrophages. (A) Random motility coefficient and (B) Speed of M0, M1, and M2 polarized macrophages migrating on 10,400Pa gels coated with 5 μg/mL fibronectin. (C) Dispersion of M0, M1, and M2 macrophages migrating on 10,400Pa polyacrylamide gels. ( n > 300 cells per condition). Error bars are standard error. * indicates p < 0.05.
M1 Macrophages Generate Significantly Less Force than M0 or M2 Macrophages
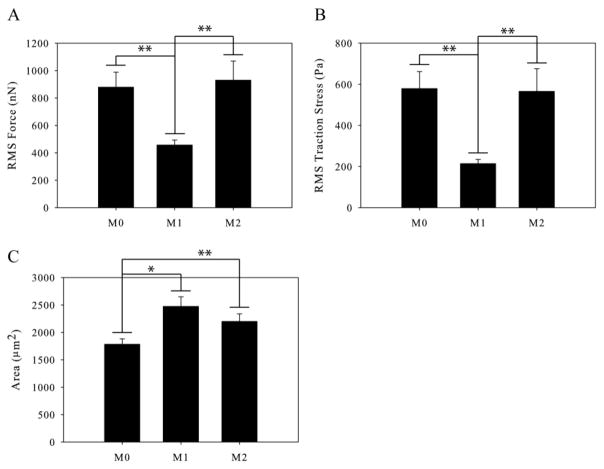
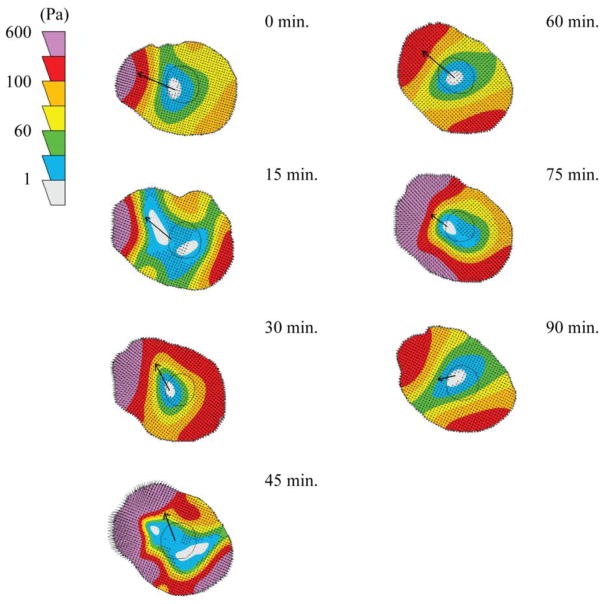
We used traction force microscopy to measure the forces generated by M1 and M2 polarized macrophages and compared them to the forces generated by control, unactivated M0 macrophages. M1 polarized macrophages were found to generate significantly less traction force than M0 macrophages or M2 polarized macrophages, but there was no significant difference between the forces generated by M0 and M2 macrophages (Figure 3A). This reduced force generation by M1 macrophages was accompanied by a significant reduction in traction stress (Figure 3B); the M1 and M2 polarized macrophages had a significantly increased average spread area of cells on the gels compared to unpolarized M0 macrophages (Figure 3C); however, no differences in cell morphology were observed qualitatively (Supplementary Video 1). Traction contour maps of migrating M2 macrophages show a frontal-towing mechanism of macrophage migration with the highest areas of force at the leading edge relative to cell migration (Figure 4). This is the same pattern of force generation we have previously published for unactivated M0 macrophages 12. Traction maps of M1 macrophages have no specific localization of forces as the M1 macrophages do not translocate.
Figure 3.
Traction force generation by polarized macrophages. (A) Traction force generated by M0, M1, and M2 macrophages on 10,400Pa polyacrylamide gels. (B) Traction stresses generated by M0, M1, and M2 macrophages. (C) Area of M0, M1, and M2 macrophages. (n > 50 per condition). Error bars are standard error. * indicates p < 0.05 and ** indicates p < 0.002.
Figure 4.
Traction contour maps of a migrating M2 macrophage. Contour plots show traction stresses and arrows indicate the direction of motion between the indicated timepoint and the next timepoint of a representative M2 macrophage on a 10,400Pa gel.
Force Generation by M0 and M2 but not M1 Macrophages Requires ROCK Activity
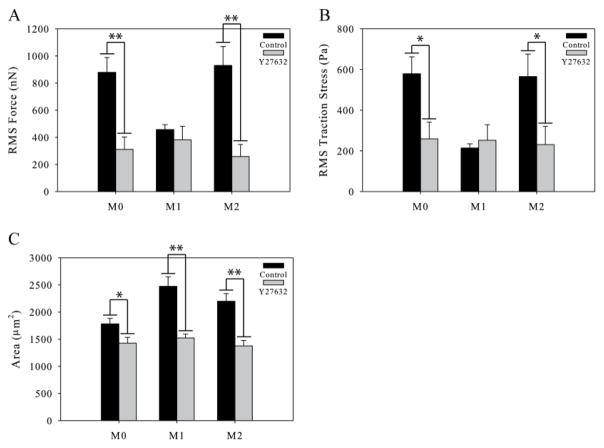
It has been shown that myosin contraction through ROCK signaling is necessary for force generation in many types of cells 15, 28. We therefore hypothesized that ROCK signaling upstream of myosin contraction would be necessary for traction force generation in polarized macrophages. We polarized macrophages as described before, and then exposed the polarized cells to the chemical inhibitor Y27632 to block ROCK activity for one hour. We then measured the traction forces of the inhibited cells in the continued presence of the inhibitor. We found that both M0 and M2 polarized macrophages produced significantly less force under ROCK inhibition than they did when uninhibited (Figure 5A). Interestingly, M1 macrophages had no reduction in force generation, indicating that the small forces generated by M1 macrophages are not dependent on ROCK signaling. The changes in traction force of the M0 and M2 polarized macrophages were due to a significant reduction in both the traction stresses (Figure 5B) and the area (Figure 5C). Interestingly the M1 macrophages also showed a decrease in area but no corresponding change in force generation. There were no significant differences between the forces generated by M0, M1, or M2 polarized macrophages under ROCK inhibition.
Figure 5.
Traction force generated by polarized macrophages under ROCK inhibition. (A) Traction forces of control M0, M1, and M2 macrophages and macrophages under ROCK inhibition. (B) Traction stresses of control and polarized macrophages under ROCK inhibition. (C) Area of control and ROCK inhibited M0, M1, and M2 polarized macrophages. (n > 20 per condition). Error bars are standard error. * indicates p < 0.05 and ** indicates p < 0.002.
Macrophage Force Generation Requires Myosin Contraction
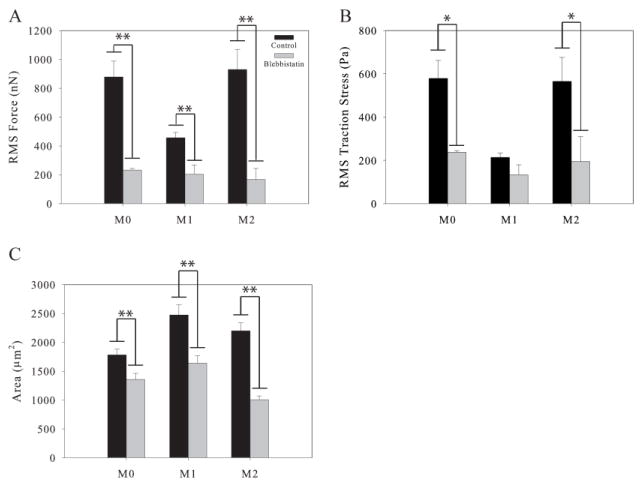
Myosin contraction has previously been shown to be necessary for force generation by unactivated macrophages 12. We therefore hypothesized that myosin contraction would be necessary for force generation by polarized macrophages. We polarized the macrophages as before, then we incubated the cells with the chemical inhibitor blebbistatin for one hour to block myosin contraction. We then measured the traction forces of the inhibited M0, M1, and M2 cells in the continued presence of blebbistatin. We found that M0, M1, and M2 macrophages all produced significantly less force without myosin contraction than they did when uninhibited (Figure 6A). Furthermore, there were no significant differences in force generation between the M0, M1, and M2 macrophages under blebbistatin inhibition. The decrease in force generation was accompanied by a significant reduction in traction stress generation by M0 and M2 macrophages and a significant reduction in area for all three macrophage subsets (Figure 6C). When considered in conjunction with the results from ROCK inhibition, these results indicate that myosin contraction may be responsible for much of the difference in force generation between the M0–M1 and M1–M2 macrophages because inhibition of this pathway by both Y27632 and blebbistatin eliminates any differences in force generation between the three polarization states. Specifically, the reduction in M1 force generation indicates that M1 force generation requires myosin contraction through a ROCK-independent pathway while M0 and M2 force generation requires ROCK signaling as well as myosin contraction.
Figure 6.
Traction force generated by polarized macrophages under Blebbistatin inhibition. (A) Traction forces of control M0, M1, and M2 macrophages and macrophages under Blebbistatin inhibition. (B) Traction stresses of control and polarized macrophages under Blebbistatin inhibition. (C) Area of control and Blebbistatin inhibited M0, M1, and M2 polarized macrophages. (n > 20 per condition). Error bars are standard error. * indicates p < 0.05 and ** indicates p < 0.002.
6. DISCUSSION
We have shown that polarization has a significant effect on the ability of macrophages to migrate randomly and generate forces on compliant polyacrylamide gels. We found that M1 polarization leads to a significant decrease in motility and force generation and M2 polarization leads to a significant increase in motility but no change in force compared to unactivated, M0, macrophages.
Previous studies have shown that macrophages can be activated by cues in their environment and that this activation alters the behavior of these cells in both healthy immune responses and in disease 6, 20, 27. Furthermore, it has been suggested that mechanical signals such as cell shape can also alter the activation status of macrophages 18. We have shown that on compliant polyacrylamide gels, M1 polarized macrophages are significantly less motile and M2 polarized macrophages are significantly more motile than unpolarized macrophages. This result agrees with a previous study that found reduced motility in M1 macrophages and increased motility in M2 macrophages in both 3D matrigel and 2D transwell assays 7. It has also been previously reported that the M2 macrophages migrate and crawl directionally toward several chemokines more efficiently than M1 macrophages using a TAXIScan assay 27. In this study we directly quantified the random motility of M0, M1, and M2 polarized macrophages. By using polyacrylamide gels we also removed the confounding factor of matrix degradation in the analysis of migration as M1 and M2 macrophages have been previously shown to secrete high levels of MMP9 26. The finding presented by this study and others that macrophages lose motility with M1 polarization and gain motility with M2 polarization seems to be in agreement with the physiological roles of polarized macrophages. M1 macrophages are pro-inflammatory macrophages present at the beginning stages of an active immune response 17; their primary role is to remain at the site of infection, clearing away pathogens and activating the adaptive immune response 3. We therefore propose that upon arriving at the site of inflammation and becoming polarized, M1 macrophages have no immediate need to migrate large distances leading to a decrease in motility. In contrast, M2 macrophages are present at the resolution of an immune response and secrete anti-inflammatory cytokines to dampen the adaptive immune response 17. We therefore propose that it is important for M2 macrophages to migrate away from the site of infection to resolve the inflammation leading to an increase in motility. In addition to aiding in the normal function of M2 macrophages in an immune response their increased migration might provide insight into their role in cancer metastasis. The presence of M2 macrophages at the site of a tumor is often associated with increased metastatic potential and a poor patient prognosis 11, 16, 17, 25. Furthermore, macrophages have been observed co-migrating with tumor cells away from solid tumors and toward the vasculature suggesting that macrophages may aid tumor cell entry into blood vessels 24. It is possible that this increased migration seen in M2 macrophages could assist in metastasis and may be a potential therapeutic target in the future 4, 5.
In addition to increased migration, it has also been shown that macrophage polarization can lead to changes in cell morphology. Macrophage polarization has been reported to alter the morphology of human macrophages. Two different studies reported an elongation of either M2 polarized murine macrophages 18 or elongation of M1 polarized primary human macrophages 27. The first study showed that cell shape is sufficient to polarize macrophages in the absence of chemical stimuli, and cell elongation can inhibit M1 polarization by chemical stimuli 18. This result indicated that macrophage polarization has an effect on the mechanical machinery of the cells. We found that M1 polarization led to a significant reduction in force generation and traction stresses by polarized macrophages, but no significant difference was found between M0 and M2 macrophages. These results together indicate that macrophage polarization directly alters the mechanical properties of the cells.
We have previously shown that myosin II contraction through ROCK is important for macrophage force generation, confirming the results of others that myosin II is directly involved in force generation 12, 15. To determine the effect of myosin II contraction we used two distinct inhibitors: Y27632, which blocks myosin contraction through the RhoA kinase ROCK but not through other pathways such as MLCK, and blebbistatin, which blocks all myosin II contraction. We found that loss of ROCK signaling upstream of myosin II contraction through the chemical inhibitor Y27632 led to a significant decrease in the force generated by M0 and M2 macrophages, in agreement with our previous results 12. Interestingly, the force generated by M1 macrophages was unchanged by ROCK inhibition. After the inhibition of ROCK, the forces generated by M0, M1, and M2 polarized macrophages were not significantly different from each other, suggesting that the increased force generated by M0 and M2 macrophages is dependent on myosin II contraction through ROCK signaling. This also suggests that a second force generating mechanism, not dependent on ROCK signaling, is present in all three polarized macrophage subsets and equally contributes to their force generation. Furthermore, the unchanged force generation by M1 macrophages indicates that any force produced by these cells occurs through a ROCK-independent pathway. We were therefore interested in determining the contribution of the total myosin II contraction in macrophage force generation. We found that inhibition of myosin contraction by blebbistatin lead to a significant reduction in force generation by M0, M1, and M2 macrophages compared to uninhibited cells and the force generation between all three subsets of macrophages under myosin II inhibition was not significantly different. This proves that myosin II contraction is necessary for force generation in all macrophages. Interestingly, the force generation by M1 macrophages was significantly reduced in the presence of blebbistatin even though no change in force was seen under Y27632 inhibition. Together these results indicate that force generation by M1 macrophages is dependent on myosin II contraction in a ROCK-independent manner. This ROCK-independent pathway is likely used by all three macrophage subsets as inhibition with Y27632 did not lead to a total loss of force generation. It is possible that another pathway upstream of myosin II, such as MLCK also contributes to force generation. Further studies with a MLCK inhibitor and double inhibition experiments are needed to confirm this hypothesis.
We have been able to show that polarization changes the ability of macrophages to migrate and generate forces. Specifically, we showed that M1 macrophages have reduced motility and M2 macrophages have increased motility compared to unpolarized macrophages. Furthermore, we found that M1 macrophages generate significantly less force than M0 and M2 macrophages but M2 macrophages have no significant change in force compared to M0 macrophages. Finally, we showed that ROCK signaling is important for force generation in M0 and M2 macrophages but not M1 macrophages. Myosin II mediated contractility is necessary for force generation by all three macrophage subsets indicating that a second ROCK-independent myosin II contraction pathway is responsible for M1 force generation. Overall, we have shown that polarization not only changes the gene expression profile of macrophages but can also change their mechanical outputs. The results are consistent with the physiological roles each type of macrophage plays in inflammation. In the future, the differential force generation and motility mechanisms between M1 and M2 macrophages might serve as therapeutic targets in a number of diseases specifically associated with either M1 or M2 macrophage migration.
Supplementary Material
Supplementary Video 1. M0-M1-M2 macrophages migrating on 10,400Pa polyacrylamide gels coated with 5μg/mL fibronectin. Left: M0, Center: M1, Right: M2.
Acknowledgments
This work was supported by NIH GM1094287 and HL18208.
ABBREVIATIONS
- CCR7
C-C chemokine receptor type 7
- CCL22
C-C chemokine ligand type 22
- IFNγ
interferon-gamma
- IL-12, -23, -4, -10, -1β
interleukin-12, 23, 4, 10, 1β
- LPS
Lipopolysaccharide
- M-CSF
macrophage colony stimulating factor
- MMP9
Matrix metallopeptidase 9
- N-6
N-6-((acryloyl)amino)hexanoic acid
- ROCK
RhoA Kinase
- TNFα
tumor necrosis factor alpha
Footnotes
Conflict of Interest
Laurel E. Hind, Emily B. Lurier, Micah Dembo, Kara L. Spiller, and Daniel A. Hammer declare that they have no conflicts of interest.
Ethical Standards
All human subjects research was carried out in accordance with institutional guidelines and was approved by a University of Pennsylvania Institutional Review Board under HL18208. The authors performed no animal studies in this work.
References
- 1.Ambarus CA, Krausz S, van Eijk M, Hamann J, Radstake TR, Reedquist KA, Tak PP, Baeten DL. Systematic validation of specific phenotypic markers for in vitro polarized human macrophages. J Immunol Methods. 2012;375:196–206. doi: 10.1016/j.jim.2011.10.013. [DOI] [PubMed] [Google Scholar]
- 2.Arnold L, Henry A, Poron F, Baba-Amer Y, van Rooijen N, Plonquet A, Gherardi RK, Chazaud B. Inflammatory monocytes recruited after skeletal muscle injury switch into antiinflammatory macrophages to support myogenesis. J Exp Med. 2007;204:1057–1069. doi: 10.1084/jem.20070075. [DOI] [PMC free article] [PubMed] [Google Scholar]
- 3.Biswas SK, Chittezhath M, Shalova IN, Lim JY. Macrophage polarization and plasticity in health and disease. Immunol Res. 2012;53:11–24. doi: 10.1007/s12026-012-8291-9. [DOI] [PubMed] [Google Scholar]
- 4.Biswas SK, Mantovani A. Macrophage plasticity and interaction with lymphocyte subsets: cancer as a paradigm. Nat Immunol. 2010;11:889–896. doi: 10.1038/ni.1937. [DOI] [PubMed] [Google Scholar]
- 5.Chioda M, Peranzoni E, Desantis G, Papalini F, Falisi E, Solito S, Mandruzzato S, Bronte V. Myeloid cell diversification and complexity: an old concept with new turns in oncology. Cancer Metastasis Rev. 2011;30:27–43. doi: 10.1007/s10555-011-9268-1. [DOI] [PubMed] [Google Scholar]
- 6.Condeelis J, Pollard JW. Macrophages: obligate partners for tumor cell migration, invasion, and metastasis. Cell. 2006;124:263–266. doi: 10.1016/j.cell.2006.01.007. [DOI] [PubMed] [Google Scholar]
- 7.Cougoule C, Van Goethem E, Le Cabec V, Lafouresse F, Dupre L, Mehraj V, Mege JL, Lastrucci C, Maridonneau-Parini I. Blood leukocytes and macrophages of various phenotypes have distinct abilities to form podosomes and to migrate in 3D environments. Eur J Cell Biol. 2012;91:938–949. doi: 10.1016/j.ejcb.2012.07.002. [DOI] [PubMed] [Google Scholar]
- 8.Dembo M. The LIBTRC User’s Guide for Version 2.4. Boston: 2010. [Google Scholar]
- 9.Dembo M, Wang YL. Stresses at the cell-to-substrate interface during locomotion of fibroblasts. Biophys J. 1999;76:2307–2316. doi: 10.1016/S0006-3495(99)77386-8. [DOI] [PMC free article] [PubMed] [Google Scholar]
- 10.Dunn GA. Characterising a kinesis response: time averaged measures of cell speed and directional persistence. Agents Actions Suppl. 1983;12:14–33. doi: 10.1007/978-3-0348-9352-7_1. [DOI] [PubMed] [Google Scholar]
- 11.Hao NB, Lu MH, Fan YH, Cao YL, Zhang ZR, Yang SM. Macrophages in tumor microenvironments and the progression of tumors. Clin Dev Immunol. 2012;2012:948098. doi: 10.1155/2012/948098. [DOI] [PMC free article] [PubMed] [Google Scholar]
- 12.Hind LE, Dembo M, Hammer DA. Macrophage motility is driven by frontal-towing with a force magnitude dependent on substrate stiffness. Integr Biol (Camb) 2015;7:447–453. doi: 10.1039/c4ib00260a. [DOI] [PMC free article] [PubMed] [Google Scholar]
- 13.Hind LE, Dembo M, Hammer DA. Macrophage motility is driven by frontal-towing with a force magnitude dependent on substrate stiffness. Integrative Biology. 2015 doi: 10.1039/c4ib00260a. [DOI] [PMC free article] [PubMed] [Google Scholar]
- 14.Hind LE, Mackay JL, Cox D, Hammer DA. Two-dimensional motility of a macrophage cell line on microcontact-printed fibronectin. Cytoskeleton (Hoboken) 2014;71:542–554. doi: 10.1002/cm.21191. [DOI] [PMC free article] [PubMed] [Google Scholar]
- 15.Jannat RA, Dembo M, Hammer DA. Traction forces of neutrophils migrating on compliant substrates. Biophys J. 2011;101:575–584. doi: 10.1016/j.bpj.2011.05.040. [DOI] [PMC free article] [PubMed] [Google Scholar]
- 16.Mantovani A, Sica A. Macrophages, innate immunity and cancer: balance, tolerance, and diversity. Curr Opin Immunol. 2010;22:231–237. doi: 10.1016/j.coi.2010.01.009. [DOI] [PubMed] [Google Scholar]
- 17.Mantovani A, Sozzani S, Locati M, Allavena P, Sica A. Macrophage polarization: tumor-associated macrophages as a paradigm for polarized M2 mononuclear phagocytes. Trends Immunol. 2002;23:549–555. doi: 10.1016/s1471-4906(02)02302-5. [DOI] [PubMed] [Google Scholar]
- 18.McWhorter FY, Wang T, Nguyen P, Chung T, Liu WF. Modulation of macrophage phenotype by cell shape. Proc Natl Acad Sci U S A. 2013;110:17253–17258. doi: 10.1073/pnas.1308887110. [DOI] [PMC free article] [PubMed] [Google Scholar]
- 19.Nassiri S, Zakeri I, Weingarten MS, Spiller KL. Relative Expression of Proinflammatory and Antiinflammatory Genes Reveals Differences between Healing and Nonhealing Human Chronic Diabetic Foot Ulcers. J Invest Dermatol. 2015 doi: 10.1038/jid.2015.30. [DOI] [PubMed] [Google Scholar]
- 20.Oh DY, Morinaga H, Talukdar S, Bae EJ, Olefsky JM. Increased macrophage migration into adipose tissue in obese mice. Diabetes. 2012;61:346–354. doi: 10.2337/db11-0860. [DOI] [PMC free article] [PubMed] [Google Scholar]
- 21.Pelham RJ, Jr, Wang Y. Cell locomotion and focal adhesions are regulated by substrate flexibility. Proc Natl Acad Sci U S A. 1997;94:13661–13665. doi: 10.1073/pnas.94.25.13661. [DOI] [PMC free article] [PubMed] [Google Scholar]
- 22.Pless DD, Lee YC, Roseman S, Schnaar RL. Specific cell adhesion to immobilized glycoproteins demonstrated using new reagents for protein and glycoprotein immobilization. J Biol Chem. 1983;258:2340–2349. [PubMed] [Google Scholar]
- 23.Reinhart-King CA, Dembo M, Hammer DA. The dynamics and mechanics of endothelial cell spreading. Biophys J. 2005;89:676–689. doi: 10.1529/biophysj.104.054320. [DOI] [PMC free article] [PubMed] [Google Scholar]
- 24.Sharma VP, Beaty BT, Patsialou A, Liu H, Clarke M, Cox D, Condeelis JS, Eddy RJ. Reconstitution of in vivo macrophage-tumor cell pairing and streaming motility on one-dimensional micro-patterned substrates. Intravital. 2012;1:77–85. doi: 10.4161/intv.22054. [DOI] [PMC free article] [PubMed] [Google Scholar]
- 25.Solinas G, Schiarea S, Liguori M, Fabbri M, Pesce S, Zammataro L, Pasqualini F, Nebuloni M, Chiabrando C, Mantovani A, Allavena P. Tumor-conditioned macrophages secrete migration-stimulating factor: a new marker for M2-polarization, influencing tumor cell motility. J Immunol. 2010;185:642–652. doi: 10.4049/jimmunol.1000413. [DOI] [PubMed] [Google Scholar]
- 26.Spiller KL, Anfang RR, Spiller KJ, Ng J, Nakazawa KR, Daulton JW, Vunjak-Novakovic G. The role of macrophage phenotype in vascularization of tissue engineering scaffolds. Biomaterials. 2014;35:4477–4488. doi: 10.1016/j.biomaterials.2014.02.012. [DOI] [PMC free article] [PubMed] [Google Scholar]
- 27.Vogel DY, Heijnen PD, Breur M, de Vries HE, Tool AT, Amor S, Dijkstra CD. Macrophages migrate in an activation-dependent manner to chemokines involved in neuroinflammation. J Neuroinflammation. 2014;11:23. doi: 10.1186/1742-2094-11-23. [DOI] [PMC free article] [PubMed] [Google Scholar]
- 28.Worthylake RA, Lemoine S, Watson JM, Burridge K. RhoA is required for monocyte tail retraction during transendothelial migration. J Cell Biol. 2001;154:147–160. doi: 10.1083/jcb.200103048. [DOI] [PMC free article] [PubMed] [Google Scholar]
Associated Data
This section collects any data citations, data availability statements, or supplementary materials included in this article.
Supplementary Materials
Supplementary Video 1. M0-M1-M2 macrophages migrating on 10,400Pa polyacrylamide gels coated with 5μg/mL fibronectin. Left: M0, Center: M1, Right: M2.


