Abstract
Background
MiR-101-3p can promote apoptosis and inhibit proliferation, invasion, and metastasis in breast cancer (BC) cells. However, its mechanisms in BC are not fully understood. Therefore, a comprehensive analysis of the target genes, pathways, and networks of miR-101-3p in BC is necessary.
Material/Methods
The miR-101 profiles for 781 patients with BC from The Cancer Genome Atlas (TCGA) were analyzed. Gene expression profiling of GSE31397 with miR-101-3p transfected MCF-7 cells and scramble control cells was downloaded from Gene Expression Omnibus (GEO), and the differentially expressed genes (DEGs) were identified. The potential genes targeted by miR-101-3p were also predicted. Gene Ontology (GO) and pathway and network analyses were constructed for the DEGs and predicted genes.
Results
In the TCGA data, a low level of miR-101-2 expression might represent a diagnostic (AUC: 0.63) marker, and the miR-101-1 was a prognostic (HR=1.79) marker. MiR-101-1 was linked to the estrogen receptor (ER), progesterone receptor (PR), and human epidermal growth factor receptor 2 (HER2), and miR-101-2 was associated with the tumor (T), lymph node (N), and metastasis (M) stages of BC. Moreover, 427 genes were selected from the 921 DEGs in GEO and the 7924 potential target genes from the prediction databases. These genes were related to transcription, metabolism, biosynthesis, and proliferation. The results were also significantly enriched in the VEGF, mTOR, focal adhesion, Wnt, and chemokine signaling pathways.
Conclusions
MiR-101-1 and miR-101-2 may be prospective biomarkers for the prognosis and diagnosis of BC, respectively, and are associated with diverse clinical parameters. The target genes of miR-101-3p regulate the development and progression of BC. These results provide insight into the pathogenic mechanism and potential therapies for BC.
MeSH Keywords: Breast Neoplasms, Gene Expression Profiling, Gene Targeting, Information Systems, MicroRNAs
Background
Breast cancer (BC), the most frequent carcinoma diagnosed and cause of death among women, affects 1,676,660 women worldwide and causes 521,900 mortalities every year [1]. The latest statistics have revealed that the morbidity and mortality rates associated with BC accounts for 29% and 14% of cancers, respectively, in the United States [2]. Similarly, the incidence of BC in China is also increasing annually [3]. Targeted drugs have been approved to treat HER2-positive BC, but resistance remains an inevitable outcome [4]. BC is a molecularly heterogeneous disease [5], and well-defined and effective molecular targets are still lacking. Therefore, the need to identify novel therapeutic targets for BC is urgent.
MicroRNAs (miRNAs) are highly conserved, small, noncoding, single-stranded RNAs with 19–24 nucleotides [6]. miRNAs transcriptionally or post-transcriptionally regulate gene expression through binding to targeted mRNAs and influence the degradation and translation of mRNA [6]. miRNAs regulate gene expression and the levels of proteins that act as oncogenes or cancer suppressors. Moreover, miRNAs are involved in various biological processes [7], and accumulating evidence suggests that aberrant levels of miRNAs are linked to proliferation, angiogenesis, and metastasis in various human malignancies [8]. With the development and application of molecular biology technology, a vital role for miRNAs in the diagnosis, prognosis, and therapy prediction of BC has been revealed [9–11]. The mature miRNA microRNA-101-3p (miR-101-3p, previously named miR-101) can be generated from miR-101-1 and miR-101-2 (the precursor miRNA, pre-miRNA). MiR-101-1 and miR-101-2 are located on different chromosomes and have different sequences, with diverse functions in the process of transcription [12]. Several studies have revealed that miR-101-3p is down-regulated in BC [13,14]. miR-101-3p inhibits proliferation, invasion, and metastasis via targeting Stathmin1 (STMN1) and CXCR7 [13,15] and promotes apoptosis by targeting JAK2 in BC cells [14]. Nevertheless, the precise mechanism of miR-101-3p in inhibiting neoplasia is still not entirely clear. Therefore, comprehensive analysis of the target gene networks and clinical value may help further clarify the function of miR-101-3p.
In recent years, the development of microarray technology has served as an effective measure to identify differentially expressed genes (DEGs) [16]. DEGs can be found through different experimental treatments, and their biological functions can be speculated via known information. Microarray technology has provided new insight into the alteration of gene expression during tumorigenesis [17]. Biomarkers associated with BC have been identified based on gene expression profiles. Several expression chips have confirmed the aberrant expression of miRNAs in BC and miRNAs influencing tumor behavior and progression [18,19]. A massive amount of complex biological information data has been generated and has greatly deepened our understanding of BC. Comprehensive analysis of gene expression patterns may aid in the prevention, treatment, and determination of prognosis in BC.
In this study, datasets of miR-101 in patients with BC, including 781 tumors and 87 adjacent non-tumor breast tissues from The Cancer Genome Atlas (TCGA), were explored. Furthermore, we analyzed the gene expression profile to identify DEGs between the miR-101-3p transfected group and the negative control group of BC cells. Bioinformatics analysis was carried out to predict targets of miR-101-3p. The target genes acquired from Gene Expression Omnibus (GEO) and prediction software were combined, and their potential roles were further explored with pathway, Gene Ontology (GO), and network analyses. The present study explored the comprehensive roles and prospective molecular mechanisms of miR-101-3p and might facilitate the discovery of potential novel biomarkers for future investigation of the mechanisms involved in BC.
Material and Methods
Patients in TCGA database
MiR-101 (miR-101-1 and miR-101-2) sequence data of BC were obtained from the TCGA dataset on 15 May 2016; the dataset included 781 patients with BC and 87 adjacent noncancerous breast tissues. In BC, the expression levels of log2-transformed miR-101-1 and miR-101-2 were analyzed, as was their correlation with survival data and clinical parameters.
Retrieval of BC gene expression microarray data
Microarray data for miR-101-3p transfected in BC cells were searched in Gene Expression Omnibus (GEO, http://www.ncbi.nlm.nih.gov/geo/). The array data for GSE31397 were retrieved as raw data files based on the GPL570 platform (Affymetrix Human Genome U133 Plus 2.0 Array; Affymetrix, Inc., Santa Clara, CA). The alterations in miR-101-3p transfected MCF-7 cells compared with scramble control transfected cells were included in the expression profiling.
Data preprocessing and DEG analysis
The Affymetrix package [20] in R language preprocessed the original data, and probe-level data were mapped to gene names. The DEGs between the miR-101-3p transfected cells and the control group were identified with the limma package of R language [21]. Down-regulated DEGs were determined with the criteria of fold change >2.5 and P value <0.05.
Prediction of miRNA-3p target genes
Potential target genes of miR-101-3p were predicted by 13 online databases: DIANAmT, mirTarBase, RNA22, miRanda, PICTAR, miRDB, miRWalk, PolymiRTS, PITA, RNAhybrid, Targetscan, Targetminer, and TarBase. Targets were acquired from the DGEs in GEO and the predicted genes that were identified in more than 5 out of 13 programs. Moreover, the experimental validation of the targets using a luciferase reporter assay, WB, and RT-PCR was collected from TarBase, mirTarBase, and published studies.
GO, KEGG and network analysis
To discern the biological attributes of the putative target genes, GO and KEGG enrichment analyses were completed using DAVID (https://david.ncifcrf.gov, version 6.7) [22]. The functional network graph of the selected genes was further visualized with Cytoscape 3.3.0 [23].
Statistical analysis
SPSS 20.0 was used for data analysis; data are presented as the mean ± standard deviation (SD). Statistical significance was assessed with a 2-sample t test between the cancer samples and adjacent noncancerous tissues and the correlation between miR-101-3p and clinical features. Survival data were determined with the Kaplan-Meier method. P<0.05 represented statistical significance.
Results
Clinical significance of miR-101 (miR-101-1 and miR-101-2) in BC based on TCGA data
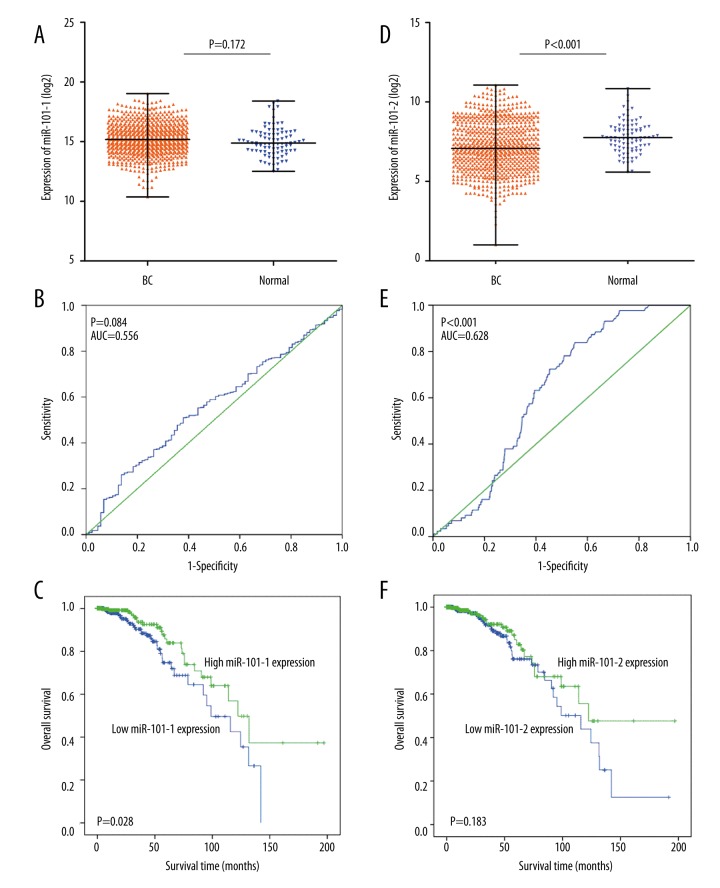
The miR-101-2 expression level was lower in BC than in the normal cells, but this difference was not statistically significant (Figure 1A, 1D). A receiver operating characteristic (ROC) curve was constructed to identify diagnostic value in the cases of BC compared with non-cancer breast tissues. The area under the curve (AUC) of miR-101-1 was 0.56 (95% CI: 0.50–0.62), with a sensitivity and specificity of 51.0% and 62.1%, respectively (Figure 1B). The AUC of miR-101-2 was 0.63 (95% CI: 0.58–0.68), with a sensitivity and specificity of 83.9% and 44.8%, respectively (Figure 1E). In the analysis of miR-101 and clinical parameters, miR-101-1 was prominently associated with the expression of the estrogen receptor (ER), progesterone receptor (PR), and human epidermal growth factor receptor 2 (HER2) in BC (Table 1). MiR-101-2 was significantly associated with tumor (T), lymph node (N), and metastasis (M) stages of BC (Table 2). Moreover, decreased miR-101-1 expression revealed a poor prognosis in BC (HR=1.79; 95% CI: 1.06–3.01; P=0.028) (Figure 1C). However, no significant prognostic value was identified for miR-101-2 in BC (HR=1.423, 95% CI: 0.84–2.41; P=0.183) (Figure 1F).
Figure 1.
The clinical significance of miR-101 in BC in TCGA data. (A), miR-101-1 expression in BC compared with the normal group; (B), ROC curve analysis of miR-101-1 for discriminating BC from normal breast tissues; (C), Kaplan-Meier survival curves showed that lower miR-101-1 expression was associated with worse prognosis of patients with BC; (D), miR-101-2 expression in BC compared with the normal group; (E), ROC curve analysis of miR-101-2 for discriminating BC from normal breast tissues; (F), Kaplan-Meier survival curves revealed the connection between miR-101-2 and the prognosis of patients with BC.
Table 1.
Correlation of miR-101-1 expression with clinical parameters in BC of TCGA data.
| Clinicopathological features | Cases | MiR-101-1 expression | P value | ||
|---|---|---|---|---|---|
| Low | High | ||||
| Age | ≥50 | 563 | 291 | 272 | 0.254 |
| <50 | 218 | 99 | 119 | ||
| Gender | Female | 772 | 382 | 390 | 0.241 |
| Male | 9 | 8 | 1 | ||
| T | T1–T2 | 657 | 338 | 319 | 0.086 |
| T3–T4 | 123 | 52 | 71 | ||
| N | N0 | 373 | 183 | 190 | 0.546 |
| N1–N3 | 398 | 205 | 193 | ||
| M | M0 | 610 | 325 | 285 | 0.298 |
| M1 | 9 | 2 | 7 | ||
| Stage | I–II | 587 | 290 | 297 | 0.782 |
| III–IV | 186 | 94 | 92 | ||
| ER | Positive | 565 | 259 | 306 | <0.001 |
| Negative | 170 | 111 | 59 | ||
| PR | Positive | 502 | 221 | 281 | <0.001 |
| Negative | 231 | 148 | 83 | ||
| HER2 | Positive | 99 | 57 | 42 | 0.037 |
| Negative | 397 | 202 | 195 | ||
T – tumor stage; N – lymph node stage; M – metastasis stage; ER – estrogen receptor; PR – progesterone receptor; HER2 – human epidermal growth factor receptor 2. The median was chosen as the cut-off value because of the skewed distribution of the expression data.
Table 2.
Correlation between miR-101-2 expression and clinical parameters in BC from the TCGA data.
| Clinicopathological features | Cases | MiR-101-2 expression | P value | ||
|---|---|---|---|---|---|
| Low | High | ||||
| Age | ≥50 | 563 | 287 | 276 | 0.150 |
| <50 | 218 | 104 | 114 | ||
| Gender | Female | 772 | 385 | 387 | 0.485 |
| Male | 9 | 6 | 3 | ||
| T | T1–T2 | 657 | 343 | 314 | 0.008 |
| T3–T4 | 123 | 48 | 75 | ||
| N | N0 | 373 | 200 | 173 | 0.029 |
| N1–N3 | 398 | 187 | 211 | ||
| M | M0 | 610 | 343 | 267 | 0.017 |
| M1 | 9 | 2 | 7 | ||
| Stage | I–II | 587 | 298 | 289 | 0.129 |
| III–IV | 186 | 88 | 98 | ||
| ER | Positive | 565 | 275 | 290 | 0.058 |
| Negative | 170 | 88 | 82 | ||
| PR | Positive | 502 | 245 | 257 | 0.250 |
| Negative | 231 | 118 | 113 | ||
| HER2 | Positive | 99 | 54 | 55 | 0.481 |
| Negative | 397 | 207 | 190 | ||
T – tumor stage; N – lymph node stage; M – metastasis stage; ER – estrogen receptor; PR – progesterone receptor; HER2 – human epidermal growth factor receptor 2. The median was chosen as the cut-off value because of the skewed distribution of the expression data.
Potential targets of miR-101-3p in BC
As shown in Figure 2, GSE31397 array data were acquired, and 921 genes were selected as differentially expressed in miR-101-3p transfected MCF-7 cells compared with scramble control cells. In addition, the online prediction process was conducted with 13 databases to obtain potential targets of miR-101-3p, and 7924 genes were identified after duplicated genes were excluded. The genes predicted by 5 out of 13 programs were selected, and then 377 target genes were searched from the array data and predicted targets. Furthermore, 69 available genes that were identified as targets of miR-101-3p through TarBase, miTarBase and published literature were included (Table 3). Eventually, a total of 427 genes were identified for the gene-annotation enrichment analysis and KEGG pathway analysis.
Figure 2.
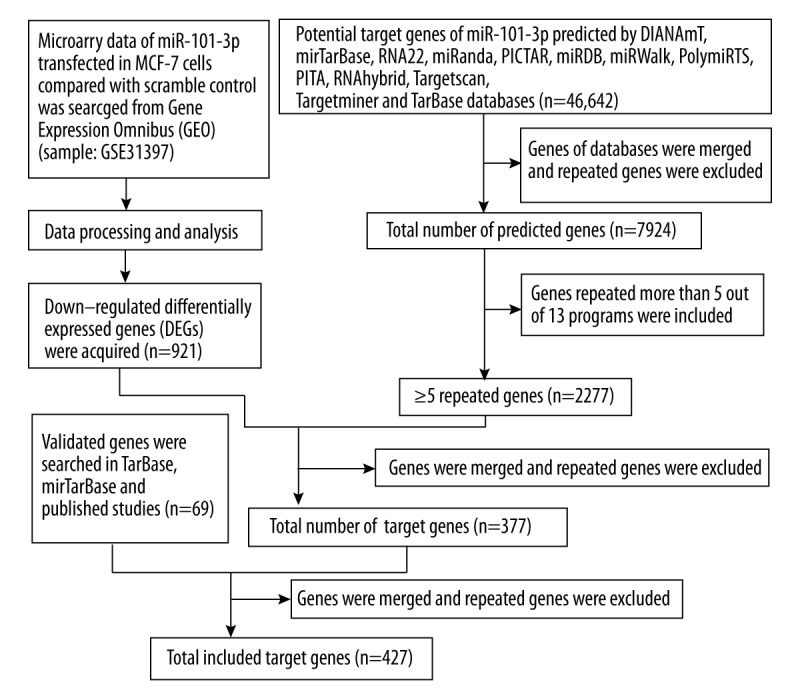
Flow chart showing target genes selection
Table 3.
Validated targets of miR-101-3p in TarBase, miTarBase and published literatures.
| Genes | ||||||
|---|---|---|---|---|---|---|
| All validated | ABCA1 | CFTR | EZB2 | MCL1 | PTGS2 | SUZ12 |
| AMPK | c-Met | EZH2 | Mcl-1 | RAB5A | TET2 | |
| AP1 | COX2 | FBN2 | MEIS1 | Rac1 | TGFBR1 | |
| APP | CPEB1 | FMR1 | MET | RAP1B | VEGF | |
| ARID1A | CXCL12 | FOS | MITF | RLIP76 | VEGFA | |
| ATG4D | CXCR7 | HMGA2 | MTOR | ROCK2 | VEGF-C | |
| ATM | DNMT3A | JAK2 | MYCN | RUNX1 | VHL | |
| ATP5B | DUSP1 | KLF6 | NLK | SOCS2 | ZEB1 | |
| ATXN1 | EED | Lin28B | PIK3CB | SOX9 | ZEB2 | |
| CASP3 | EP4 | MAGI2 | Pim1 | SphK1 | ||
| CDH5 | EYA1 | MAPK1 | PRDM16 | STMN1 | ||
| CDK8 | EZB1 | MARCH7 | PTGER4 | Stmnl | ||
| Validated in BC | CXCR7 | JAK2 | MAPK | STMN1 | ||
| EYA1 | MAGI2 | Mcl-1 | VHL | |||
Gene-annotation enrichment analysis and KEGG pathway analysis
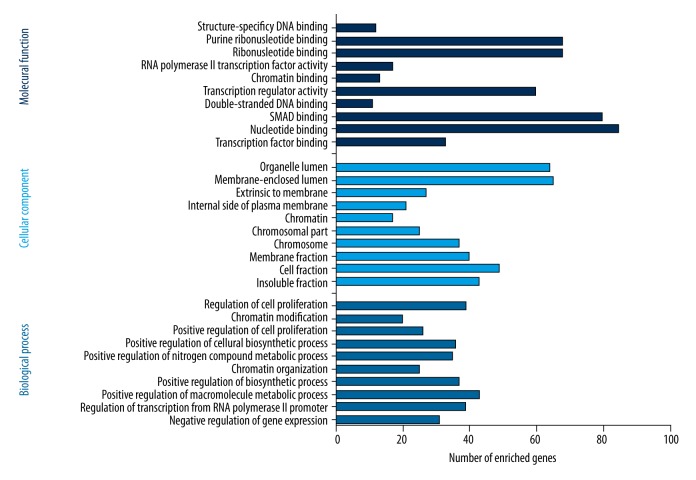
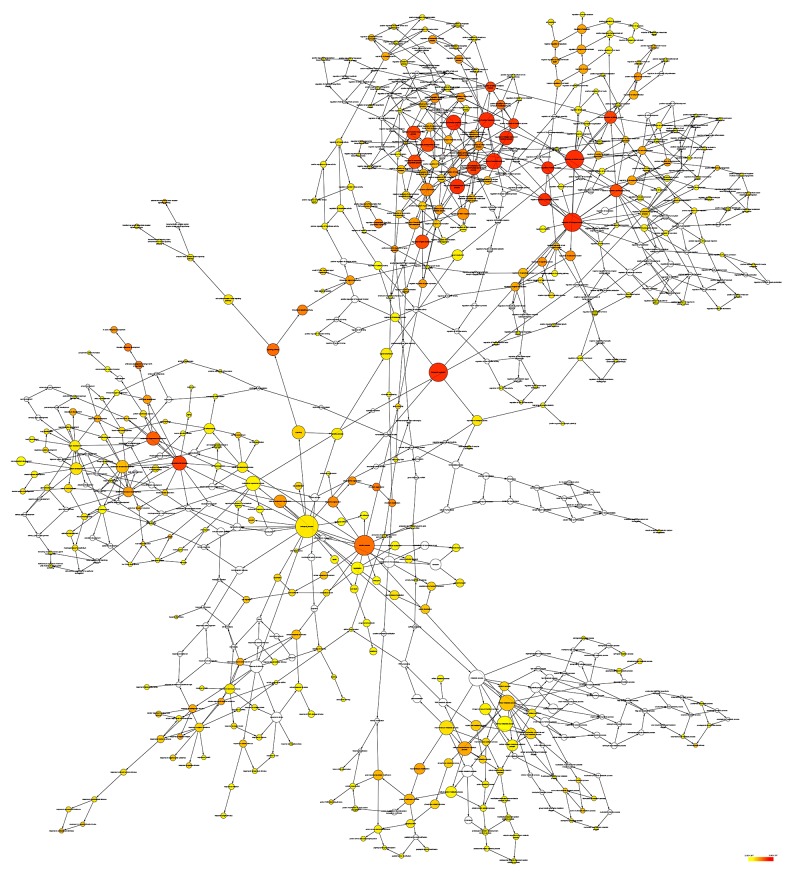
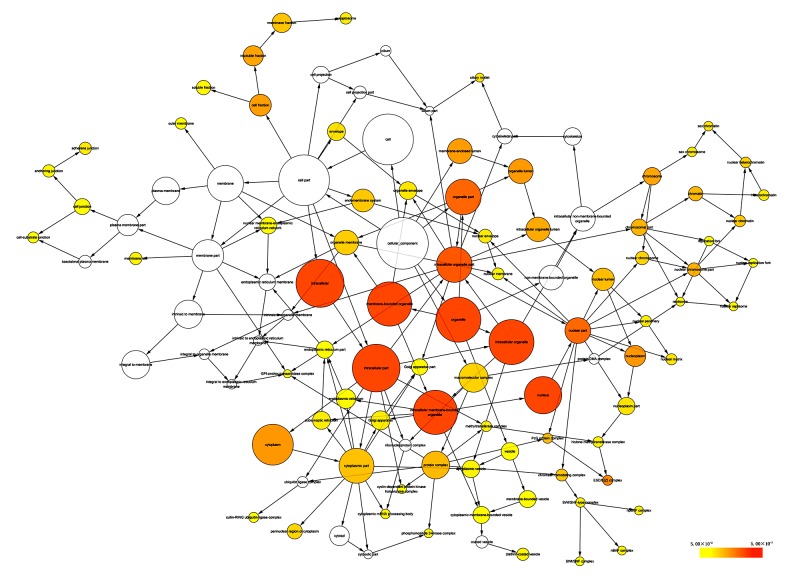
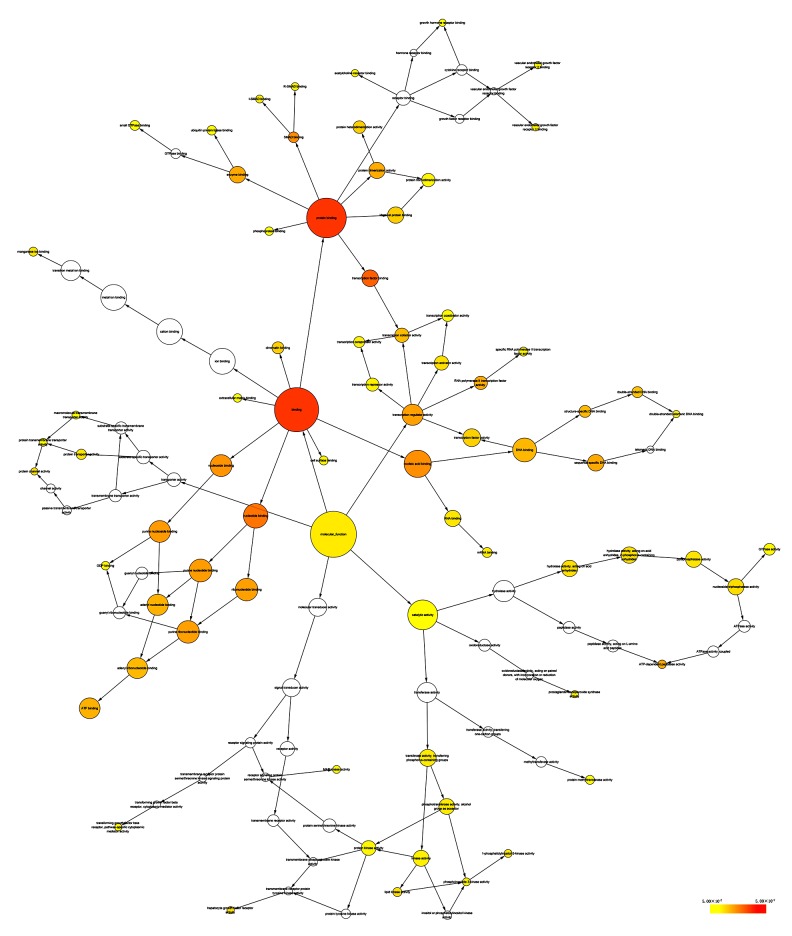
Selecting Homo sapiens as the background of listed target genes in DAVID, we obtained the GO term annotations and KEGG pathway analysis through the functional annotation summaries. An EASE Score or modified Fisher’s exact test was utilized for calculating the p value. The results of the GO analysis are summarized in Table 4 and Figure 3, and the top 10 enriched items are listed according to p values. The biological processes (BP) of the potential targets of miR-101-3p markedly focused on the gene expression, transcription, metabolism, biosynthesis, and proliferation processes (p<0.001). As for the cellular component (CC), the target genes were significantly located in insoluble, cell, and membrane fractions (p<0.001). Moreover, molecular function (MF) category was enriched in transcription factors and proteins involved in nucleotide binding (p<0.001). In terms of the KEGG pathway analysis, the results were notably enriched in pathways involved in cancer, renal cell carcinoma, and colorectal cancer. Moreover, results were highly enriched in the VEGF, mTOR, focal adhesion, Wnt, chemokine, ErbB, and p53 signaling pathways (p<0.05, Table 5 and Figure 4). The enrichment graphs for the potential target genes were generated with Cytoscape software. As shown in Figure 5, the clearly associated functional modules were metabolism, development, cellular, and biological processes in BP. Analysis of CC revealed the most correlated functions were membrane and intracellular fractions (Figure 6). In the MF network, protein and transcription factor binding were the top results (Figure 7).
Table 4.
GO functional annotation for the significant targets of miR-101-3p as determined by DAVID.
| GO ID | GO term | Count (%) | P value | Gene symbol |
|---|---|---|---|---|
| Biological process | ||||
| GO: 0010629 | Negative regulation of gene expression | 31 (0.4) | 6.89×10⁻⁶ | GCLC, THRB, CBX4, ZEB2, ZEB1, SOX9, PRDM16, LIN28B etc. |
| GO: 0006357 | Regulation of transcription from RNA polymerase ii promoter | 39 (0.5) | 8.52×10⁻⁶ | THRB, MITF, CBX4, ZEB1, PRDM16, SOX9, MED20, FOS etc. |
| GO: 0010604 | Positive regulation of macromolecule metabolic process | 43 (0.6) | 1.36×10⁻⁵ | GCLC, THRB, MITF, ZEB1, PRDM16, SOX9, FOS, APP, MEIS2 etc. |
| GO: 0009891 | Positive regulation of biosynthetic process | 37 (0.5) | 1.83×10⁻⁵ | THRB, MITF, ZEB1, ABCA1, PRDM16, SOX9, FOS, APP etc. |
| GO: 0006325 | Chromatin organization | 25 (0.4) | 2.10×10⁻⁵ | EZH2, NAP1L1, CBX4, CDYL, H2AFV, SMARCD1 etc. |
| GO: 0051173 | Positive regulation of nitrogen compound metabolic process | 35 (0.5) | 2.15×10⁻⁵ | THRB, MITF, ZEB1, ABCA1, PRDM16, SOX9, FOS, APP etc. |
| GO: 0031328 | Positive regulation of cellular biosynthetic process | 36 (0.5) | 3.20×10⁻⁵ | THRB, MITF, ZEB1, ABCA1, PRDM16, SOX9, FOS, APP etc. |
| GO: 0008284 | Positive regulation of cell proliferation | 26 (0.4) | 3.24×10⁻⁵ | NRP1, PTGS2, MARCKSL1, NAP1L1, CD47, AGGF1, TGFA etc. |
| GO: 0016568 | Chromatin modification | 20 (0.3) | 4.74×10⁻⁵ | DNMT3A, AEBP2, UBE2A, EZH2, CBX4, ARID1A, RBBP7, UBE2B etc. |
| GO: 0042127 | Regulation of cell proliferation | 39 (0.6) | 4.94×10⁻⁵ | NRP1, PTGS2, MARCKSL1, MITF, NAP1L1, ZEB1, SOX9, CDH5 etc. |
| Cellular component | ||||
| GO: 0005626 | Insoluble fraction | 43 (0.6) | 3.83×10⁻⁷ | GALNT3, GNAI3, PTGS2, PLXNA1, HMGCR, SGPP1, ADCY6 etc. |
| GO: 0000267 | Cell fraction | 49 (0.7) | 1.78×10⁻⁶ | RAB3GAP2, PLXNA1, PTGS2, HMGCR, SGPP1, ADCY6, SLC26A2 etc. |
| GO: 0005624 | Membrane fraction | 40 (0.6) | 2.65×10⁻⁶ | GALNT3, GNAI3, PTGS2, PLXNA1, HMGCR, SGPP1, ADCY6 etc. |
| GO: 0005694 | Chromosome | 28 (0.4) | 3.14×10⁻⁶ | HMGB3, CBX4, CDYL, SIN3A, H2AFV, PAFAH1B1, CHD6, TOP2B etc. |
| GO: 0044427 | Chromosomal part | 25 (0.4) | 4.29×10⁻⁶ | CBX4, CDYL, SIN3A, H2AFV, PAFAH1B1, TOP2B, CHD6 etc. |
| GO: 0000785 | Chromatin | 17 (0.2) | 8.35×10⁻⁶ | DNMT3A, UBE2A, PDS5B, CBX4, HMGA2, UBE2B, JUNB, MYCN etc. |
| GO: 0009898 | Internal side of plasma membrane | 21 (0.3) | 2.14×10⁻⁵ | RAP2C, RAB39B, AP1G1, MAOB, PIP5K1C, SNAPIN, CTNNA1 etc. |
| GO: 0019898 | Extrinsic to membrane | 27 (0.4) | 3.26×10⁻⁵ | PTGS2, CHMP5, ARHGAP17, MTMR2, DMXL2, PVRL1, RAC1 etc. |
| GO: 0031974 | Membrane-enclosed lumen | 65 (0.9) | 1.10×10⁻⁴ | MRPL42, PTGS2, ZMAT3, ATP5B, EZH2, DNAJC10, ZEB1 etc. |
| GO: 0043233 | Organelle lumen | 64 (0.9) | 1.13×10⁻⁴ | MRPL42, PTGS2, ZMAT3, ATP5B, EZH2, DNAJC10, ZEB1, WTAP etc. |
| Molecular function | ||||
| GO: 0008134 | Transcription factor binding | 33 (0.5) | 2.25×10⁻⁶ | THRB, CBX4, ZEB1, PRDM16, CBFA2T2, RAB1A, TMF1 etc. |
| GO: 0000166 | Nucleotide binding | 85 (1.2) | 7.96×10⁻⁵ | CPEB2, HMGCR, ATP5B, UBE2G1, ADCY6, PIP5K1C, HELZ etc. |
| GO: 0046332 | SMAD binding | 8 (0.1) | 1.41×10⁻⁴ | FOS, TGFBR1, ZEB2, SMAD2, SMAD1, PRDM16, PURB, PURA |
| GO: 0003690 | Double-stranded DNA binding | 11 (0.2) | 1.66×10⁻⁴ | KLF6, FOS, ANKRD17, THRB, SMAD2, ZEB1, PURB etc. |
| GO: 0030528 | Transcription regulator activity | 60 (0.9) | 4.17×10⁻⁴ | THRB, ELF5, EZH2, MITF, CBX4, ZEB2, ZEB1, LASS6, CBFA2T2 etc. |
| GO: 0003682 | Chromatin binding | 13 (0.2) | 4.22×10⁻⁴ | ATRX, SUZ12, DNMT3A, CDYL, EZH2, MITF, SMARCA5, CBX4 etc. |
| GO: 0003702 | RNA polymerase II transcription factor activity | 17 (0.2) | 4.79×10⁻⁴ | CEBPA, RXRB, MITF, TEAD3, SMAD1, SOX9, MED20, MEIS1 etc. |
| GO: 0032553 | Ribonucleotide binding | 68 (1.0) | 1.02×10⁻³ | UBE2G1, ATP5B, ADCY6, PIP5K1C, HELZ, RAB1A, ANKRD17 etc. |
| GO: 0032555 | Purine ribonucleotide binding | 68 (1.0) | 1.02×10⁻³ | UBE2G1, ATP5B, ADCY6, PIP5K1C, HELZ, RAB1A, ANKRD17 etc. |
| GO: 0043566 | Structure-specific DNA binding | 12 (0.2) | 1.13×10⁻³ | KLF6, FOS, ANKRD17, THRB, SUB1, SMAD2, ZEB1, PURB etc. |
Figure 3.
Functional annotation of the top 10 miR-101-3p targeted genes identified with GO using DAVID.
Table 5.
KEGG pathway enrichment analysis of miR-101-3p target genes by DAVID.
| KEGG ID | KEGG term | Count (%) | P value | Gene symbol |
|---|---|---|---|---|
| hsa05200 | Pathways in cancer | 25 (0.4) | 1.41×10⁻⁵ | PTGS2, MITF, FOS, CASP3, RAC1, TGFA, RUNX1, CEBPA, RXRB, PIK3CB, VHL, TGFBR1, MET, ITGA2, SMAD2, CDK6, CTNNA1, STK4, FZD4, FZD6, NRAS, MAPK1, CDKN1A, VEGFA, MTOR |
| hsa05211 | Renal cell carcinoma | 10 (0.1) | 1.44×10⁻⁴ | MAPK1, NRAS, VHL, PIK3CB, MET, VEGFA, GAB1, RAC1, TGFA, RAP1B |
| hsa05210 | Colorectal cancer | 10 (0.1) | 5.79×10⁻⁴ | MAPK1, FOS, CASP3, PIK3CB, TGFBR1, MET, RAC1, SMAD2, FZD4, FZD6 |
| hsa04520 | Adherens junction | 9 (0.1) | 1.44×10⁻³ | PTPRJ, MAPK1, PVRL1, NLK, TGFBR1, MET, RAC1, SMAD2, CTNNA1 |
| hsa05223 | Non-small cell lung cancer | 7 (0.1) | 4.05×10⁻³ | MAPK1, NRAS, PIK3CB, RXRB, TGFA, CDK6, STK4 |
| hsa05212 | Pancreatic cancer | 8 (0.1) | 4.15×10⁻³ | MAPK1, PIK3CB, TGFBR1, VEGFA, RAC1, TGFA, CDK6, SMAD2 |
| hsa05221 | Acute myeloid leukemia | 7 (0.1) | 5.79×10⁻³ | CEBPA, MAPK1, NRAS, PIK3CB, PIM1, MTOR, RUNX1 |
| hsa05221 | Glioma | 7 (0.1) | 8.65×10⁻³ | MAPK1, NRAS, CDKN1A, PIK3CB, TGFA, CDK6, MTOR |
| hsa04310 | Wnt signaling pathway | 11 (0.16) | 1.06×10⁻² | PSEN1, CCND3, VANGL1, ROCK2, NLK, RAC1, SMAD2, PLCB1, FBXW11, FZD4, FZD6 |
| hsa05218 | Melanoma | 7 (0.1) | 1.52×10⁻² | MAPK1, NRAS, CDKN1A, PIK3CB, MET, MITF, CDK6 |
| hsa04150 | mTOR signaling pathway | 6 (0.1) | 1.56×10⁻² | MAPK1, PIK3CB, VEGFA, PRKAA1, MTOR, DDIT4 |
| hsa04120 | Ubiquitin mediated proteolysis | 10 (0.1) | 1.57×10⁻² | UBE2D3, FBXW7, UBE2A, VHL, UBE2G1, UBE2F, CUL4B, UBE2D1, FBXW11, UBE2B |
| hsa04062 | Chemokine signaling pathway | 12 (0.2) | 1.71×10⁻² | MAPK1, NRAS, GNAI3, ROCK2, GNB1, PIK3CB, ADCY6, RAC1, RAP1B, JAK2, PLCB1, CXCL12 |
| hsa04670 | Leukocyte transendothelial migration | 9 (0.1) | 1.88×10⁻² | F11R, GNAI3, ROCK2, PIK3CB, RAC1, RAP1B, CTNNA1, CXCL12, CDH5 |
| hsa04370 | VEGF signaling pathway | 7 (0.1) | 1.94×10⁻² | MAPK1, NRAS, PTGS2, PIK3CB, VEGFA, SPHK1, RAC1 |
| hsa05220 | Chronic myeloid leukemia | 7 (0.1) | 1.94×10⁻² | MAPK1, NRAS, CDKN1A, PIK3CB, TGFBR1, CDK6, RUNX1 |
| hsa04916 | Melanogenesis | 8 (0.1) | 2.22×10⁻² | MAPK1, NRAS, GNAI3, MITF, ADCY6, PLCB1, FZD4, FZD6 |
| hsa04510 | Focal adhesion | 12 (0.2) | 2.76×10⁻² | MAPK1, CCND3, ROCK2, PIK3CB, MET, VEGFA, RAC1, ITGA2, PIP5K1C, RAP1B, CAPN2, PARVA |
| hsa04360 | Axon guidance | 9 (0.1) | 3.02×10⁻² | MAPK1, NRAS, NRP1, GNAI3, PLXNA1, ROCK2, MET, RAC1, CXCL12 |
| hsa04012 | ErbB signaling pathway | 7 (0.1) | 3.70×10⁻² | MAPK1, NRAS, CDKN1A, PIK3CB, GAB1, TGFA, MTOR |
| hsa04115 | p53 signaling pathway | 6 (0.1) | 4.36×10⁻² | CDKN1A, CASP3, CCND3, ZMAT3, CDK6, ATM |
Figure 4.
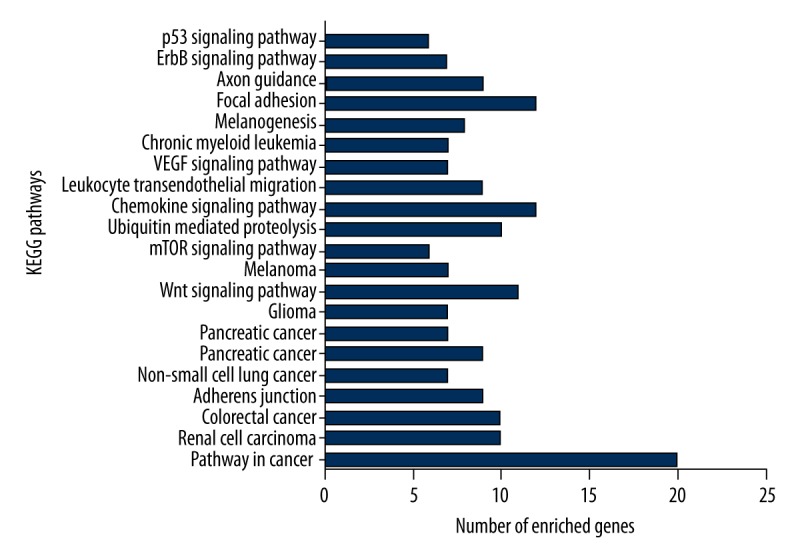
KEGG pathways enriched in miR-101-3p targeted genes as evaluated by DAVID.
Figure 5.
The biological process (BP) network of miR-101-3p targeted genes was constructed using Cytoscape. The color and size of the nodes indicate the significance of the interactions.
Figure 6.
The cellular component (CC) network of miR-101-3p targeted genes was constructed using Cytoscape. The color and size of the nodes indicate the significance of the interactions.
Figure 7.
The molecular function (MF) network of miR-101-3p targeted genes was constructed using Cytoscape. The color and size of the nodes indicate the significance of the interactions.
Discussion
miRNAs play vital roles in BC, and an increasing amount of research has made important contributions to this field. MiRNAs, including miR-21/9/10b/27a/155, were overexpressed in BC, while miR-31/34a/125/205 were down-regulated during BC progression [24, 25]. Zhao et al. [26] demonstrated that miR-221 may be a predictive biomarker for BC. In the research of Eissa et al. [27], patients with BC positive for miR-10b had shorter relapse-free survival rates, and miR-10b was an independent prognostic factor of BC. MiR-451 influenced the drug resistances and miR-129-5p regulated radiosensitivity via accelerating the apoptosis of breast cancer cells [28,29]. Peptide nucleic acid (PNA) has been researched as a novel drug in miRNA therapeutics, but has still not been successfully used to treat BC [30,31]. Recently, decreased miR-101-3p levels were observed in tumors, including colon, gastric, lung, ovary, and prostate cancers [32]. miR-101-3p has important roles in the tumorigenesis of BC; however, the mechanisms and target genes of miR-101-3p are still unknown.
TCGA data demonstrated that miR-101-2 expression was lower in BC tissues than in normal tissues, while no statistical difference was shown for miR-101-1 expression. MiR-101-1 was also closely linked to ER, PR, and HER2, while miR-101-2 was associated with the T, N, and M stages of BC. This result revealed that miR-101-2 may have diagnostic value in BC to some extent. Down-regulated miR-101-1 was associated with poor prognosis in patients with BC, while no statistical significance was found for miR-101-2. miR-101 has 2 genomic loci, with miR-101-1 being located on chromosome 1p31.3 and miR-101-2 located on chromosome 9p24.1 [33]. This result revealed that the miR-101 transcripts on different chromosomes play diverse roles in the diagnosis, prognosis, and clinical outcome of BC. MiR-101-1 is processed into miR-101-3p and miR-101-5p, while miR-101-2 only produces mature miR-101-3p. In addition, the different sequences of miR-101-1 and miR-101-2 will promote or restrict different targets through participation in the translation process and reveal different biological functions [12]. However, it was difficult to extrapolate the mature miRNA levels (which are the final cellular effectors) based on these data. One precursor may be processed to 1 or 2 miRNAs; thus, the mature and precursor miRNA levels might not correlate, and this therefore will influence the clinical interpretation.
Putative miR-101-3p targets were derived from the expression profiling of miR-101-3p transfected in MCF-7 cells compared with scramble control cells, online prediction databases, validated targets, and published studies. Among the 427 putative target genes, the most predominant functions were transcription, metabolism, biosynthesis, proliferation, and transcription factor binding. This result indicated that candidate genes have a definitive impact on the pathogenesis of BC. In previous studies, 8 targets of miR-101-3p were validated in BC: AMP-activated protein kinase (AMPK), CX chemokine receptor 7 (CXCR7), eyes absent homolog 1 (EYA1), janus kinase 2 (JAK2), membrane-associated guanylate kinase 2 (MAGI2), myeloid cell leukemia 1 (Mcl-1), Stathmin1 (STMN1), and von Hippel-Lindau tumor suppressor (VHL). AMPK was found to regulate tumor metabolism and be targeted by mir-101-3p and was identified as a promising therapeutic target in triple-negative breast cancer (TNBC) [34]. miR-101-3p inhibited the development and lymph node metastasis of BC via targeting CXCR7 [15]. The latest research by Guan et al. [35] showed that miR-101-3p was down-regulated and inhibited cell proliferation and promoted apoptosis by targeting EYA1 in BC. JAK2 has been verified to participate in suppressing proliferation and promoting apoptosis in BC cells through miR-101-3p [14]. Sachdeva et al. [36] demonstrated that miR-101-3p reduced phosphatase and tensin homolog (PTEN) activity by suppressing MAGI-2, leading to Akt activation. MiR-101-3p, which directly inhibited MCL-1, was reported to restrain cell progression and increase sensitivity to paclitaxel in TNBC [37]. In a study by Wang et al. [13], the down-regulation of miR-101-3p was confirmed to regulate STMN1, and was associated with cellular proliferation and invasiveness in different subtypes of BC tissues. Moreover, miR-101-3p enhanced apoptosis and cell cycle arrest by down-regulating VHL expression in normoxic conditions [38].
Several studies have reported the signaling pathways associated with miR-101-3p in BC. miR-101-3p inhibited CXCR7-STAT3 signaling and exerted tumor-suppressive effects in BC cells [15]. Down-regulated miR-101-3p suppressed cell proliferation through the Notch signaling pathway in BC [34]. Furthermore, estrogen deprivation enhanced the miR-101-3p-mediated activation of the Akt signaling pathway [36]. In this paper, a total of 26 bio-pathways were identified, and analysis of miR-101-3p targets revealed statistical significance for 21 pathways. In addition, the visualized network graph of miR-101-3p-mediated targets in Cytoscape showed biological functions similar to the DAVID analysis mentioned above. The highly connected targets are involved in important biological processes and molecular functions.
Among the pathways of the miR-101-3p targeted genes, the VEGF, mTOR, focal adhesion, Wnt, chemokine, ErbB, and p53 signaling pathways were highly enriched. The VEGF signaling pathway enhanced angiogenesis for the aggressive proliferation and malignant progression of BC [39]. The PI3K/Akt/mTOR signaling pathway plays a vital regulatory function in proliferation, apoptosis, metabolism, and migration, and the invasion of BC can be alleviated by miR-199a-5p via targeting the FAK/Src/Akt/mTOR signaling pathway [40]. Focal adhesion kinase (FAK) regulates cell motility, extracellular matrix integrin signaling, cell proliferation, and survival. MiR-7 inhibited cell transformation and the metastasis of BC via regulating FAK, which is correlated with a poor prognosis [41]. The chemokine signaling pathway mediates chemokines and promotes the chemotaxis, growth, and survival of BC cells [42]. miR-195 suppressed the Wnt signaling pathway, which promotes cell proliferation and the metastasis of TNBC [43]. Han et al. reported that the ErbB signaling pathway can be regulated by STAT1 in the tumorigenesis of BC [44]. Furthermore, scaffold/matrix-associated region-binding protein 1 (SMAR1) may increase radiosensitivity in the MCF-7 BC cell line by regulating the p53 signaling pathway [45]. Enrichment analysis of the potential pathways revealed that the Wnt signaling pathway probably regulates the cell cycle, metabolism, and phosphorylation by targeting CCND3 and ROCK. MAPK1, MTOR, and VEGFA may contribute to metabolism and biosynthesis, which are associated with the mTOR signaling pathway. The VEGF signaling pathway is involved in proliferation and apoptosis via targeting MAPK1, RAC1, NRAS, and VEGFA. The chemokine, focal adhesion, mTOR, VEGF, and ErbB signaling pathways might influence metabolism, phosphorylation, kinase activity, and intracellular signaling cascades by regulating PIK3CB. However, the interaction of target genes and their signaling pathways, as well as their molecular mechanisms, should be further explored.
Conclusions
This study is a comprehensive target analysis of the miR-101 using gene expression profiling, public databases, and prediction software. MiR-101 plays vital roles in BC, while the products derived from different locations on different chromosomes did not show the same functions. The genes targeted by miR-101-3p influence the progression of BC and might influence the biological functions performed by the VEGF, mTOR, focal adhesion, Wnt, and chemokine signaling pathways by targeting crucial genes. The mechanisms of novel molecular markers should be further verified with new techniques, and will contribute to the diagnosis and treatment of BC.
Footnotes
Conflicts of interest
The authors declare that there is no conflict of interest regarding the publication of this paper.
Source of support: This study was supported by the Fund of Scientific Research Project of Basic Ability Promoting for Middle Age and Youth Teachers of Guangxi Universities (KY2016LX044) and Future Academic Star of Guangxi Medical University (WLXSZX16013)
References
- 1.Torre LA, Bray F, Siegel RL, et al. Global cancer statistics, 2012. Cancer J Clin. 2015;65(2):87–108. doi: 10.3322/caac.21262. [DOI] [PubMed] [Google Scholar]
- 2.Siegel RL, Miller KD, Jemal A. Cancer statistics, 2016. Cancer J Clin. 2016;66(1):7–30. doi: 10.3322/caac.21332. [DOI] [PubMed] [Google Scholar]
- 3.Chen W, Zheng R, Baade PD, et al. Cancer statistics in China, 2015. Cancer J Clin. 2016;66(2):115–32. doi: 10.3322/caac.21338. [DOI] [PubMed] [Google Scholar]
- 4.Moasser MM, Krop IE. The evolving landscape of HER2 targeting in breast cancer. JAMA Oncol. 2015;1(8):1154–61. doi: 10.1001/jamaoncol.2015.2286. [DOI] [PubMed] [Google Scholar]
- 5.Perou CM, Sorlie T, Eisen MB, et al. Molecular portraits of human breast tumours. Nature. 2000;406(6797):747–52. doi: 10.1038/35021093. [DOI] [PubMed] [Google Scholar]
- 6.Kong YW, Cannell IG, de Moor CH, et al. The mechanism of micro-RNA-mediated translation repression is determined by the promoter of the target gene. Proc Natl Acad Sci USA. 2008;105:8866–71. doi: 10.1073/pnas.0800650105. [DOI] [PMC free article] [PubMed] [Google Scholar]
- 7.Ambros V. The functions of animal microRNAs. Nature. 2004;431(7006):350–55. doi: 10.1038/nature02871. [DOI] [PubMed] [Google Scholar]
- 8.Xue J, Niu J, Wu J, Wu ZH. MicroRNAs in cancer therapeutic response: Friend and foe. World J Clin Oncol. 2014;5(4):730–43. doi: 10.5306/wjco.v5.i4.730. [DOI] [PMC free article] [PubMed] [Google Scholar]
- 9.Min W, Wang B, Li J, et al. The expression and significance of five types of miRNAs in breast cancer. Med Sci Monit Basic Res. 2014;20:97–104. doi: 10.12659/MSMBR.891246. [DOI] [PMC free article] [PubMed] [Google Scholar]
- 10.Bertoli G, Cava C, Castiglioni I. MicroRNAs: New biomarkers for diagnosis, prognosis, therapy prediction and therapeutic tools for breast cancer. Theranostics. 2015;5:1122–43. doi: 10.7150/thno.11543. [DOI] [PMC free article] [PubMed] [Google Scholar]
- 11.Yu F, Lv M, Li D, et al. MiR-506 over-expression inhibits proliferation and metastasis of breast cancer cells. Med Sci Monit. 2015;21:1687–92. doi: 10.12659/MSM.893522. [DOI] [PMC free article] [PubMed] [Google Scholar]
- 12.Sheng Y, Li J, Zou C, et al. Downregulation of miR-101-3p by hepatitis B virus promotes proliferation and migration of hepatocellular carcinoma cells by targeting Rab5a. Arch Virol. 2014;159(9):2397–410. doi: 10.1007/s00705-014-2084-5. [DOI] [PubMed] [Google Scholar]
- 13.Wang R, Wang HB, Hao CJ, et al. MiR-101 is involved in human breast carcinogenesis by targeting Stathmin1. PLoS One. 2012;7(10):e46173. doi: 10.1371/journal.pone.0046173. [DOI] [PMC free article] [PubMed] [Google Scholar]
- 14.Wang L, Li L, Guo R, et al. miR-101 promotes breast cancer cell apoptosis by targeting Janus kinase 2. Cell Physiol Biochem. 2014;34(2):413–22. doi: 10.1159/000363010. [DOI] [PubMed] [Google Scholar]
- 15.Li JT, Jia LT, Liu NN, et al. MiRNA-101 inhibits breast cancer growth and metastasis by targeting CX chemokine receptor 7. Oncotarget. 2015;6(31):30818–30. doi: 10.18632/oncotarget.5067. [DOI] [PMC free article] [PubMed] [Google Scholar]
- 16.Pan W. A comparative review of statistical methods for discovering differentially expressed genes in replicated microarray experiments. Bioinformatics. 2002;18:546–54. doi: 10.1093/bioinformatics/18.4.546. [DOI] [PubMed] [Google Scholar]
- 17.Hu Z, Fan C, Oh DS, et al. The molecular portraits of breast tumors are conserved across microarray platforms. BMC Genomics. 2006;7:96. doi: 10.1186/1471-2164-7-96. [DOI] [PMC free article] [PubMed] [Google Scholar]
- 18.Andorfer CA, Necela BM, Thompson EA, Perez EA. MicroRNA signatures: Clinical biomarkers for the diagnosis and treatment of breast cancer. Trends Mol Med. 2011;17:313–19. doi: 10.1016/j.molmed.2011.01.006. [DOI] [PubMed] [Google Scholar]
- 19.Shi M, Guo N. MicroRNA expression and its implications for the diagnosis and therapeutic strategies of breast cancer. Cancer Treat Rev. 2009;35:328–34. doi: 10.1016/j.ctrv.2008.12.002. [DOI] [PubMed] [Google Scholar]
- 20.Gautier L, Cope L, Bolstad BM, Irizarry RA. affy-analysis of Affymetrix GeneChip data at the probe level. Bioinformatics. 2004;20(3):307–15. doi: 10.1093/bioinformatics/btg405. [DOI] [PubMed] [Google Scholar]
- 21.Diboun I, Wernisch L, Orengo CA, Koltzenburg M. Microarray analysis after RNA amplification can detect pronounced differences in gene expression using limma. BMC Genomics. 2006;7:252. doi: 10.1186/1471-2164-7-252. [DOI] [PMC free article] [PubMed] [Google Scholar]
- 22.Dennis G, Jr, Sherman BT, Hosack DA, et al. DAVID: Database for annotation, visualization, and integrated discovery. Genome Biol. 2003;4:3. [PubMed] [Google Scholar]
- 23.Shannon P, Markiel A, Ozier O, et al. Cytoscape: A software environment for integrated models of biomolecular interaction networks. Genome Res. 2003;13:2498–504. doi: 10.1101/gr.1239303. [DOI] [PMC free article] [PubMed] [Google Scholar]
- 24.Christodoulatos GS, Dalamaga M. Micro-RNAs as clinical biomarkers and therapeutic targets in breast cancer: Quo Vadis? World J Clin Oncol. 2014;5(2):71–81. doi: 10.5306/wjco.v5.i2.71. [DOI] [PMC free article] [PubMed] [Google Scholar]
- 25.Ren YQ, Fu F, Han J. MiR-27a modulates radiosensitivity of triple-negative breast cancer (TNBC) cells by targeting CDC27. Med Sci Monit. 2015;21:1297–303. doi: 10.12659/MSM.893974. [DOI] [PMC free article] [PubMed] [Google Scholar]
- 26.Zhao R, Wu J, Jia W, et al. Plasma miR-221 as a predictive biomarker for chemoresistance in breast cancer patients who previously received neoadjuvant chemotherapy. Onkologie. 2011;34:675–80. doi: 10.1159/000334552. [DOI] [PubMed] [Google Scholar]
- 27.Eissa S, Matboli M, Shehata HH, Essawy NO. MicroRNA-10b and minichromosome maintenance complex component 5 gene as prognostic biomarkers in breast cancer. Tumour Biol. 2015;36(6):4487–94. doi: 10.1007/s13277-015-3090-2. [DOI] [PubMed] [Google Scholar]
- 28.Gu X, Li JY, Guo J, et al. Influence of miR-451 on drug resistances of paclitaxel-resistant breast cancer cell line. Med Sci Monit. 2015;21:3291–97. doi: 10.12659/MSM.894475. [DOI] [PMC free article] [PubMed] [Google Scholar]
- 29.Luo J, Chen J, He L. mir-129-5p attenuates irradiation-induced autophagy and decreases radioresistance of breast cancer cells by targeting HMGB1. Med Sci Monit. 2015;21:4122–29. doi: 10.12659/MSM.896661. [DOI] [PMC free article] [PubMed] [Google Scholar]
- 30.Yan LX, Wu QN, Zhang Y, et al. Knockdown of miR-21 in human breast cancer cell lines inhibits proliferation, in vitro migration and in vivo tumor growth. Breast Cancer Res. 2011;13:R2. doi: 10.1186/bcr2803. [DOI] [PMC free article] [PubMed] [Google Scholar]
- 31.Piva R, Spandidos DA, Gambari R. From microRNA functions to microRNA therapeutics: Novel targets and novel drugs in breast cancer research and treatment (Review) Int J Oncol. 2013;43:985–94. doi: 10.3892/ijo.2013.2059. [DOI] [PMC free article] [PubMed] [Google Scholar]
- 32.Gui T, Shen K. miRNA-101: A potential target for tumor therapy. Cancer Epidemiol. 2012;36(6):537–40. doi: 10.1016/j.canep.2012.05.004. [DOI] [PubMed] [Google Scholar]
- 33.Chen J, Qin Z, Jiang Y, et al. Genetic variations in the flanking regions of miR-101-2 are associated with increased risk of breast cancer. PLoS One. 2014;9(1):e86319. doi: 10.1371/journal.pone.0086319. [DOI] [PMC free article] [PubMed] [Google Scholar]
- 34.Liu P, Ye F, Xie X, et al. mir-101-3p is a key regulator of tumor metabolism in triple negative breast cancer targeting AMPK. Oncotarget. 2016;7(23):35188–98. doi: 10.18632/oncotarget.9072. [DOI] [PMC free article] [PubMed] [Google Scholar]
- 35.Guan H, Dai Z, Ma Y, et al. MicroRNA-101 inhibits cell proliferation and induces apoptosis by targeting EYA1 in breast cancer. Int J Mol Med. 2016;37(6):1643–51. doi: 10.3892/ijmm.2016.2557. [DOI] [PubMed] [Google Scholar]
- 36.Sachdeva M, Wu H, Ru P, et al. MicroRNA-101-mediated Akt activation and estrogen-independent growth. Oncogene. 2011;30(7):822–31. doi: 10.1038/onc.2010.463. [DOI] [PubMed] [Google Scholar]
- 37.Liu X, Tang H, Chen J, et al. MicroRNA-101 inhibits cell progression and increases paclitaxel sensitivity by suppressing MCL-1 expression in human triple-negative breast cancer. Oncotarget. 2015;6(24):20070–83. doi: 10.18632/oncotarget.4039. [DOI] [PMC free article] [PubMed] [Google Scholar]
- 38.Liu N, Xia WY, Liu SS, et al. MicroRNA-101 targets von Hippel-Lindau tumor suppressor (VHL) to induce HIF1α mediated apoptosis and cell cycle arrest in normoxia condition. Sci Rep. 2016;6:20489. doi: 10.1038/srep20489. [DOI] [PMC free article] [PubMed] [Google Scholar]
- 39.Lu Y, Zhang X, Zhang J. Inhibition of breast tumor cell growth by ectopic expression of p16/INK4A via combined effects of cell cycle arrest, senescence and apoptotic induction, and angiogenesis inhibition. J Cancer. 2012;3:333–44. doi: 10.7150/jca.4046. [DOI] [PMC free article] [PubMed] [Google Scholar]
- 40.Li W, Wang H, Zhang J, et al. miR-199a-5p regulates β1 Integrin through Ets-1 to suppress invasion in breast cancer. Cancer Sci. 2016;107(7):916–23. doi: 10.1111/cas.12952. [DOI] [PMC free article] [PubMed] [Google Scholar]
- 41.Kong X, Li G, Yuan Y, et al. MicroRNA-7 inhibits epithelial-to-mesenchymal transition and metastasis of breast cancer cells via targeting FAK expression. PLoS One. 2012;7(8):e41523. doi: 10.1371/journal.pone.0041523. [DOI] [PMC free article] [PubMed] [Google Scholar]
- 42.Zhao S, Chang SL, Linderman JJ, et al. A comprehensive analysis of CXCL12 isoforms in breast cancer. Transl Oncol. 2014 doi: 10.1016/j.tranon.2014.04.001. [Epub ahead of print] [DOI] [PMC free article] [PubMed] [Google Scholar]
- 43.Furuya K, Sasaki A, Tsunoda Y, et al. Eribulin upregulates miR-195 expression and downregulates Wnt3a expression in non-basal-like type of triple-negative breast cancer cell MDA-MB-231. Hum Cell. 2016;29(2):76–82. doi: 10.1007/s13577-015-0126-2. [DOI] [PubMed] [Google Scholar]
- 44.Han W, Carpenter RL, Cao X, Lo HW. STAT1 gene expression is enhanced by nuclear EGFR and HER2 via cooperation with STAT3. Mol Carcinog. 2013;52(12):959–69. doi: 10.1002/mc.21936. [DOI] [PMC free article] [PubMed] [Google Scholar]
- 45.Liu HC, Ma F, Shen Y, et al. Overexpression of SMAR1 enhances radiosensitivity in human breast cancer cell line MCF7 via activation of p53 signaling pathway. Oncol Res. 2014;22(5–6):293–300. doi: 10.3727/096504015X14424348426035. [DOI] [PMC free article] [PubMed] [Google Scholar]


