

Abstract
Objective
To investigate if beer, liquor (spirits), wine and total alcohol intakes have different associations with serum urate (SU) concentrations at different ages in a cohort of young men and women.
Methods
Data from 3123 participants at baseline and follow-up at 20 years were used, with balanced proportions of Caucasians and African Americans. The relationships of SU with categories of beer, liquor, wine and total alcohol intake referent to no intake were examined in sex-specific, cross-sectional analyses.
Results
Mean age (SD) at the beginning of follow-up was 25.1 (3.6) years. Compared with non-drinkers, significant associations between higher SU concentrations and greater beer intake were observed among men and women, with more pronounced and consistent associations for women. An association between greater liquor intake and higher SU concentrations was only seen for men at the year 20 evaluation. Wine intake was not associated with SU in either sex and total alcohol was associated with higher SU concentrations in both men and women. The magnitude of the associations between alcoholic beverages intake and SU was modest (≤0.03 mg/dl/alcoholic beverage serving).
Conclusion
An association between higher SU concentrations and greater beer intake was consistent and pronounced among women, but also present in men. Despite the small magnitude of the increases in SU associated with alcohol intake, clinical implications in conditions such as cardiovascular disease and gout in young adults who are moderate and heavy drinkers cannot be ruled out.
Hyperuricaemia is the metabolic precursor of gout and has been associated with hypertension, renal disease and the metabolic syndrome.1–3 A strong relationship between hyperuricaemia and alcohol intake has been noted since gout was first described in the medical literature.4–6
The mechanisms by which alcohol induces an increase in serum urate (SU) are through increased production and decreased renal excretion.7 However, the effects may vary depending on the type of alcoholic beverage consumed. In the case of beer its high purine content and an increased production of urate induced by ethanol may have a role.8–10 The biochemical effects of other alcoholic beverages on SU are less well understood. Non-alcoholic components in wine, such as polyphenols, may possibly attenuate a significant increase in SU.11
Choi and Curhan using data from the US Third National Health and Nutritional Examination Survey (NHANES III) described the associations of different alcoholic beverages with SU. They concluded that both beer and liquor (spirits) intake were associated with increases in SU, while moderate intake of wine was not. Interestingly, their results showed that increases in SU with beer intake were more pronounced for women than for men.12 Given the effects of oestrogen on SU metabolism and excretion, there is biological plausibility for these preliminary findings.13–15 Using data from the Nutrition and Health Survey in Taiwan, Yu et al also reported an independent association between beer intake and hyperuricaemia.16 These epidemiological findings were supported by experimental data reporting a stronger effect of beer, compared with other alcoholic beverages, in increasing SU concentrations.8–10 The populations of large epidemiological studies that have examined this problem have been predominately middle-aged Caucasians. There is an incomplete knowledge whether these putative associations between different alcoholic beverages and urate levels vary by age and sex.
The objective of this study was to determine the differential relationship between alcoholic beverages (beer, wine and liquor) along with total alcohol intake, sex and SU in young and middle-aged subjects within a cohort of Caucasians and African Americans.
METHODS
Study population
Study subjects were from the Coronary Artery Risk Development in Young Adults (CARDIA) cohort that completed at least 20 years of observation. The CARDIA cohort was established in 1985–6 with the main objective of investigating factors that contribute to the development of coronary heart disease in young adults.17 Study design, recruitment of participants and the institutional review board approvals with individual informed consent processes have been described in detail earlier.18 Briefly, 5115 subjects, 18–30 years of age, were initially recruited in the US cities of Birmingham, Chicago, Minneapolis and Oakland. The sample was selected so there would be approximately equal numbers of African Americans and Caucasians. After 20 years of follow-up, a majority of those enrolled continued participating (72% at year 20).19 For the purpose of our analyses, only those individuals with SU measurements both at years 0 and 20 of cohort follow-up were included (n=3123).
SU measurement
At year 0, SU measurements were made by the uricase method. In year 20, a modification of this method was used in which urate was oxidised by uricase to peroxide (measured as part of the Young Adult Longitudinal Trends in Antioxidants ancillary study).20 To measure urate concentrations in serum with the Roche/Hitachi Modular P chemistry analyser, the urate in the sample was first oxidised by uricase, followed by peroxidase in the presence of 4-aminophenazone to produce a coloured product measured at 546 nm. The amount of the product was directly proportional to the amount of urate in the sample. To allow full comparability of urate measures from these two time points and conform to National Institute of Standards Standard Reference Materials, year 20 SU levels were recalibrated based on a re-run of 200 frozen samples.
Assessment of alcoholic beverage type and quantity
Alcohol consumption and specific alcoholic beverage intake were measured in all CARDIA examinations. Participants were asked, “Did you drink any alcoholic beverages in the past year?” and if the answer was yes, three questions followed about how many servings of wine (one serving equal to a 5 ounce glass or approximately 148 ml), beer (one serving equal to a 12 ounce or approximately 355 ml bottle or can) and liquor (one serving equal to a 1.5 ounce or approximately 44 ml shot) they usually consumed every week. Total alcohol intake in millilitres per day was estimated from the answers about individual alcoholic beverages using the formula: ((beer servings/week×16.7)+(wine servings/week×17.02)+(liquor servings/week×19.09))/7.19 The number of servings per day was estimated by dividing the number of millilitres per day by 17.24.21 This number was multiplied by 7 to estimate the amount of total alcohol servings per week.
Other factors potentially influencing associations
To account for factors that might confound the association between alcohol intake and SU we examined the following covariates: age at inception, sex, race, body mass index (BMI), renal function (serum creatinine), and use of drugs known to affect SU concentration (diuretics and urate-lowering drugs) or that are markers for a diagnosis of hypertension (antihypertensive agents).
We also included selected CARDIA dietary variables measured through the administration of the CARDIA diet history at years 0 and 20 as covariates.22 Details about the methodology, validity and reliability of the CARDIA diet history have been published elsewhere.23–25 Average protein intake along with daily servings of meat, seafood and dairy were used. Nutrient (protein) and food group (meat, seafood, dairy) information were included in the same models without fear of overadjusting, given published evidence of differential effects on SU.26 For individual analysis of each alcoholic beverage (beer, wine or liquor), intakes of the other two were included as covariates.
Statistical analyses
Sex-specific analyses were performed to investigate the association between alcohol intake and SU with two separate cross-sectional analyses at years 0 and 20.
The characteristics of the populations of men and women studied at years 0 and 20 were compared using paired t test analyses, χ2 tests, Wilcoxon signed rank tests or McNemar tests depending on the nature and distribution of the variables described. This was done to determine if there were any differences that might add information to explain the findings obtained in subsequent analyses. For the cross-sectional analyses a multiple linear regression was performed, in which the independent variables (beer, liquor, wine and total alcohol intakes) were divided into three categories according to the number of servings consumed: none (referent category), lower and middle tertiles among drinkers (aggregated together as one category, up to six servings per week for beer, up to three servings per week for liquor and wine) and upper tertile among drinkers. We selected these categories to allow for sufficient numbers of individuals in each group. For intake of total alcohol, the cut-off point between the middle and upper tertiles was defined at 19/ml day of intake; but we instead selected a more convenient cut point of 17.24 ml/day (equivalent to seven servings/week). The estimated difference in SU, compared with the referent group was the dependent variable in the models. All continuous covariates were kept continuous in the models. Age at inception, race and those covariates with p values of ≤0.20 in the initial bivariate analyses (without carrying out adjustments for multiple comparisons) were included in the subsequent multivariable models. An additional analysis in which the different forms of alcoholic beverage intakes were also considered as continuous variables was also performed to assess the effect of individual alcohol servings on SU. Observations with missing values for any of the covariates were excluded. SAS Statistical software version 9.1.3 (SAS Institute, Cary, North Carolina, USA) was used for this analysis.
RESULTS
Characteristics of the study population
A comparison of the included population at years 0 and 20 is presented in table 1. The BMI, SU, intake of meat and seafood and proportions of patients taking antihypertensive drugs and diuretic agents increased significantly in men and women from year 0 to year 20. In contrast, average serum creatinine levels, intake of dairy and total protein significantly decreased in both sexes from year 0 to year 20. The baseline characteristics of the subjects included in the final analyses differed significantly from those excluded by being older at baseline and more likely to be women or Caucasians. Additionally, subjects included had lower BMI and consumed less meat, dairy and protein than the CARDIA participants excluded. Since there were large proportions of nondrinkers across all alcoholic beverage types and at both CARDIA examinations, median values of alcohol intake were close to 0.
Table 1.
Characteristics of CARDIA participants evaluated at baseline (1985–6) and year 20 (n = 3123), stratified by sex
| Variable | Men (n=1380)
|
Women (n=1743)
|
||||
|---|---|---|---|---|---|---|
| Year 0 | Year 20 | p* | Year 0 | Year 20 | p* | |
| Age (years)† | 25.1 ± 3.5 | 45.1 ± 3.5 | NA | 25.0 ± 3.7 | 45.0 ± 3.7 | NA |
| Race (%) | ||||||
| Caucasian | 59.7 | NA | 51.9 | NA | ||
| African American | 40.3 | 48.1 | ||||
| BMI (kg/m2)† | 24.4 ± 3.9 | 28.9 ± 5.6 | <0.001 | 24.3 ± 5.4 | 29.7 ± 7.7 | <0.001 |
| Serum creatinine (mg/dl)† | 1.2 ± 0.4 | 1.0 ± 0.4 | <0.001 | 0.9 ± 0.1 | 0.8 ± 0.2 | <0.001 |
| Serum urate (mg/dl)† | 6.2 ± 1.2 | 6.6 ± 1.3 | <0.001 | 4.5 ± 1.0 | 5.0 ± 1.2 | <0.001 |
| Medication use (%)‡ | ||||||
| Antihypertensive drugs | 0.9 | 13.0 | 0.01 | 1.2 | 12.7 | <0.001 |
| Diuretics | 0.7 | 6.2 | 0.02 | 1.4 | 11.7 | 0.02 |
| Urate-lowering | 0.1 | 0.4 | 0.99 | 0 | 0 | 1.0 |
| Daily dietary intake | ||||||
| Meat (servings/day)§¶ | 3.8 (2.5–6.0) | 4.5 (3.0–6.7) | <0.001 | 2.2 (1.3–3.7) | 2.9 (1.9–4.3) | <0.001 |
| Dairy (servings/day)§¶ | 4.3 (2.3–7.2) | 3.1 (1.6–5.4) | <0.001 | 3.0 (1.6–4.9) | 2.4 (1.3–4.3) | <0.001 |
| Seafood (servings/day)§¶ | 0.4 (0.1–0.9) | 0.8 (0.3–1.7) | <0.001 | 0.3 (0.1–0.7) | 0.7 (0.3–1.4) | <0.001 |
| Protein (g/day)† | 129.3 ± 69.4 | 106.7 ± 51.1 | <0.001 | 84.3 ± 40.1 | 78.6 ± 36.6 | <0.001 |
| Alcoholic beverage intake | ||||||
| Beer (servings/week)¶** | 2 (0–6) | 1 (0–5) | <0.001 | 0 (0–1) | 0 (0–1) | <0.001 |
| Liquor (servings/week)¶** | 0 (0–1) | 0 (0–1) | 0.62 | 0 (0) | 0 (0) | 0.73 |
| Wine (servings/week)¶** | 0 (0–1) | 0 (0–2) | <0.001 | 0 (0–1) | 0 (0–2) | <0.001 |
| Total alcohol (servings/week)¶** | 4.2 (0–9.8) | 2.1 (0–7.1) | <0.001 | 0.7 (0–4.2) | 0 (0–4.2) | 0.4 |
| Total alcohol intake composition (%)†† | <0.001 | <0.001 | ||||
| Beer | 78.6 | 56.7 | 69.3 | 41.3 | ||
| Liquor (spirits) | 16.1 | 21.8 | 19.8 | 26.6 | ||
| Wine | 5.3 | 21.5 | 10.9 | 32.1 | ||
For difference between year 20 and year 0 evaluations.
Mean ± SD, differences between year 20 and year 0 calculated using the paired t test for means.
Antihypertensive agent category does not include diuretic agents. Differences between year 20 and year 0 calculated using the χ2 test
One meat and seafood servings are equal to 1 ounce (approximately 28 g). One serving of dairy varied according to the composition: for milk is equal to 1 cup or 8 fluid ounces (approximately 237 ml). For cheese a serving is 2 ounces for processed (approximately 54 g), two cups for cottage (approximately 574 ml) and three cups for dry curd (approximately 710 ml). For yogurt it is one cup (approximately 237 ml) and for ice cream is 1/2 cup (approximately 118 ml).
Median numbers (IQR) used given non-normal distributions. Differences between year 20 and year 0 calculated using the Wilcoxon signed rank test.
One serving of beer is equal to a 12 ounce bottle (approximately 355 ml), one serving of liquor is equal to a 1.5 ounce shot (approximately 44 ml), one serving of wine is equal to a 5 ounce glass (approximately 148 ml), one serving of alcohol is equal to 17.24 ml.
Percentage based on servings/week among alcohol drinkers. Differences tested using McNemar test for proportions.
BMI, body mass index; NA, not applicable because of no variation or no relevance.
Cross-sectional association of alcoholic beverage intake with SU for men and women
Bivariate associations of the different categories of alcoholic beverage intake and the studied covariates with SU are shown in table 2. Significant dose-dependent associations with SU were evident for women who drank beer, liquor and total alcohol at the year 0 evaluation and men who drank liquor at the year 20 evaluation. The associations between other alcoholic beverages and SU were for the most part non-significant. Race showed an association with changes in SU, as being African American was associated with a decrease in SU compared with Caucasians at baseline examination and with an increase in SU only among women at year 20 examination. BMI, serum creatinine and diuretic use were consistently associated with increases in SU in both examinations in men and women. Antihypertensive drug use and meat intake showed a similar consistent association with increases in SU only among women. When the diuretic and antihypertensive drug use variables where added to the models of association between alcohol intake and SU, they weakened the association between any alcoholic beverage intake and SU increases. The opposite effect was noted for the BMI variables that uniformly accentuated the positive associations of alcohol intake categories with SU increases.
Table 2.
Bivariate cross-sectional difference in serum urate (in mg/dl) predicted by alcoholic beverage intake category and studied covariates
| Variable | Men (n=1380)
|
Women (n=1743)
|
||||||
|---|---|---|---|---|---|---|---|---|
| Year 0 | p | Year 20 | p | Year 0 | p | Year 20 | p | |
| Beer*† | ||||||||
| 0.1–6 Servings/week | 0.03 | 0.64 | 0.01 | 0.89 | 0.21 | 0.001 | −0.06 | 0.46 |
| >6 Servings/week | 0.27 | 0.002 | 0.11 | 0.33 | 0.44 | <0.001 | 0.03 | 0.34 |
| Liquor (spirits)*† | ||||||||
| 0.1–3 Servings/week | 0.08 | 0.31 | 0.23 | 0.02 | 0.15 | 0.02 | 0.06 | 0.51 |
| >3 Servings/week | 0.29 | 0.004 | 0.52 | <0.0001 | 0.39 | 0.0005 | 0.17 | 0.20 |
| Wine* | ||||||||
| 0.1–3 Servings/week | 0.07 | 0.35 | 0.03 | 0.73 | −0.01 | 0.85 | −0.23 | 0.003 |
| >3 Servings/week | 0.12 | 0.40 | 0.08 | 0.45 | 0.07 | 0.46 | −0.14 | 0.11 |
| Total alcohol* | ||||||||
| 0.1–7 Servings/week | 0.05 | 0.51 | −0.08 | 0.37 | 0.12 | 0.02 | −0.21 | 0.001 |
| >7 Servings/week | 0.27 | 0.0009 | 0.20 | 0.03 | 0.31 | <0.0001 | −0.02 | 0.84 |
| Age at enrolment (per year) | 0.001 | 0.90 | 0.02 | 0.09 | 0.004 | 0.49 | 0.03 | <0.0001 |
| African-American race‡ | −0.20 | 0.001 | 0.10 | 0.15 | −0.13 | 0.005 | 0.38 | <0.0001 |
| BMI (per extra kg/m2) | 0.09 | <0.0001 | 0.07 | <0.0001 | 0.05 | <0.0001 | 0.06 | <0.0001 |
| Serum creatinine (per extra mg/dl) | 0.25 | 0.0007 | 0.20 | 0.02 | 1.43 | <0.0001 | 0.75 | <0.0001 |
| Antihypertensive drug use§ | 0.52 | 0.13 | 0.77 | <0.0001 | 0.04 | 0.83 | 1.0 | <0.0001 |
| Diuretic drug use | 1.09 | 0.003 | 1.28 | <0.0001 | 0.48 | 0.02 | 1.30 | <0.0001 |
| Urate-lowering medication use | −0.36 | 0.76 | 1.04 | 0.05 | NA | NA | NA | NA |
| Daily dietary intake | ||||||||
| Meat¶ | 0.003 | 0.73 | 0.02 | 0.03 | 0.007 | 0.45 | 0.06 | <0.001 |
| Dairy¶ | −0.01 | 0.03 | −0.01 | 0.10 | −0.01 | 0.11 | −0.03 | 0.008 |
| Seafood¶ | 0.01 | 0.72 | 0.04 | 0.03 | −0.007 | 0.84 | 0.03 | 0.24 |
| Protein (per additional 100 g) | −0.09 | 0.06 | −0.06 | 0.41 | −0.04 | 0.45 | 0.03 | 0.70 |
Change in serum urate per category of intake compared with reference of non-drinkers.
One serving of beer is equal to a 12 ounce bottle (approximately 355 ml), one serving of liquor is equal to a 1.5 ounce shot (approximately 44 ml), one serving of wine is equal to a 5 ounce glass (approximately 148 ml), one serving of alcohol is equal to 17.24 ml.
Compared with Caucasians as reference. Only African Americans and Caucasians were included in the CARDIA cohort. §Excludes diuretic agents.
Per additional serving/day.
BMI, body mass index; NA, not applicable.
The multivariable associations of the categories of alcoholic beverage intake and SU are shown in the figure 1. Dose-dependent increases in SU are noted in association with beer and total alcohol intake in both men and women, and with liquor intake only in men. The association of beer with increases in SU in men was significant only in the higher category of intake (at a median of 12 servings/week). Women at the year 0 evaluation had significant increases in SU at all categories of intake, as opposed to women at year 20 evaluation who had it only in the higher category of intake. The increases in SU associated with beer intake were more pronounced for women than for men at equivalent median consumptions.
Figure 1.
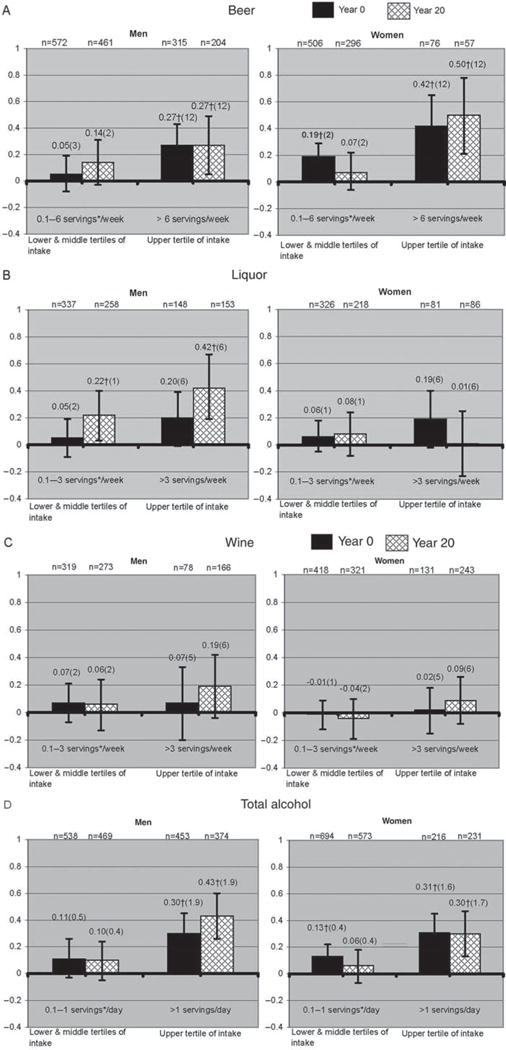
Multivariable adjusted predicted serum urate difference (in mg/dl) associated with categories of alcoholic beverage intake ((A) beer; (B) liquor (spirits); (C) wine; (D) total alcohol) and compared with the referent group of non-drinkers. Numbers above the error bars represent the exact serum urate difference with non-drinkers, numbers in parentheses represent the median alcoholic beverage intake for each category in servings per week. Years 0 and 20 multivariable modelling in both men and women was adjusted for age at inception, race, body mass index, serum creatinine, diuretic drug use and daily dairy intake. Antihypertensive drug use was added to all models in men and in women only at year 20. Meat and seafood intake was added to both men and women year 20 models and protein intake only for men at year 0. *One serving of beer is equal to a 12-ounce bottle (approximately 355 ml), one serving of liquor is equal to a 1.5 ounce shot (approximately 44 ml), one serving of wine is equal to a 5 ounce glass (approximately 148 ml), one serving of alcohol is equal to 17.24 ml. †Significantly different from non-drinkers (p<0.05).
An association between significantly higher SU concentrations with liquor intake was evident only in men at the year 20 evaluation. No significant associations were noted between liquor intake and SU among women or SU for either men or women with wine intake. Men and women in higher total alcohol intake categories had significantly higher SU than nondrinkers.
The absolute effect of the association between individual servings of alcohol on SU was small. The strongest association was noted for a maximum additional SU of 0.03 mg/dl per each additional weekly serving of beer in women examined at year 20. However, a significant interaction between sex and beer intake was found, with a more pronounced increase in SU among women than men with equivalent levels of beer intake. There were no interactions between sex and liquor or wine intake.
DISCUSSION
In this cohort of young Caucasians and African Americans we found a consistent association between beer and total alcohol intakes in the upper tertiles with higher SU levels in men and women. These associations were stronger in women than in men. Smaller intakes of beer and total alcohol had less robust and for the most part non-significant associations with larger concentrations of SU.
Our findings have similarities to, and differences from, the results from other large epidemiological studies on the association of alcohol intake with SU. Choi and Curhan and Yu et al described associations between increasing intake of beer and greater SU concentrations.12,16 Choi and Curhan also described a significant effect of liquor intake on SU, but found no effect of wine. Our findings were consistent with their results with respect to the effect of beer and wine but differed with regard to liquor, where we found an association and dose dependency only among men at the year 20 evaluation. In addition, we describe a stronger and consistent association between beer drinking and SU in women that is present in a younger population with a mean age of 25 years. Although there is no known biological explanation for these findings, we hypothesise that a loss of the more efficient renal uric acid excretion induced by oestrogen might have a role.13,14 The lack of association between wine intake and higher levels of SU or incident gout has been a consistent finding in epidemiological studies.12,27 However, despite careful epidemiological covariate adjustment, it is possible that residual confounding masks an association of wine with changes in SU.
An important difference between our population and those in previous studies is the mean age of study participants. Choi and Curhan and Yu et al examined people with a mean age of approximately 44 years. Our population at the first cross-sectional analysis was only 25 years of age on average, but had a similar mean age to subjects in the other studies by the time of the second cross-sectional analysis 20 years later. This allowed us to compare the effects of alcohol on SU at different ages. The effect of individual servings of beer, liquor or wine on SU in our study was significant only for women beer drinkers. However, the effect was of small magnitude, and unlikely to be clinically relevant for gout in premenopausal women. The increases in SU attributable to an association with alcohol intake among men were also very small, but because men have SU levels that are closer to the urate saturation threshold (of 6.8 mg/dl28) even small increases may be relevant for incident gout. Our population included fewer than 80 people who self-reported gout, so these findings apply primarily to those not diagnosed with this condition as it is likely that purine overproduction induced by alcoholic beverages translate into larger SU increases in uric acid under-excretors. The small SU increases induced by certain forms of alcohol intake could prove important at a population level, given data linking changes in SU with cardiovascular outcomes, renal function and the metabolic syndrome.29–32 Since our higher categories of intake are at or below the range defined as ‘moderate drinking’ by the US Dietary Guidelines for alcoholic beverages33 it is possible that any cardiovascular deleterious effect induced by hyperuricaemia as a consequence of alcoholic beverage intake would be compensated by the benefits attributed to moderate alcohol drinking,34 although it is important to notice that these benefits have been mainly reported in older adults.35
Being African American was associated with lower concentrations of SU at the baseline examination of men and women. This has not been previously reported and this finding could only be considered hypothesis generating. On the other hand, being African American was associated with higher concentrations of SU among women, as previously reported for populations of this age.36 In addition, BMI was itself strongly associated with SU in the bivariate analysis and consistent with previous reports it affected the association between alcohol intake and SU in the multivariate analysis.12 This supports the notion that the effect of alcohol intake on SU should be stronger as BMI increases.
Our study has both strengths and limitations. It was performed in a well-established cohort with an important representation of African Americans. As a consequence, the findings are likely to be generalisable to similar populations with important proportions of individuals with African ancestry. The opportunity to study the population at different time points allowed us to analyse the effect of the exposure on SU at different ages with cross-sectional and longitudinal designs and to compare our results with previous studies in middle-aged adults. On the other hand, we lacked information about individuals with heavy alcohol intake, thus our findings are not applicable to heavier drinkers than our upper intake categories. Given the nature of cross-sectional analyses, it was impossible to gauge the direction of the exposure–effect relationships in those analyses. However, it is unlikely that a significant proportion of this young population changed their alcohol intake patterns because of a previously diagnosed hyperuricaemia or gout. Finally, a proportion of individuals might have inaccurately estimated their alcoholic beverage intakes.
In conclusion, we found a consistent dose-dependent association between higher SU concentrations and higher beer intake among women in a large US cohort. This association was also present in men but was neither as strong nor as consistent. An association of SU with liquor intake was significant only among men at the year 20 evaluation. Wine did not show an association with changes in SU for either men or women. The association of total alcohol intake with changes in SU seemed to be driven by the alcoholic beverage composition of the intake. The increases in SU associated with different forms of alcohol intake were of small magnitude and by themselves unlikely to affect the risk for gout. Increases in SU induced by alcohol intake are expected to be of higher magnitude when associated with other factors known to affect SU concentrations, such as weight, renal function and diuretic use. These findings do not apply to subjects with gout, as large proportions of them have impaired SU excretion.
The effect of the association between alcohol intake and SU on cardiovascular disease is difficult to predict because of the incompletely understood effects of both alcohol intake and SU on cardiovascular events. For men and women, moderation of certain types of alcohol beverage intake starting at an early age might be one of the factors lowering the future burden of gout and other urate-associated morbidities.
Footnotes
Competing interests KGS has served as consultant for Takeda and Savient.
Provenance and peer review Not commissioned; externally peer reviewed.
References
- 1.Ford ES, Giles WH. findings from the third National Health and Nutrition Examination Survey. JAMA. 2002;287:356–9. doi: 10.1001/jama.287.3.356. [DOI] [PubMed] [Google Scholar]
- 2.Kang DH, Nakagawa T, Feng L, et al. A role for uric acid in the progression of renal disease. J Am Soc Nephrol. 2002;13:2888–97. doi: 10.1097/01.asn.0000034910.58454.fd. [DOI] [PubMed] [Google Scholar]
- 3.Masuo K, Kawaguchi H, Mikami H, et al. Serum uric acid and plasma norepinephrine concentrations predict subsequent weight gain and blood pressure elevation. Hypertension. 2003;42:474–80. doi: 10.1161/01.HYP.0000091371.53502.D3. [DOI] [PubMed] [Google Scholar]
- 4.Delbarre F, Auscher C, Brouilhet H, et al. The action of ethanol in gout and on the metabolism of uric acid. Sem Hop. 1967;43:659–64. [PubMed] [Google Scholar]
- 5.Lieber CS. Hyperuricemia induced by alcohol. Arthritis Rheum. 1965;8:786–98. doi: 10.1002/art.1780080442. [DOI] [PubMed] [Google Scholar]
- 6.Maclachlan MJ, Rodnan GP. Effect of food, fast and alcohol on serum uric acid and acute attacks of gout. Am J Med. 1967;42:38–57. doi: 10.1016/0002-9343(67)90005-8. [DOI] [PubMed] [Google Scholar]
- 7.Yamamoto T, Moriwaki Y, Takahashi S. Effect of ethanol on metabolism of purine bases (hypoxanthine, xanthine, and uric acid) Clin Chim Acta. 2005;356:35–57. doi: 10.1016/j.cccn.2005.01.024. [DOI] [PubMed] [Google Scholar]
- 8.Gibson T, Rodgers AV, Simmonds HA, et al. Beer drinking and its effect on uric acid. Br J Rheumatol. 1984;23:203–9. doi: 10.1093/rheumatology/23.3.203. [DOI] [PubMed] [Google Scholar]
- 9.Ka T, Moriwaki Y, Takahashi S, et al. Effects of long-term beer ingestion on plasma concentrations and urinary excretion of purine bases. Horm Metab Res. 2005;37:641–5. doi: 10.1055/s-2005-870540. [DOI] [PubMed] [Google Scholar]
- 10.Yamamoto T, Moriwaki Y, Takahashi S, et al. Effect of beer on the plasma concentrations of uridine and purine bases. Metab Clin Exp. 2002;51:1317–23. doi: 10.1053/meta.2002.34041. [DOI] [PubMed] [Google Scholar]
- 11.Maxwell S, Cruickshank A, Thorpe G. Red wine and antioxidant activity in serum. Lancet. 1994;344:193–4. doi: 10.1016/s0140-6736(94)92795-2. [DOI] [PubMed] [Google Scholar]
- 12.Choi HK, Curhan G. Beer, liquor, and wine consumption and serum uric acid level: the Third National Health and Nutrition Examination Survey. Arthritis Rheum. 2004;51:1023–9. doi: 10.1002/art.20821. [DOI] [PubMed] [Google Scholar]
- 13.Adamopoulos D, Vlassopoulos C, Seitanides B, et al. The relationship of sex steroids to uric acid levels in plasma and urine. Acta Endocrinol. 1977;85:198–208. doi: 10.1530/acta.0.0850198. [DOI] [PubMed] [Google Scholar]
- 14.Nicholls A, Snaith ML, Scott JT. Effect of oestrogen therapy on plasma and urinary levels of uric acid. Br Med J. 1973;1:449–51. doi: 10.1136/bmj.1.5851.449. [DOI] [PMC free article] [PubMed] [Google Scholar]
- 15.Sumino H, Ichikawa S, Kanda T, et al. Reduction of serum uric acid by hormone replacement therapy in postmenopausal women with hyperuricaemia. Lancet. 1999;354:650. doi: 10.1016/S0140-6736(99)92381-4. [DOI] [PubMed] [Google Scholar]
- 16.Yu KH, See LC, Huang YC, et al. Dietary factors associated with hyperuricemia in adults. Semin Arthritis Rheum. 2008;37:243–50. doi: 10.1016/j.semarthrit.2007.04.007. [DOI] [PubMed] [Google Scholar]
- 17.Friedman GD, Cutter GR, Donahue RP, et al. study design, recruitment, and some characteristics of the examined subjects. J Clin Epidemiol. 1988;41:1105–16. doi: 10.1016/0895-4356(88)90080-7. [DOI] [PubMed] [Google Scholar]
- 18.Cutter GR, Burke GL, Dyer AR, et al. Cardiovascular risk factors in young adults. The CARDIA baseline monograph. Control Clin Trials. 1991;2(1 Suppl):1S–77S. doi: 10.1016/0197-2456(91)90002-4. [DOI] [PubMed] [Google Scholar]
- 19.University of Alabama at Birmingham, Division of Preventive Medicine. http://www.cardia.dopm.uab.edu/o_brde.htm (Accessed 13 November 2009)
- 20.Hozawa A, Jacobs DR, Jr, Steffes MW, et al. oxidative stress, and endothelial dysfunction: the Coronary Artery Risk Development in Young Adults (CARDIA)/Young Adult Longitudinal Trends in Antioxidants (YALTA) study. Clin Chem. 2007;53:447–55. doi: 10.1373/clinchem.2006.074930. [DOI] [PMC free article] [PubMed] [Google Scholar]
- 21.Pletcher MJ, Varosy P, Kiefe CI, et al. binge drinking, and early coronary calcification: findings from the Coronary Artery Risk Development in Young Adults (CARDIA) Study. Am J Epidemiol. 2005;161:423–33. doi: 10.1093/aje/kwi062. [DOI] [PubMed] [Google Scholar]
- 22.Cade J, Thompson R, Burley V, et al. Development, validation and utilisation of food-frequency questionnaires – a review. Public Health Nutr. 2002;5:567–87. doi: 10.1079/PHN2001318. [DOI] [PubMed] [Google Scholar]
- 23.Hilner JE, McDonald A, Van Horn L, et al. Quality control of dietary data collection in the CARDIA study. Control Clin Trials. 1992;13:156–69. doi: 10.1016/0197-2456(92)90021-q. [DOI] [PubMed] [Google Scholar]
- 24.Liu K, Slattery M, Jacobs D, Jr, et al. A study of the reliability and comparative validity of the cardia dietary history. Ethn Dis. 1994;4:15–27. [PubMed] [Google Scholar]
- 25.McDonald A, Van Horn L, Slattery M, et al. development, implementation, and evaluation. J Am Diet Assoc. 1991;91:1104–12. [PubMed] [Google Scholar]
- 26.Choi HK, Liu S, Curhan G. Intake of purine-rich foods, protein, and dairy products and relationship to serum levels of uric acid: the Third National Health and Nutrition Examination Survey. Arthritis Rheum. 2005;52:283–9. doi: 10.1002/art.20761. [DOI] [PubMed] [Google Scholar]
- 27.Choi HK, Atkinson K, Karlson EW, et al. Alcohol intake and risk of incident gout in men: a prospective study. Lancet. 2004;363:1277–81. doi: 10.1016/S0140-6736(04)16000-5. [DOI] [PubMed] [Google Scholar]
- 28.Becker MA, Koopman WJ, Moreland LW, editors. Arthritis and allied conditions: a textbook of rheumatology. 15. Philadelphia, Pennsylvania, USA: Lippincott Williams & Wilkins; 2005. p. 2304. [Google Scholar]
- 29.Obermayr RP, Temml C, Gutjahr G, et al. Elevated uric acid increases the risk for kidney disease. J Am Soc Nephrol. 2008;19:2407–13. doi: 10.1681/ASN.2008010080. [DOI] [PMC free article] [PubMed] [Google Scholar]
- 30.Onat A, Uyarel H, Hergenç G, et al. Serum uric acid is a determinant of metabolic syndrome in a population-based study. Am J Hypertens. 2006;19:1055–62. doi: 10.1016/j.amjhyper.2006.02.014. [DOI] [PubMed] [Google Scholar]
- 31.Strasak A, Ruttmann E, Brant L, et al. VHM&PP Study Group Serum uric acid and risk of cardiovascular mortality: a prospective long-term study of 83,683 Austrian men. Clin Chem. 2008;54:273–84. doi: 10.1373/clinchem.2007.094425. [DOI] [PubMed] [Google Scholar]
- 32.Strasak AM, Kelleher CC, Brant LJ, et al. VHM&PP Study Group Serum uric acid is an independent predictor for all major forms of cardiovascular death in 28,613 elderly women: a prospective 21-year follow-up study. Int J Cardiol. 2008;125:232–9. doi: 10.1016/j.ijcard.2007.11.094. [DOI] [PubMed] [Google Scholar]
- 33.US Department of Health and Human Services. doi: 10.3109/15360288.2015.1037530. http://www.health.gov/dietaryguidelines/dga2005/document/html/chapter9.htm. (Accessed 13 November 2009) [DOI] [PubMed]
- 34.Ferreira MP, Willoughby D. Alcohol consumption: the good, the bad, and the indifferent. Appl Physiol Nutr Metab. 2008;33:12–20. doi: 10.1139/H07-175. [DOI] [PubMed] [Google Scholar]
- 35.Ferreira MP, Weems MK. Alcohol consumption by aging adults in the United States: health benefits and detriments. J Am Diet Assoc. 2008;108:1668–76. doi: 10.1016/j.jada.2008.07.011. [DOI] [PubMed] [Google Scholar]
- 36.Fang J, Alderman MH. Serum uric acid and cardiovascular mortality the NHANES I epidemiologic follow-up study, 1971–1992. National Health and Nutrition Examination Survey. JAMA. 2000;283:2404–10. doi: 10.1001/jama.283.18.2404. [DOI] [PubMed] [Google Scholar]