
EXTENDED DATA FIGURE 1. Csf1r−/− mice lack microglia and have no compensatory increase in brain myeloid cell populations after LPS or vehicle control injections.
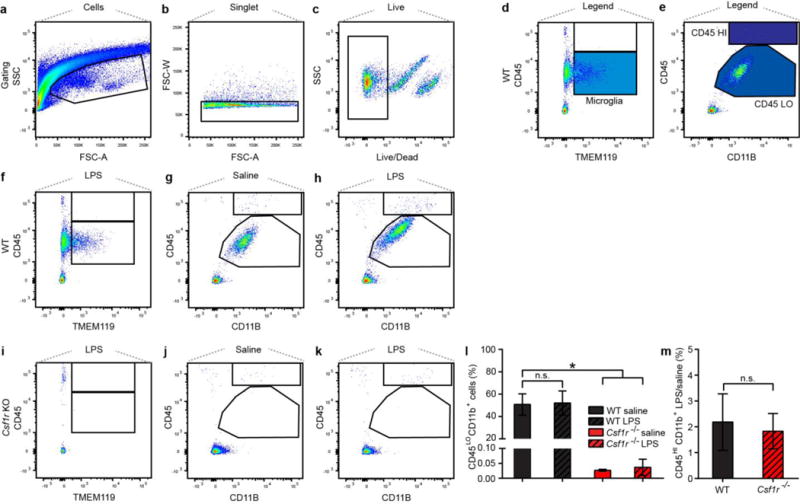
a–c, gating strategy (live, single cells) for subsequent analysis of surface protein immunostainng. d,e, gating strategy for TMEM119+ (microglia) and CD45L°CD11b+ cells used for further analysis. f–h, representative plots showing abundant macrophage populations in P8 WT mice: CD45L° TMEM119+/TMEM119-, and CD45HI brain macrophages (f), CD11B+/CD45L° and CD11B+/CD45HI cells after saline (g) and LPS (h) injection. i, representative plots showing near-complete absence of brain macrophages in Csf1r−/− mice: CD45L° TMEM119-/TMEM119-, and CD45HI brain macrophages (i), CD11B+/CD45L° and CD11B+/CD45HI cells after saline (j) and LPS (k) injection. l, relative abundance of CD11B+/CD45L° macrophages after LPS or control injection in WT compared to Csf1r−/− mice, expressed as percent of total gated events shown in a. m, relative abundance of CD11B+/CD45HI cells after LPS treatment, normalized to saline control injection in WT and Csf1r−/− animals. N = 3 individual animals per treatment condition and genotype, error bars expressed as s.e.m. * p < 0.05, one-way ANOVA (l); p = 0.77, Student’s T-test (m), compared to age-matched wild type control.