

Abstract
The genomic alterations identified in head and neck squamous cell carcinoma (HNSCC) tumors have not resulted in any changes in clinical care, making the development of biomarker-driven targeted therapy for HNSCC a major translational gap in knowledge. To fill this gap, we used 59 molecularly characterized HNSCC cell lines and found that mutations of AJUBA,SMAD4 and RAS predicted sensitivity and resistance to treatment with inhibitors of polo-like kinase 1 (PLK1), checkpoint kinases 1 and 2, and WEE1. Inhibition or knockdown of PLK1 led to cell-cycle arrest at the G2/M transition and apoptosis in sensitive cell lines and decreased tumor growth in an orthotopic AJUBA-mutant HNSCC mouse model. AJUBA protein expression was undetectable in most AJUBA-mutant HNSCC cell lines, and total PLK1 and Bora protein expression were decreased. Exogenous expression of wild-type AJUBA in an AJUBA-mutant cell line partially rescued the phenotype of PLK1 inhibitor-induced apoptosis and decreased PLK1 substrate inhibition, suggesting a threshold effect in which higher drug doses are required to affect PLK1 substrate inhibition. PLK1 inhibition was an effective therapy for HNSCC in vitro and in vivo. However, biomarkers to guide such therapy are lacking. We identified AJUBA, SMAD4 and RAS mutations as potential candidate biomarkers of response of HNSCC to treatment with these mitotic inhibitors.
Keywords: Polo-like kinase 1, Head neck squamous cell carcinoma, WEE1, CHK1, AJUBA
1. Introduction
Head and neck squamous cell carcinoma (HNSCC) is the seventh leading cause of cancer-related deaths globally, with more than 375,000 people dying of this cancer yearly [11, 19] and more than 54,000 new cases projected in the United States in 2015 [51, 59]. Despite the use of multimodal treatment strategies, the overall 5-year survival rate for HNSCC has not improved significantly over the past several decades [22]. To date, the genomic alterations identified in HNSCC cells have not resulted in any changes in clinical care or patient outcome despite extensive efforts to develop targeted molecular therapies to inhibit key signaling pathways involved in tumor growth and metastasis [43]. The major challenge in using genomic data to personalize treatment of HNSCC is that researchers have identified few specific oncogenic drivers that are responsive to currently available targeted therapy [4, 9, 54]. Thus, identifying novel biomarkers, mechanisms, and therapeutic targets that are relevant to HNSCC is urgently needed.
Potential therapeutic targets for HNSCC include proteins that affect mitosis and the DNA damage checkpoint. Proliferation is more active for many types of cancer cells than for normal cells [66]. Therefore, strategies to disrupt mitosis are promising approaches to cancer therapy [35]. Mitosis is a complex process and tightly controlled to ensure genetic integrity and appropriate cell proliferation. Mitotic failure results in genomic instability that may cause cell death. Likewise, abrogation of the DNA damage checkpoint may lead to mitotic catastrophe. A study of mitotic regulatory mechanisms identified several proteins that affect these processes as potential anticancer drug targets in HNSCC cells, including Polo-like kinase 1 (PLK1), checkpoint kinases 1 and 2 (CHK1/2), and WEE1 [66]. CHK1/2, PLK1, and WEE1 are protein kinases that play important roles in the regulation of cyclin-dependent kinase 1 (CDK1, CDC2), which is involved in G2/M checkpoint regulation by DNA damage by enabling cells to enter the mitotic phase of the cell cycle [24].
WEE1 selectively phosphorylates the Tyr15 residue of CDK1 and inactivates its activity, abrogating mitotic entry. Inhibition of WEE1 activity overrides the G2/M checkpoint, allowing cancer cells with DNA damage to undergo unscheduled mitosis that may lead to cell death [15]. AZD1775, a selective small-molecule inhibitor of WEE1, has broad effects on the survival of both primary and recurrent/metastatic derived TP53-mutant HNSCC cells by causing unscheduled mitotic entry, which results in mitotic catastrophe and apoptosis [25, 69]. Treatment with AZD1775 has selectively sensitized HNSCC cell lines to treatment with cisplatin both in vitro and in vivo based on their TP53 mutational statuses via abrogation of cell-cycle arrest at G2 phase and accumulation of cells harboring unrepaired DNA lesions in during mitosis. Combination therapy of cisplatin and AZD1775 led to aberrant mitosis of HNSCC cells associated with senescence rather than an apoptotic process [39, 42, 57].
Checkpoint signaling is initiated by genotoxic insult by the proximal kinases ATR and ATM, which subsequently activate CHK1 and CHK2, respectively. These kinases are critical enforcers of S- and G2/M-phase cell-cycle checkpoints, initiating cell-cycle arrest, DNA repair, and enhancing faithful DNA replication and cell survival [14]. AZD7762 is an ATP-competitive CHK1/2 inhibitor currently in clinical trials that abrogates the DNA damage-induced S- and G2-phase checkpoints and modulates downstream checkpoint pathway proteins [69]. Treatment with AZD7762 can sensitize TP53-knockdown or TP53-mutant HNSCC cells to cisplatin in vitro by overriding cell-cycle arrest induced by cisplatin. This culminates in forced mitosis, supporting treatment of TP53-mutant HNSCC with CHK1/2 inhibitors [21].
PLK1 is the best characterized of the five members of the PLK family. PLK1 activity is crucial for precise regulation of cell division. PLK1 has several roles during mitosis, including facilitating entry to mitosis by activating CDK1, as well as roles in centrosomal maturation, microtubule nucleation, chromosomal segregation, and cytokinesis [68]. PLK1 activity is mediated by its expression, phosphorylation, and sub-cellular localization. The expression and activity of PLK1 peak during mitosis, and its location shifts dramatically during mitosis corresponding to its distinct functions. PLK1 expression correlates negatively with survival of HNSCC [29, 30] and other solid tumors [65]. Investigators have developed several PLK1 inhibitors, with volasertib (BI6727) becoming the first to receive the U.S. Food and Drug Administration breakthrough therapy designation for acute myeloid leukemia. The effect of PLK1 inhibition on HNSCC is virtually unexplored, however, and biomarkers that predict response of cancer to this inhibition have yet to be identified. In one study, incubation of nine HNSCC cell lines with BI2536, a PLK1 inhibitor structurally similar to volasertib, in vitro demonstrated reduced cell numbers for all lines; also, the anti-tumor efficacy of treatment with docetaxel and cisplatin was enhanced by incubation with BI2536 in two HNSCC cell lines [62, 63].
To identify potential biomarkers of treatment response and effective therapies for HNSCC, we tested the response of 59 well-characterized HNSCC cell lines to treatment with the mitotic kinase inhibitors AZD1775, AZD7762, and volasertib. Moreover, to identify the mechanisms of sensitivity to these drugs we analyzed the correlation of gene expression, protein expression, and gene mutations with drug sensitivity. We discovered that HNSCC cells harboring AJUBA and SMAD4 mutations were more sensitive to these inhibitors, whereas those with RAS mutations were more resistant to them. We also confirmed the antitumor effects of PLK1 inhibition in vivo using an orthotopic mouse model of HNSCC. To demonstrate the function of AJUBA in drug resistance, we measured the sensitivity of AJUBA-mutant HNSCC cells lacking AJUBA expression to PLK1 inhibition using exogenous AJUBA expression which reduced PLK1 -inhibitor induced apoptosis.
2. Materials and methods
2.1. Materials
The PLK1 inhibitor volasertib, CHK1/2 inhibitor AZD7762, and WEE1 inhibitor AZD1775 were purchased from Selleck Chemicals and prepared as 10 mM stock solutions in dimethyl sulfoxide. Antibodies against phosphorylated Myt1 (Thr495) and Myt1 (Thermo Fisher Scientific); PLK1, poly(ADP-ribose) polymerase (46D11), phosphorylated translation controlled tumor protein (TCTP; Ser46), TCTP, cyclin B1, phosphorylated CDK1/CDC2 (Tyr15), CDK1/CDC2, phosphorylated histone H2A.X (Ser139), phosphorylated histone H3 (Ser10), Aurora A, phosphorylated Aurora A (Thr208), Bora, and β-actin (Cell Signaling Technology); and phosphorylated cdc25A (Thr506; Santa Cruz Biotechnology) were used for Western blotting. A predesigned mixture of four independent small interfering RNA (siRNA) sequences of the target PLK1 (siGENOME SMARTpool) and ON-TARGETplus nontargeting siRNA were purchased from Dharmacon.
2.2. Cell lines
A panel of 59 HNSCC cell lines was derived, authenticated using DNA fingerprinting and maintained as described previously [71]. This panel consisted of 9 human papillomavirus (HPV)-positive lines and 50 HPV-negative lines (Supplementary Table S1). The cell line UDSCC2 was a gift from J. Silvio Gutkind (University of California, San Diego), the cell line 93VU147T was a gift from Josephine Dorsman (Vrije Universiteit Medical Center), and the cell line UTSCC45 was a gift from Reidar Grénman (Turku University).
2.3. Whole exome sequencing
DNA from HNSCC cells was processed for sequencing as described previously [7]. In short, sheared DNA was captured using VCRome2.1 reagents (Roche NimbleGen) and sequenced using Illumina HiSeq 2000 sequencing instruments according to the manufacturer’s instructions. Paired-end DNA reads were aligned to hg19 using Burrows-Wheeler Aligner [32]. Duplicate reads were removed using a Picard tool [1]. GATK indel realignment, base quality score recalibration, and SNP and InDel discovery were applied according to GATK Best Practices recommendations [16, 37, 61]. The Variants were annotated using the ANNOVAR software program with corresponding databases for human hg19 [64]. Because germline DNA was not available for the cell lines, variant calls were further filtered to remove likely germline single-nucleotide polymorphisms and included probable somatic mutations based on their frequency among the cell lines, predicted functional impact, known hotspots, and presence in the dbSNP, 1000 Genomes Project, NHLBI Exome Sequencing Project, Catalogue Of Somatic Mutations In Cancer, and ClinVar databases. The 50 most common driver mutations in HNSCC cells were identified at the Firebrowse website (http://firebrowse.org) via MutSig 2CV v3.1 analysis (performed on January 28, 2016) [2]. All genes were statistically significant at q values less than 0.1 (Supplementary Table S2).
2.4. Protein and mRNA expression
RNA was isolated from the HNSCC cell lines using an RNeasy Plus mini Kit (QIAGEN). Illumina compatible RNA libraries were prepared using a TruSeq Stranded Total RNA Sample Prep Kit (Illumina). Briefly, 500 ng of DNase I-treated total RNA was depleted of ribosomal RNA using biotinylated, target-specific oligos. Following purification, the resulting RNA was fragmented using divalent cations, and first-strand cDNA synthesis was carried out using random primers. Following second-strand synthesis, the ends of the resulting double-stranded cDNA fragments were repaired, 5′-phosphorylated, and 3′ A-tailed. In addition, Illumina-specific Y-shaped indexed adapters were ligated. The products were then purified and enriched using polymerase chain reaction to create the final cDNA library. The libraries were quantified using quantitative polymerase chain reaction (Kapa Biosystems) assessed for size distribution using a bioanalyzer (Agilent Technologies), and multiplexed and sequenced using a HiSeq 3000 sequencer in 75-bp paired-end format (Illumina). Following sequencing, .bcl files were converted to .fastq.gz files, and individual sample libraries were demultiplexed using the CASAVA software program (version 1.8.2; Illumina) with no mismatches. Reverse-phase protein arrays were used to simultaneously evaluate the expression of 156 proteins from HNSCC cell lines as we described previously [20, 36].
2.5. Statistical analysis
Whole-exome and RNA sequencing data were available for all 59 cell lines. Reverse-phase protein array data were available for 57 of the cell lines. To identify differentially expressed features among the comparative groups, modified two-sample t-tests were applied using the limma software program. To identify correlated features in the comparative groups, Spearman correlation was applied using the Stats software program. The β-uniform mixture model described by Pounds and Morris [44] was used to control for the false-discovery rate (FDR). Drug sensitivity was compared with the mutational status for 13 known cancer-associated mutations as well as basal gene and protein expression in HNSCC cells using the Fisher exact test.
2.6. Cell viability assay
The 59 HNSCC cell lines were incubated with dimethyl sulfoxide (vehicle control), volasertib (Cmax, 1.2 μM) [46], AZD7762 (Cmax, 1.65 μM) [17], or AZD1775 (Cmax, 1.65 μM) [17] at seven concentrations ranging from 0.018 to 9.613 μM for 72 h. A CellTiter-Glo luminescent cell viability assay (Promega) was performed as per the manufacturer’s specifications to determine the effects of the drugs on HNSCC cell viability. For each cell line, six technical replicates were tested at each concentration, and at least two biological replicates were performed on different days. Half-maximal inhibitory concentration, 80% inhibitory concentration (IC80), and area under the curve (AUC) values for the drugs were estimated using a best-fit dose-response model selected according to the residual standard error using the R package drexplorer [58].
Given the lack of reproducibility of drug sensitivity screening with some cell lines [23], we applied stringent quality control measures to our data analysis that included both technical and biological replicates. The two criteria used were the concordance correlation coefficient (CCC) and standard deviation between the biological replicates. The cutoffs for reproducibility were a CCC greater than 0.8 or a maximum location shift of 0.9 based on manual review of a large set of in-house drug screening data and standard deviation less than 0.314 based on a normal mixture fit model. For experiments with very low variation in efficacy, location and scale parameters were used for quality control [33]. Failed experiments were repeated. The replicate with the smallest experimental variation measured by median of standard deviation was chosen as a representative of the replicates, and its inhibitory concentration values served as the final values for subsequent analysis.
2.7. Cell-cycle analysis and apoptosis assays
For cell-cycle analysis, HNSCC cells were harvested, fixed, incorporated with bromodeoxyuridine (BrdU), and stained with 7-aminoactinomycin D using a BrdU Flow Kit (BD Biosciences). The cells’ DNA content was analyzed using a cytofluorometer, a fluorescence-activated cell sorter (FACScan; Becton Dickinson), and the ModFit software program (Verity Software House). To measure apoptosis of the cells, terminal deoxynucleotidyl transferase dUTP nick-end labeling staining (APO-BrdU kit; BD Biosciences) of the cells was performed, and BrdU incorporation by the cells was quantitated using fluorescence-activated cell sorting with BrdU Flow Kits according to the manufacturer’s protocols.
2.8. Transfection
For siRNA transfection of HNSCC cells, cultured cells were plated in six-well (35-mm) plates; the cells were transfected the following day when they were 60–80% confluent using Lipofectamine RNAiMAX Reagent (Invitrogen) according to the manufacturer’s protocols. To establish stable AJUBA-overexpressing cell lines, PCI15B cells were eletroporated with a full-length AJUBA open reading frame cloned into pcDNA 3.1 (a gift from Dr. Darrell Irvine, Massachusetts Institute of Technology) or a vector alone as a control using Nucleofector buffer V (program U032, Amaxa Inc.). Transfected cells were selected in 1000 μg/ml G418 for 2 weeks and maintained in 200 μg/ml G418. AJUBA overexpression was confirmed using quantitative polymerase chain reaction and Western blot analysis.
2.9. Western blotting
Western blot analysis of HNSCC cells was performed as described previously [50]. In brief, cells were subjected to lysis on ice, and the lysates were centrifuged at 20,000× g for 10 min at 4 °C. Cell samples contain ing 30–50 μg of protein were resolved using sodium dodecyl sulfate-polyacrylamide gel electrophoresis and then transferred to nitrocellulose membranes, immunoblotted with different primary antibodies, and detected using a horseradish peroxidase-conjugated secondary antibody (Bio-Rad) and ECL reagent (Amersham Biosciences).
2.10. Cell-doubling times
HNSCC cells were serially diluted at densities ranging from 2500 cells/ml to 40,000 cells/ml and then seeded in a 384-well plate. Cells were then fixed, stained with 4′,6-diamidino-2-phenylindole or trypan blue, and counted every 24 h for 96 h. The cell-doubling times were calculated using the formula Td = 3*(LOG [2]/LOG [cell number at 96 h/cell number at 24 h]).
2.11. Orthotopic nude mouse model of HNSCC
An orthotopic nude mouse model of an oral squamous tongue tumor was established by injecting OSC19-luc cells (2.5 × 10⁵) suspended in 25 μl of serum-free Dulbecco’s modified Eagle’s medium into the tongues of mice as described previously [40, 49, 71]. Eight days after the cells were injected, the mice were randomly assigned to two groups given either a vehicle control or volasertib intravenously at 30 mg/kg weekly. All animal experiments were approved by The University of Texas MD Anderson Cancer Center Institutional Animal Care and Use Committee. The tumor sizes and weight loss in the mice were examined twice a week. The tumors were measured using microcalipers, and tumor volume was calculated using the formula: volume = (A)(B2) π/6 in which A is the longest dimension of the tumor and B is the dimension of the tumor perpendicular to A. Also, bioluminescent imaging was used to monitor orthotopic tumor growth in vivo. For this procedure, mice were anesthetized with 2% isoflurane, and an aqueous solution of luciferin at 150 mg/kg was injected intraperitoneally 5 minutes before imaging. An IVIS Lumina Imaging System (Xenogen) was used to image the mice, and the Living Image 4.2 software program (Xenogen) was used to quantify the photons emitted from luciferase-expressing cells. Photon flux was calculated using a circle region of each mouse while in a dorsal position.
2.12. Cell-colony formation
Twenty four hours after 300 HNSCC cells per well were seeded in a six-well (35-mm) dish, the cells were treated with DMSO or drugs for 48 hours. Then cells were allowed to grow in complete medium without drugs for 14 days. Cell colonies were fixed in 10% formaldehyde and then stained with crystal violet (0.5% w/v). The colonies were counted and analyzed using the ImageJ software program (National Institutes of Health).
3. Results
3.1. HNSCC cell lines have diverse sensitivity to treatment with inhibitors of PLK1, CHK1/2, and WEE1
The HNSCC cell lines had wide-ranging sensitivity to the three drugs. For many of the cell lines, the dose-response curves plateaued at or near the half-maximal inhibitory concentration (Fig. 1), so we used IC80 and area under the curve (AUC) values to distinguish cell lines sensitive and resistant to the three drugs as we described previously [20]. We considered cell lines with IC80 values greater than the Cmax to be resistant and those with IC80 values lower than the Cmax to be sensitive (Table 1). We applied stringent quality control measures to our data analysis. Of 177 drug-cell line combinations we examined (59 cell lines and 3 drugs), 173 passed quality control testing, resulting in a 98% pass rate (Supplementary Fig. S1).
Fig. 1.

HNSCC cell lines have in vitro diverse sensitivities to drugs that affect mitotic progression. Fifty-nine HNSCC cell lines were treated with volasertib, AZD1775, or AZD7762 at seven concentrations ranging from 0.018 to 9.613 μM for 72 h, and their viability was estimated using a CellTiter-Glo assay. (A) Representative dose-response curves for cell lines sensitive and resistant to the drugs. (B) Distributions of the IC80 values for the 59 cell lines. The vertical orange line is the Cmax values for each drug.
Table 1.
Sensitivity and resistance of HNSCC cell lines to treatment with mitotic inhibitors.
| Drug | Target | Number of sensitive cell lines | Number of resistant cell lines | Median IC80 (μM) | IC80 range (μM)* | Cmax (μM) |
|---|---|---|---|---|---|---|
| AZD1775 | WEE1 | 27 | 32 | 2.210 | 0.066–9.613 | 1.65 |
| AZD7762 | CHK1/2 | 30 | 29 | 0.545 | 0.036–9.613 | 0.77 |
| Volasertib | PLK1 | 15 | 44 | 7.545 | 0.010–9.613 | 1.20 |
The maximum concentration tested was 9.61 μM.
To confirm the target effects of AZD1775, AZD7762, and volasertib in HNSCC cell lines, we measured the levels of substrate activation of WEE1, CHK1/2, and PLK1 in sensitive and resistant HNSCC cell lines. As expected, we observed a decrease in phosphorylated CDK1 (CDC2) with treatment with AZD1775 and AZD7762 and a decrease in phosphorylated TCTP with treatment with volasertib (Supplementary Fig. S2).
3.2. Drug sensitivities do not differ in HPV-positive and -negative HNSCC cell lines
HNSCC caused by infection with high-risk types of HPV is distinct from HPV-negative HNSCC, leading us to hypothesize that they have different drug sensitivities. However, we did not find a significant difference in sensitivity to the three drugs we tested in HPV-positive and -negative HNSCC cell lines (Supplementary Fig. S3). This analysis was limited by the existence of only nine HPV-positive HNSCC cell lines. We did observe a nonsignificant trend of increased resistance of HPV-positive HNSCC cells to treatment with volasertib (p = 0.08).
3.3. Inhibition and knockdown of PLK1 expression lead to cell-cycle arrest and apoptosis in HNSCC cell lines
We focused on the biological effects of PLK1 inhibition on HNSCC cell lines because unlike CHK1/2 and WEE1 inhibition, PLK1 inhibition in HNSCC cells has yet to be well studied. We chose two sensitive and two resistant HNSCC cell lines to further characterize the effects of PLK1 inhibition. Treatment of both sensitive and resistant HNSCC cells with 50 nM volasertib lead to accumulation of cells in G2/M phase (4N DNA content) and in the number of cells with greater than 4N DNA content (polyploid) (Fig. 2A). In contrast, we observed markedly increased sub-G0 populations of cells only among the volasertib- sensitive cell lines. To demonstrate the drug specificity, we knocked down PLK1 expression using siRNA and observed G2/M arrest with polyploidy in all four HNSCC cell lines. PLK1 knockdown led to earlier and more robust increases in the sub-G0 population in sensitive cell lines than in resistant ones (Fig. 2B and 2C).
Fig. 2.
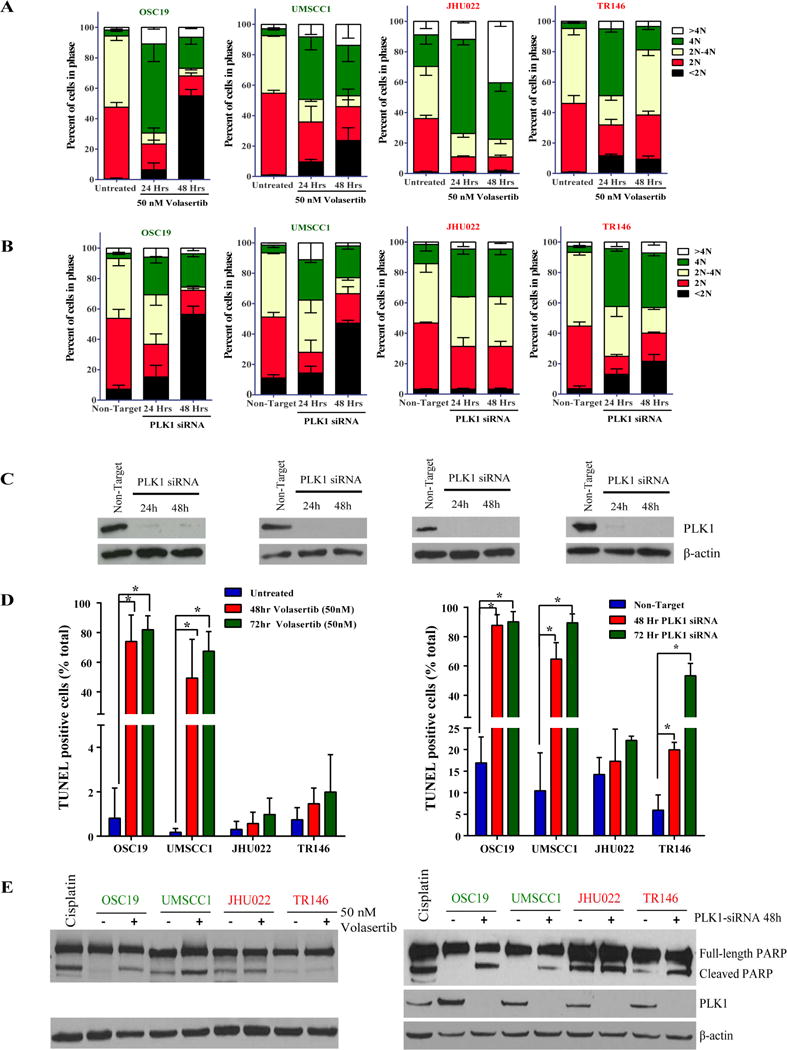
Inhibition or knockdown of PLK1 expression leads to cell-cycle arrest and apoptosis in HNSCC cell lines. HNSCC cells with different levels of sensitivity to treatment with the PLK1 inhibitor volasertib were treated with the drug at 50 nM or transfected with a PLK1 siRNA as indicated in the figures. (A and B) HNSCC cell-cycle stages determined according to 7-aminoactinomycin D and BrdU incorporation. (C) Western blots confirming the knockdown efficiency of PLK1 siRNA in the HNSCC cells. (D and E) HNSCC-cell apoptosis as measured using terminal deoxynucleotidyl transferase dUTP nick-end labeling staining and Western blotting for cleaved poly(ADP-ribose) polymerase (PARP). OSC19 cells incubated with 10 μM cisplatin for 48 hours were included as positive controls for apoptosis assessment.
Consistent with the results of our cell viability assays and cell-cycle analysis, treatment with volasertib induced substantial apoptosis only in HNSCC cell lines sensitive to it (Fig. 2D). PLK1 knockdown using siRNA induced stronger and earlier apoptosis in the sensitive cell lines than in the resistant ones as assessed by both a flow cytometry based TUNEL assay and Western blotting for PARP cleavage (Figs. 2D and 2E).
3.4. Identification of mutations that predict response of HNSCC to treatment with PLK1, CHK1/2, and WEE1 inhibitors
To identify potential biomarkers of response of HNSCC to PLK1, CHK1/2, and WEE1 inhibition and mechanisms of apoptosis induced by this inhibition we performed integrated analysis of gene and protein expression, gene mutations and drug sensitivity of HNSCC cell lines. After adjusting for multiple testing, we found no correlation of gene expression with sensitivity to AZD1775 or AZD7762 with an FDR of no more than 0.20. For volasertib, the expression of 29 genes correlated with sensitivity to it using an FDR of up to 0.20 (Supplementary Table S3). We also did not observe correlation of protein expression measured by RPPA with sensitivity to volasertib but did see correlation of expression of some proteins with sensitivity to AZD1775 and AZD7762 (Supplementary Table S4).
We compared the mutational statuses determined using whole-exome sequencing with drug sensitivity for all identified mutations, including the 50 most common driver genes (Supplementary Table S2), in HNSCC cell lines. We identified three, four, and two driver mutations that correlated with sensitivity to treatment with volasertib, AZD1775, and AZD7762, respectively (Fig. 3A–C).
Fig. 3.

Mutations that predict sensitivity of HNSCC cells to treatment with PLK1, CHK1/2, and WEE1 inhibitors in vitro and in vivo. Drug sensitivity was compared with mutational status for all identified mutations in the 59 HNSCC cell lines (see Materials and Methods for details on mutation calling) for volasertib (A), AZD1775 (B), and AZD7762 (C). The box plots in A–C show the mutations that both correlated with drug sensitivity and were among the 50 top genes mutated in HNSCC cells. (D) IC80 values for AZD1775, AZD7762, and volasertib with and without RAS (HRAS + KRAS) mutations in the HNSCC cell lines. (E–G) Mice bearing tongue tumors generated by injection of OSC19-luc cells were given 30 mg/kg volasertib weekly or a vehicle control. Their tumor sizes and bioluminescence were measured twice weekly (F), with representative photographs of the mice shown in E. Individual tumors are graphed as thin lines with markers. The mean tumor size is indicated by the thick solid line, and the standard deviation is indicated in dark gray. (G) Kaplan-Meier survival curves for the mice.
The presence of an AJUBA (JUB) mutation in HNSCC cells correlated with volasertib sensitivity when measured according to the predefined IC80 cutoff (p = 0.024) or AUC (p = 0.019). Likewise, AJUBA-mutant cells were more sensitive to treatment with AZD7762 (p = 0.014 for the IC80 and p = 0.052 for the AUC) and AZD1775 (p = 0.016 for the IC80 and p = 0.034 for the AUC) than wt cell lines. HNSCC cell lines with mutations in either HRAS or KRAS were more resistant than those wild-type for RAS to treatment with volasertib (p = 0.083 for the IC80 and p = 0.211 for the AUC), AZD1775 (p = 0.021 for the IC80 and p = 0.166 for the AUC), and AZD7762 (p = 0.009 for the IC80 and p = 0.068 for the AUC) (Fig. 3D, Supplementary Fig. S4, Tables 1 and 2). SMAD4 mutations also predicted sensitivity to treatment with volasertib and AZD1775. We identified seven (12%), eight (14%), and six (10%) HNSCC cell lines harboring AJUBA, RAS and SMAD4 mutations, respectively (Supplementary Fig. S5, Supplementary Tables S5 and S6).
Table 2.
Correlation between gene mutations and drug sensitivity in HNSCC cell lines according to IC80
| Gene | AZD1775 (WEE1) | AZD7762 (CHK1/2) | Volasertib (PLK1) | ||||||||||||
|---|---|---|---|---|---|---|---|---|---|---|---|---|---|---|---|
|
| |||||||||||||||
| WT | Mutant | WT | Mutant | WT | Mutant | ||||||||||
|
|
|
|
|||||||||||||
| S | R | S | R | p | S | R | S | R | p | S | R | S | R | p | |
| AJUBA | 22 | 31 | 5 | 1 | 0.016 | 24 | 29 | 6 | 0 | 0.014 | 11 | 42 | 4 | 2 | 0.024 |
| HRAS | 26 | 26 | 1 | 6 | 0.024 | 30 | 22 | 0 | 7 | 0.017 | 15 | 37 | 0 | 7 | 0.165 |
| KRAS | 27 | 31 | 0 | 1 | 0.654 | 30 | 28 | 0 | 1 | 0.362 | 15 | 43 | 0 | 1 | 0.276 |
| KRAS + HRAS | 26 | 25 | 1 | 7 | 0.021 | 30 | 21 | 0 | 8 | 0.009 | 15 | 36 | 0 | 8 | 0.083 |
WT, wild-type; S, sensitive; R, resistant.
The association of TP53 mutations with PLK1 inhibitor sensitivity is controversial. Although we observed a trend of increased sensitivity of TP53-mutant HNSCC cells to treatment with all three drugs, this trend did not reach statistical significance (Supplementary Fig. S6).
3.5. PLK1 inhibition leads to regression of AJUBA-mutant HNSCC in vivo
To confirm the sensitivity of AJUBA mutant HNSCC in vivo, we examined the antitumor effect of PLK1 inhibition using volasertib in an orthotopic nude mouse model of HNSCC. We gave mice bearing tongue tumors generated by AJUBA-mutant OSC19 cells volasertib or a vehicle control. We observed markedly lower tumor volumes in the mice given volasertib than in the control group. To confirm the antitumor effects of volasertib, we also monitored the bioluminescence intensity of OSC19-luc cells in the mice (Fig. 3E and 3F). We killed the mice on day 21 or when they lost more than 20% of their body weight. All of the mice given volasertib survived to day 21. The median survival duration in the control mice was 17.9 days (Fig. 3G).
3.6. AJUBA overexpression leads to increased PLK1 and Bora protein expression and reduced PLK1 inhibition-induced apoptosis in HNSCC cells
The Cancer Genome Atlas identified previously unreported deletions and missense mutations in the functional LIM domain of AJUBA in HNSCCs, suggesting that AJUBA mutations are inactivating events in HNSCC progression. Consistent with the proposed loss of AJUBA function, all HNSCC cell lines with AJUBA mutations in our study had low or undetectable AJUBA protein expression according to Western blotting (Fig. 4A). To determine whether reactivation of AJUBA rescues PLK1-inhibitor induced apoptosis of HNSCC cells, we induced expression of wild-type AJUBA in PCI15B cells, which have an endogenous AJUBA mutation and undetectable AJUBA protein expression. After incubation with 100 nM volasertib for 48 h, fewer PCI15B cells transfected with AJUBA (30%) than those transfected with a vector alone (41%) underwent apoptosis (Fig. 4B–C).
Fig. 4.

AJUBA mutation and overexpression affect PLK1 and Bora protein expression and PLK1 inhibition-induced apoptosis in HNSCC cells. Western blots of AJUBA-mutant and AJUBA-wild-type (wt) HNSCC cell lines that were unsynchronized (A) or synchronized (E) with 100 ng/ml nocodazole for 16 h. The adjacent box plots show quantification of protein expression by the ImageJ software program and normalized to GAPDH. A pair of isogenic PCI15B cells transfected with a vector alone or a vector expressing full-length AJUBA (B) were incubated with volasertib at the indicated concentrations for 48 h, and apoptosis of the cells was measured using terminal deoxynucleotidyl transferase dUTP nick-end labeling alone (C) or for 30 min followed by Western blotting to measure PLK1 substrate inhibition (D). Phosphorylated MYT1 (pMYT1) expression was quantitated using the ImageJ software program and normalized according to their corresponding total levels of expression. OE, overexpression. *p < 0.05.
To understand the mechanism that underlies AJUBA-mediated PLK1 inhibitor resistance of HNSCC, we examined the expression of PLK1, Bora, and Aurora A in AJUBA-mutant and -wild-type HNSCC cell lines. AJUBA is an LIM protein that binds to Aurora A and is essential for mitotic entry. At the onset of mitotic entry, Aurora A forms a complex with Bora and phosphorylates PLK1 at T210, leading to its activation. Unsynchronized HNSCC cell lines with AJUBA mutations had lower levels of total PLK1 and Bora protein expression than wild-type cells (Fig. 4A and 4B). In our panel of 59 HNSCC cell lines, AJUBA-mutant and -wild-type cell lines did not have different levels of PLK1 and Bora mRNA expression, which was consistent with their posttranslational regulation (Supplementary Fig. S7). Likewise, AJUBA overexpression led to increased PLK1 and Bora protein expression (Fig. 4B) but no change in PLK1 or Bora mRNA expression in PCI15B cells (Supplementary Fig. S8). Likewise HNSCC cell lines with AJUBA mutations synchronized in G2-M had lower levels of total PLK1 and Bora protein expression and Aurora A activation than wild-type cells (Fig. 4E).
We hypothesized that reduced expression levels of total PLK1 in AJUBA-mutant HNSCC cells would make them vulnerable to PLK1 inhibition, particularly at low volasertib concentrations at which PLK1 inhibition may not be as complete in cells with higher basal PLK1 levels. To test this threshold effect of volasertib on HNSCC cells, we examined paired isogenic PCI15B cells with forced AJUBA expression. After treatment with volasertib for 30 min, phosphorylation of the PLK1 substrate Myt1 (Thr495) was inhibited in the cells transfected with vector alone but not in those with exogenous AJUBA (Fig. 4D).
Although the basal PLK1, Bora, and AJUBA protein expression levels measured by Western blotting predicted response to treatment with volasertib (Supplementary Fig. S9), PLK1, Bora, and Aurora A mRNA expression did not predict sensitivity to volasertib in the 59-cell-line panel (Supplementary Fig. S10).
3.7. AJUBA overexpression leads to cell-cycle progression
PLK1 is expressed from G2 phase to the end of mitosis when it is rapidly degraded. The effect of AJUBA expression on basal levels of PLK1 and Bora expression and AJUBA’s known role in promoting Aurora A activity in cells led us to hypothesize that AJUBA expression affects cell-cycle progression in HNSCC cells. To test this hypothesis, we synchronized an isogenic pair of PCI15B cell lines in G2/M phase using treatment with nocodazole and measured the cell-cycle distribution of the cell lines after nocodazole release. Cells that expressed AJUBA progressed more quickly through the cell cycle following release. As expected, both cell lines were predominantly (~80%) in G2/M at the start of the experiment, but the cells with AJUBA overexpression progressed more quickly to the G1 and S phases than did vector control cells (Fig. 5A). For example, at 4.5 h, 19% of the AJUBA-overexpressing cells were in G1 phase compared with 10% of vector-transfected cells. Consistent with these cell-cycle data, PCI15B cell lines that expressed AJUBA proliferated faster than vector-transfected control cells did. In a colony formation assay, cells with AJUBA overexpression formed more and larger colonies than did control cells (Fig. 5B). However, AJUBA-mutant cell lines did not have doubling times that were significantly different from those of cell lines wild-type for AJUBA (p = 0.705) (Fig. 5C).
Fig. 5.
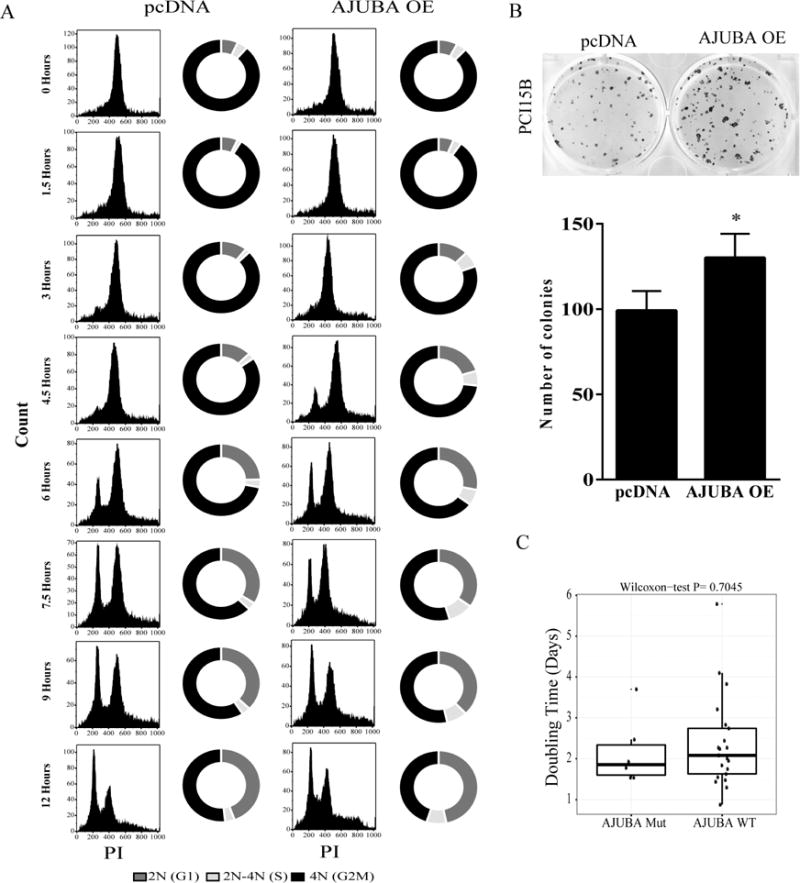
AJUBA overexpression leads to cell-cycle progression in HNSCC cells. (A) A pair of isogenic PCI15B cell lines transfected with AJUBA or a vector alone was incubated with 100 ng/ml nocodazole for 16 h and then released into complete medium without any drugs. At the indicated time points, cells were incubated with BrdU and 7-aminoactinomycin D and subjected to fluorescence-activated cell sorter analysis to estimate the portion of cells in each phase of the cell cycle. OE, overexpression. (B) The two cell lines were plated sparsely and allowed to grow on plastic for 14 days before quantification. The assay was repeated and normalized according to the control (vector only); the mean ± standard deviation number of cell colonies is shown. *P < 0.05. (C) HNSCC cell-doubling times in AJUBA-wild-type (wt) and AJUBA-mutant (Mut) HNSCC cell lines.
To determine if the rate of proliferation of HNSCC cell lines affected their drug sensitivity, we compared drug sensitivity with cell-doubling time for 6 AJUBA-mutant cell lines and 23 lines wild-type for AJUBA. The doubling time did not correlate with sensitivity to AZD1775 or AZD7762 but did correlate with sensitivity to volasertib, with the more rapidly proliferating cell lines being slightly more sensitive (Supplementary Fig. S11). However, this finding cannot account for increased drug sensitivity of AJUBA-overexpressing cells that proliferated more rapidly than vector control cells but underwent volasertib-induced apoptosis less often.
4. Discussion
We describe herein the first large-scale, integrated analysis of gene expression, gene mutations, protein expression, and sensitivity to treatment with three clinically relevant drugs in HNSCC cell lines to identify mechanisms and biomarkers that predict response of this cancer to drugs that affect mitotic progression. We demonstrated that HNSCC cell lines have wide-ranging sensitivity to these drugs. We focused on the biological effects of PLK1 inhibition on HNSCC cell lines because unlike CHK1/2 [6, 8, 21] and WEE1 [39, 42, 57, 67], the effect of PLK1 inhibition on HNSCC is not well studied, and high expression of PLK1 correlates with poor prognosis for HNSCC [29, 30, 62, 63]. Although both sensitive and resistant cell lines underwent the expected G2/M cell-cycle arrest following inhibition or knockdown of PLK1 expression, only the sensitive cell lines underwent substantial apoptosis. We discovered three gene mutations that correlated with drug sensitivity but focused on AJUBA mutation because of 1) its known role in activating Aurora A, a key regulator of PLK1 activity; 2) robust correlation with PLK1 inhibitor sensitivity; 3) lack of any prior studies of AJUBA function in HNSCC cells; and 4) frequency of mutations in HNSCC patients. We found that PLK1 inhibition led to decreased tumor sizes in an AJUBA-mutant orthotopic HNSCC model. Also, AJUBA overexpression led to increased PLK1 protein expression, reduced PLK1 substrate inhibition, and reduced volasertib-induced apoptosis, suggesting a threshold effect in which increased PLK1 expression induces drug resistance in HNSCC cells.
We demonstrated that HNSCC cell lines have wide-ranging sensitivity to PLK1 inhibition. This is consistent with the results of clinical trials of treatment with PLK1 inhibitors in patients with solid tumors, which demonstrated striking clinical responses but low response rates (4–14%) and stable disease rates of 26–42% in unselected patients [41, 45–48, 53, 60]. Up to 11% of patients had stable disease for more than a year [45, 48]. Our findings are also consistent with the results of multiple in vitro and in vivo laboratory studies of a small number of cell lines. These studies demonstrated diverse responses of cancer cells to PLK1 inhibition, with some cancer cell lines resistant to the effects of inhibition or knockdown of PLK1 expression [13, 18, 52]. However, predictive biomarkers have yet to be used to select cancer patients likely to experience responses to treatment with PLK1 inhibitors, and the mechanisms of resistance to PLK1 inhibitors have yet to be elucidated. These unknowns are major gaps in knowledge that we addressed in the present study. Although several candidate biomarkers can predict PLK1 inhibitor sensitivity [10, 28, 31, 34, 55], laboratory studies of these potential biomarkers have had inconsistent results, and biomarkers have not been further validated.
One potential predictor of response of cancer to PLK1 inhibition is TP53 mutation, although the literature contains conflicting results in this area [13, 20, 38]. Among our 59 HNSCC cell lines, TP53-mutant lines exhibited a nonsignificant trend of being sensitive to treatment with PLK1 inhibitors as well as CHK1/2 and WEE1 inhibitors. Previous studies demonstrated that CHK1/2 and WEE1 inhibitors had broad antitumor activity in TP53-mutant HNSCC cell lines [21, 39]. One limitation of our study is that we did not classify the diverse TP53 mutations in terms of functional statuses. Another limitation is that many of the cell lines wild-type for TP53 were HPV-positive and as such experienced p53 protein inactivation by the HPV oncoprotein E6. Additionally, most of the existing HNSCC cell lines [71] and 48 of the 59 (81%) cell lines in our panel have TP53 mutations, leading to an imbalance in the number of cell lines in each group (TP53 mutant and wild type). TP53 mutation rates in our cells lines were similar to those of HNSCC patients.
Another potential biomarker of response to PLK1 inhibition is RAS mutation. HRAS and KRAS mutations occur in 5–9% and less than 2% of HNSCC patients, respectively [4, 9, 54]. Authors reported that in an isogenic KRAS G13D-mutant colorectal cancer cell line model, the KRAS-mutant cells had increased cell death rates after PLK1 depletion and inhibition [34]. In a recent study by our group using 63 non-small cell lung cancer cell lines, KRAS mutation predicted response to treatment with volasertib but not to a more specific PLK1 inhibitor, GSK461364 [20]. In contrast, in the present study we discovered that HNSCC cells harboring RAS mutations were more resistant to volasertib than were RAS-wild-type cells. Because the mechanisms underlying sensitivity of KRAS-mutant cancer to PLK1 inhibition is completely unknown, speculating why our results are different from those of published studies is difficult. One distinction is that unlike lung and colon cancer cells, HNSCC cells predominantly have HRAS mutations and only rarely have KRAS mutations [9].
We discovered three completely novel biomarkers of response of HNSCC to PLK1 inhibition in this study - insulin receptor substrate 4 (IRS4), SMAD4, and AJUBA mutations. IRS4 is an adaptor protein in cell signaling that is rarely mutated in cancer, where its role is unclear [27]. Although we did not investigate the role of the tumor suppressor SMAD4 in PLK1 inhibitor sensitivity of HNSCC, we speculate that its role in PLK1 inhibitor sensitivity may be because SMAD4 is regulated by transforming growth factor-β pathway which also mediates the epithelial-to-mesenchymal transition. In a study of non-small cell lung cancer, mesenchymal cell lines were more sensitive to treatment with three PLK1 inhibitors than were epithelial lines, and the induction of a mesenchymal phenotype in NSCLC cell lines using transforming growth factor-β led to increased PLK1 inhibitor-induced apoptosis [20]. Mutations of SMAD4 are uncommon in HNSCC cases (~2.5%), but they are very common in pancreatic (16–25%) and colorectal (10–24%) cancer cases. If our present findings are recapitulated in these cancers, they could have a significant clinical benefit.
Researchers identified the LIM protein AJUBA in a yeast two-hybrid screen as an Aurora A binding partner that is essential for mitotic entry [26]. The LIM domain of AJUBA competitively binds to the N-terminus of Aurora A, relieving intramolecular inhibition of Aurora A. Subsequently, the pre-LIM domain of AJUBA is phosphorylated by Aurora A [5]. Aurora A and its co-factor Bora phosphorylate PLK1 at Thr210, contributing to PLK1 activation at the start of mitosis [72]. AJUBA function in HNSCC was not studied before we did so. AJUBA (JUB) mutations occur in 0–6% of HNSCC patients [4, 9, 54]. Consistent with our finding that AJUBA overexpression led to increased proliferation of HNSCC cells, others have shown that AJUBA is phosphorylated by CDK1 at Ser119 and Ser175 during mitosis, leading to increased cellular proliferation and anchorage-independent cell growth [12], and that depletion of AJUBA reduces mitotic progression of cells [3]. In contrast, AJUBA acts as a suppressor of esophageal squamous carcinoma and mesothelioma. Knockdown of AJUBA expression in esophageal squamous carcinoma cell lines leads to increased colony formation, whereas AJUBA overexpression leads to decreased colony formation [70]. In mesothelioma cell lines, overexpression of AJUBA leads to decreased cell proliferation and cell-cycle arrest at G1 or G2 phase depending on the cell line [56]. The primarily inactivating genetic events in AJUBA in HNSCCs suggest that it acts as a suppressor of HNSCC [9], which is not consistent with our data. This discrepancy and the contrasting roles of AJUBA in published studies described above led us to speculate that AJUBA acts as a tumor suppressor or oncogene depending on the context. However, our studies of AJUBA’s role in HNSCC were very limited and focused on its role in drug sensitivity.
This is the first published study directly linking the sensitivity of HNSCC to treatment with PLK1, CHK1/2, and WEE1 inhibitors with specific mutations of AJUBA. In addition, we identified other novel mutations that predict this sensitivity—IRS4 and SMAD4—that we plan to study in more detail in the future. Our findings support the prospective use of these mutations to select HNSCC patients most likely to benefit from treatment with these mitotic inhibitors. Because PLK1, CHK, and WEE1 inhibitors are well tolerated and are available clinically, our results have the potential to be translated into clinical agents for the treatment of HNSCC and provide a strong rationale for the use of AJUBA, IRS4, and SMAD4 mutations as predictive markers for HNSCC patient selection for this treatment.
Supplementary Material
Supplementary Fig. 1. Results of Quality control testing for assessment of reproducibility of drug sensitivity data. Treatment of HNSCC cells is plotted for the two cutoffs used for quality control: CCC greater than 0.8 (left) and location shift less than 0.665 (right).
Supplementary Fig. 2. Treatment with cell-cycle inhibitors inhibits the activity of their substrates in HNSCC cell lines. Cell-cycle inhibitor-sensitive (OSC19) and -resistant (JHU022) HNSCC cell lines were incubated with dimethyl sulfoxide (vehicle control), 1.65 μM AZD1775, 1.2 μM volasertib, or 0.77 μM AZD7762 (Cmax values) for the indicated times. Cells were then lysed and subjected to Western blotting with the indicated primary antibodies.
Supplementary Fig. 3. Similar drug sensitivity of HPV-positive (+) and -negative (−) HNSCC cell lines. Box plots with corresponding p values for the IC80 values (log base 10, μM) for volasertib, AZD7762, and AZD1775 in 50 HPV-negative and 9 HPV-positive HNSCC cell lines are shown.
Supplementary Fig. 4. RAS and AJUBA mutations predict sensitivity of HNSCC cells to treatment with PLK1, CHK1/2, and WEE1 inhibitors in vitro. Box plots with corresponding p values for the AUCs for volasertib, AZD7762, and AZD1775 in the 59 HNSCC cell lines are shown. Mut, mutant; WT, wild-type.
Supplementary Fig. 5. The frequency of specific genetic mutations in HNSCC. (A) The frequency of AJUBA mutations in all cancers tested in The Cancer Genome Atlas (TCGA). (B) The frequency of AJUBA, KRAS, HRAS, SMAD4, and IRS4 mutations in HNSCC cells according to The Cancer Genome Atlas data (accessed using the cBioPortal for Cancer Genomics on October 31, 2016). (C) Venn diagram of all mutations and their relation to drug sensitivity in the 59 HNSCC cell lines.
Supplementary Fig. 6. TP53 mutations do not predict sensitivity of HNSCC to treatment with PLK1, CHK1/2, or WEE1 inhibitors in vitro. Box plots with corresponding p values for the AUCs and IC80 values (log base 10, μM) for volasertib, AZD7762, and AZD1775 in the 59 HNSCC cell lines are shown. Mut, mutant; WT, wild-type.
Supplementary Fig. 7. PLK1 mRNA and functionally associated protein expression levels did not differ in AJUBA-mutant (Mut) and AJUBA-wild-type (WT) HNSCC cell lines. Box plots of expression of the indicated proteins in 52 AJUBA-WT and 7 AJUBA-Mut cell lines along with their p values are shown.
Supplementary Fig. 8. AJUBA overexpression (OE) does not alter PLK1, Bora, or TCTP mRNA expression in HNSCC cells. PCI15B cells transfected with pcDNA (control; empty vector alone) or AJUBA were assayed for mRNA expression using quantitative polymerase chain reaction, and the expression levels were normalized according to control levels. *p < 0.05
Supplementary Fig. 9. Protein expression of PLK1, BORA and AJUBA significantly correlates with volasertib drug sensitivity. Protein expression of PLK1, BORA, AURORA A and AJUBA was determined by western blot in 7 wild type AJUBA and 7 AJUBA mutant cell lines. The blue line represents linear regression and 95% confidence interval is indicated in dark gray.
Supplementary Fig. 10. The mRNA levels of PLK1 and functionally associated proteins did not correlate with sensitivity of HNSCC cells to treatment with the PLK1 inhibitor volasertib. The blue line indicates the linear regression and 95% confidence interval is indicated in dark gray.
Supplementary Fig. 11. HNSCC cell-doubling time correlated only with drug sensitivity to volasertib. Cell-doubling time was compared with drug sensitivity as measured according to the AUC or IC80. The blue lines indicates the linear regression and 95% confidence interval indicated in dark gray.
Highlights.
Mutations of AJUBA, SMAD4, and RAS predicted sensitivity of HNSCC to treatment with inhibitors of PLK1, CHK1/2, and WEE1 activity.
PLK1 inhibition led to apoptosis in vitro and decreased tumor size in vivo in an orthotopic AJUBA-mutant HNSCC model.
AJUBA-mutant HNSCC cell lines have high levels of PLK1 protein expression, leading to a threshold effect in which high concentrations of PLK1 inhibitors are needed for substrate inhibition.
Forced AJUBA expression in AJUBA-mutant HNSCC cells led to increased proliferation.
Acknowledgments
We thank Donald R. Norwood of the Department of Scientific Publications at MD Anderson for scientific editing of the manuscript.
Flow cytometry and bioinformatics were supported by the NIH/NCI under award number P30CA016672 (to MD Anderson). Research was supported by generous philanthropic contributions to the MD Anderson HPV-Related Cancers Moon Shot Program (to F.M. Johnson) and Oropharynx Discovery Programs (to J.N. Myers). M. Zhang was sponsored by the Natural Science Foundation of Shanghai (13ZR1406200).
Abbreviations
- AUC
area under the curve
- BrdU
bromodeoxyuridine
- CCC
concordance correlation coefficient
- CHK1/2
checkpoint kinases 1 and 2
- FDR
false-discovery rate
- HNSCC
head and neck squamous cell carcinoma
- HPV
human papillomavirus
- IRS4
insulin receptor substrate 4
- PLK1
polo-like kinase 1
- TCTP
translation controlled tumor protein
Footnotes
Publisher's Disclaimer: This is a PDF file of an unedited manuscript that has been accepted for publication. As a service to our customers we are providing this early version of the manuscript. The manuscript will undergo copyediting, typesetting, and review of the resulting proof before it is published in its final citable form. Please note that during the production process errors may be discovered which could affect the content, and all legal disclaimers that apply to the journal pertain.
References
- 1.Broad Institute Picard. http://broadinstitute.github.io/picard/
- 2.Broad Institute TCGA Genome Data Analysis Center. Mutation Analysis MutSig 2CV v3.1. Broad Institute of MIT and Harvard; 2016. [Google Scholar]
- 3.Abe Y, Ohsugi M, Haraguchi K, Fujimoto J, Yamamoto T. LATS2-Ajuba complex regulates gamma-tubulin recruitment to centrosomes and spindle organization during mitosis. FEBS Lett. 2006;580:782–788. doi: 10.1016/j.febslet.2005.12.096. [DOI] [PubMed] [Google Scholar]
- 4.Agrawal N, Frederick MJ, Pickering CR, Bettegowda C, Chang K, Li RJ, Fakhry C, Xie TX, Zhang J, Wang J, Zhang N, El-Naggar AK, Jasser SA, Weinstein JN, Trevino L, Drummond JA, Muzny DM, Wu Y, Wood LD, Hruban RH, Westra WH, Koch WM, Califano JA, Gibbs RA, Sidransky D, Vogelstein B, Velculescu VE, Papadopoulos N, Wheeler DA, Kinzler KW, Myers JN. Exome sequencing of head and neck squamous cell carcinoma reveals inactivating mutations in NOTCH1. Science. 2011;333:1154–1157. doi: 10.1126/science.1206923. [DOI] [PMC free article] [PubMed] [Google Scholar]
- 5.Bai M, Ni J, Wu J, Wang B, Shen S, Yu L. A novel mechanism for activation of Aurora-A kinase by Ajuba. Gene. 2014;543:133–139. doi: 10.1016/j.gene.2014.03.048. [DOI] [PubMed] [Google Scholar]
- 6.Barker HE, Patel R, McLaughlin M, Schick U, Zaidi S, Nutting CM, Newbold KL, Bhide S, Harrington KJ. CHK1 Inhibition Radiosensitizes Head and Neck Cancers to Paclitaxel-Based Chemoradiotherapy. Mol Cancer Ther. 2016;15:2042–2054. doi: 10.1158/1535-7163.MCT-15-0998. [DOI] [PubMed] [Google Scholar]
- 7.Biankin AV, Waddell N, Kassahn KS, Gingras MC, Muthuswamy LB, Johns AL, Miller DK, Wilson PJ, Patch AM, Wu J, Chang DK, Cowley MJ, Gardiner BB, Song S, Harliwong I, Idrisoglu S, Nourse C, Nourbakhsh E, Manning S, Wani S, Gongora M, Pajic M, Scarlett CJ, Gill AJ, Pinho AV, Rooman I, Anderson M, Holmes O, Leonard C, Taylor D, Wood S, Xu Q, Nones K, Fink JL, Christ A, Bruxner T, Cloonan N, Kolle G, Newell F, Pinese M, Mead RS, Humphris JL, Kaplan W, Jones MD, Colvin EK, Nagrial AM, Humphrey ES, Chou A, Chin VT, Chantrill LA, Mawson A, Samra JS, Kench JG, Lovell JA, Daly RJ, Merrett ND, Toon C, Epari K, Nguyen NQ, Barbour A, Zeps N, I. Australian Pancreatic Cancer Genome. Kakkar N, Zhao F, Wu YQ, Wang M, Muzny DM, Fisher WE, Brunicardi FC, Hodges SE, Reid JG, Drummond J, Chang K, Han Y, Lewis LR, Dinh H, Buhay CJ, Beck T, Timms L, Sam M, Begley K, Brown A, Pai D, Panchal A, Buchner N, Borja R De, Denroche RE, Yung CK, Serra S, Onetto N, Mukhopadhyay D, Tsao MS, Shaw PA, Petersen GM, Gallinger S, Hruban RH, Maitra A, Iacobuzio-Donahue CA, Schulick RD, Wolfgang CL, Morgan RA, Lawlor RT, Capelli P, Corbo V, Scardoni M, Tortora G, Tempero MA, Mann KM, Jenkins NA, Perez-Mancera PA, Adams DJ, Largaespada DA, Wessels LF, Rust AG, Stein LD, Tuveson DA, Copeland NG, Musgrove EA, Scarpa A, Eshleman JR, Hudson TJ, Sutherland RL, Wheeler DA, Pearson JV, McPherson JD, Gibbs RA, Grimmond SM. Pancreatic cancer genomes reveal aberrations in axon guidance pathway genes. Nature. 2012;491:399–405. doi: 10.1038/nature11547. [DOI] [PMC free article] [PubMed] [Google Scholar]
- 8.Borst GR, McLaughlin M, Kyula JN, Neijenhuis S, Khan A, Good J, Zaidi S, Powell NG, Meier P, Collins I, Garrett MD, Verheij M, Harrington KJ. Targeted radiosensitization by the Chk1 inhibitor SAR-020106. Int J Radiat Oncol Biol Phys. 2013;85:1110–1118. doi: 10.1016/j.ijrobp.2012.08.006. [DOI] [PubMed] [Google Scholar]
- 9.N. Cancer Genome Atlas. Comprehensive genomic characterization of head and neck squamous cell carcinomas. Nature. 2015;517:576–582. doi: 10.1038/nature14129. [DOI] [PMC free article] [PubMed] [Google Scholar]
- 10.Cerami E, Gao J, Dogrusoz U, Gross BE, Sumer SO, Aksoy BA, Jacobsen A, Byrne CJ, Heuer ML, Larsson E, Antipin Y, Reva B, Goldberg AP, Sander C, Schultz N. The cBio cancer genomics portal: an open platform for exploring multidimensional cancer genomics data. Cancer Discov. 2012;2:401–404. doi: 10.1158/2159-8290.CD-12-0095. [DOI] [PMC free article] [PubMed] [Google Scholar]
- 11.Chaturvedi AK, Anderson WF, Lortet-Tieulent J, Curado MP, Ferlay J, Franceschi S, Rosenberg PS, Bray F, Gillison ML. Worldwide Trends in Incidence Rates for Oral Cavity and Oropharyngeal Cancers. J Clin Oncol. 2013;31:4550–4559. doi: 10.1200/JCO.2013.50.3870. [DOI] [PMC free article] [PubMed] [Google Scholar]
- 12.Chen X, Stauffer S, Chen Y, Dong J. Ajuba Phosphorylation by CDK1 Promotes Cell Proliferation and Tumorigenesis. J Biol Chem. 2016 doi: 10.1074/jbc.M116.722751. [DOI] [PMC free article] [PubMed] [Google Scholar]
- 13.Craig SN, Wyatt MD, McInnes C. Current assessment of polo-like kinases as anti-tumor drug targets. Expert Opin Drug Discov. 2014;9:773–789. doi: 10.1517/17460441.2014.918100. [DOI] [PubMed] [Google Scholar]
- 14.Dai Y, Grant S. New insights into checkpoint kinase 1 in the DNA damage response signaling network. Clin Cancer Res. 2010;16:376–383. doi: 10.1158/1078-0432.CCR-09-1029. [DOI] [PMC free article] [PubMed] [Google Scholar]
- 15.Hamer PC De Witt, Mir SE, Noske D, Noorden CJ Van, Wurdinger T. WEE1 kinase targeting combined with DNA-damaging cancer therapy catalyzes mitotic catastrophe. Clin Cancer Res. 2011;17:4200–4207. doi: 10.1158/1078-0432.CCR-10-2537. [DOI] [PubMed] [Google Scholar]
- 16.DePristo MA, Banks E, Poplin R, Garimella KV, Maguire JR, Hartl C, Philippakis AA, del Angel G, Rivas MA, Hanna M, McKenna A, Fennell TJ, Kernytsky AM, Sivachenko AY, Cibulskis K, Gabriel SB, Altshuler D, Daly MJ. A framework for variation discovery and genotyping using next-generation DNA sequencing data. Nat Genet. 2011;43:491–498. doi: 10.1038/ng.806. [DOI] [PMC free article] [PubMed] [Google Scholar]
- 17.Do K, Wilsker D, Ji J, Zlott J, Freshwater T, Kinders RJ, Collins J, Chen AP, Doroshow JH, Kummar S. Phase I Study of Single-Agent AZD1775 (MK-1775), a Wee1 Kinase Inhibitor, in Patients With Refractory Solid Tumors. J Clin Oncol. 2015;33:3409–3415. doi: 10.1200/JCO.2014.60.4009. [DOI] [PMC free article] [PubMed] [Google Scholar]
- 18.Driscoll DL, Chakravarty A, Bowman D, Shinde V, Lasky K, Shi J, Vos T, Stringer B, Amidon B, D’Amore N, Hyer ML. Plk1 inhibition causes post-mitotic DNA damage and senescence in a range of human tumor cell lines. PLoS One. 2014;9:e111060. doi: 10.1371/journal.pone.0111060. [DOI] [PMC free article] [PubMed] [Google Scholar]
- 19.Ferlay J, Soerjomataram I, Dikshit R, Eser S, Mathers C, Rebelo M, Parkin DM, Forman D, Bray F. Cancer incidence and mortality worldwide: sources, methods and major patterns in GLOBOCAN 2012. Int J Cancer. 2015;136:E359–386. doi: 10.1002/ijc.29210. [DOI] [PubMed] [Google Scholar]
- 20.Ferrarotto R, Goonatilake R, Yoo S Young, Tong P, Giri U, Peng S, Minna J, Girard L, Wang Y, Wang L, Li L, Diao L, Peng DH, Gibbons DL, Glisson BS, Heymach JV, Wang J, Byers LA, Johnson FM. Epithelial-Mesenchymal Transition Predicts Polo-Like Kinase 1 Inhibitor-Mediated Apoptosis in Non-Small Cell Lung Cancer. Clin Cancer Res. 2016;22:1674–1686. doi: 10.1158/1078-0432.CCR-14-2890. [DOI] [PMC free article] [PubMed] [Google Scholar]
- 21.Gadhikar MA, Sciuto MR, Alves MV, Pickering CR, Osman AA, Neskey DM, Zhao M, Fitzgerald AL, Myers JN, Frederick MJ. Chk1/2 inhibition overcomes the cisplatin resistance of head and neck cancer cells secondary to the loss of functional p53. Mol Cancer Ther. 2013;12:1860–1873. doi: 10.1158/1535-7163.MCT-13-0157. [DOI] [PMC free article] [PubMed] [Google Scholar]
- 22.Gupta S, Kong W, Peng Y, Miao Q, Mackillop WJ. Temporal trends in the incidence and survival of cancers of the upper aerodigestive tract in Ontario and the United States. Int J Cancer. 2009;125:2159–2165. doi: 10.1002/ijc.24533. [DOI] [PubMed] [Google Scholar]
- 23.Haibe-Kains B, El-Hachem N, Birkbak NJ, Jin AC, Beck AH, Aerts HJ, Quackenbush J. Inconsistency in large pharmacogenomic studies. Nature. 2013;504:389–393. doi: 10.1038/nature12831. [DOI] [PMC free article] [PubMed] [Google Scholar]
- 24.Helleday T, Petermann E, Lundin C, Hodgson B, Sharma RA. DNA repair pathways as targets for cancer therapy. Nat Rev Cancer. 2008;8:193–204. doi: 10.1038/nrc2342. [DOI] [PubMed] [Google Scholar]
- 25.Hirai H, Iwasawa Y, Okada M, Arai T, Nishibata T, Kobayashi M, Kimura T, Kaneko N, Ohtani J, Yamanaka K, Itadani H, Takahashi-Suzuki I, Fukasawa K, Oki H, Nambu T, Jiang J, Sakai T, Arakawa H, Sakamoto T, Sagara T, Yoshizumi T, Mizuarai S, Kotani H. Small-molecule inhibition of Wee1 kinase by MK-1775 selectively sensitizes p53-deficient tumor cells to DNA-damaging agents. Mol Cancer Ther. 2009;8:2992–3000. doi: 10.1158/1535-7163.MCT-09-0463. [DOI] [PubMed] [Google Scholar]
- 26.Hirota T, Kunitoku N, Sasayama T, Marumoto T, Zhang D, Nitta M, Hatakeyama K, Saya H. Aurora-A and an interacting activator, the LIM protein Ajuba, are required for mitotic commitment in human cells. Cell. 2003;114:585–598. doi: 10.1016/s0092-8674(03)00642-1. [DOI] [PubMed] [Google Scholar]
- 27.Hoxhaj G, Dissanayake K, MacKintosh C. Effect of IRS4 levels on PI 3-kinase signalling. PLoS One. 2013;8:e73327. doi: 10.1371/journal.pone.0073327. [DOI] [PMC free article] [PubMed] [Google Scholar]
- 28.King SI, Purdie CA, Bray SE, Quinlan PR, Jordan LB, Thompson AM, Meek DW. Immunohistochemical detection of Polo-like kinase-1 (PLK1) in primary breast cancer is associated with TP53 mutation and poor clinical outcom. Breast Cancer Res. 2012;14:R40. doi: 10.1186/bcr3136. [DOI] [PMC free article] [PubMed] [Google Scholar]
- 29.Knecht R, Elez R, Oechler M, Solbach C, von Ilberg C, Strebhardt K. Prognostic significance of polo-like kinase (PLK) expression in squamous cell carcinomas of the head and neck. Cancer Res. 1999;59:2794–2797. [PubMed] [Google Scholar]
- 30.Knecht R, Oberhauser C, Strebhardt K. PLK (polo-like kinase), a new prognostic marker for oropharyngeal carcinomas. Int J Cancer. 2000;89:535–536. [PubMed] [Google Scholar]
- 31.Kreis NN, Louwen F, Zimmer B, Yuan J. Loss of p21Cip1/CDKN1A renders cancer cells susceptible to Polo-like kinase 1 inhibition. Oncotarget. 2015;6:6611–6626. doi: 10.18632/oncotarget.2844. [DOI] [PMC free article] [PubMed] [Google Scholar]
- 32.Li H, Durbin R. Fast and accurate long-read alignment with Burrows-Wheeler transform. Bioinformatics. 2010;26:589–595. doi: 10.1093/bioinformatics/btp698. [DOI] [PMC free article] [PubMed] [Google Scholar]
- 33.Lin LI. A concordance correlation coefficient to evaluate reproducibility. Biometrics. 1989;45:255–268. [PubMed] [Google Scholar]
- 34.Luo J, Emanuele MJ, Li D, Creighton CJ, Schlabach MR, Westbrook TF, Wong KK, Elledge SJ. A genome-wide RNAi screen identifies multiple synthetic lethal interactions with the Ras oncogene. Cell. 2009;137:835–848. doi: 10.1016/j.cell.2009.05.006. [DOI] [PMC free article] [PubMed] [Google Scholar]
- 35.Manchado E, Guillamot M, Malumbres M. Killing cells by targeting mitosis. Cell Death Differ. 2012;19:369–377. doi: 10.1038/cdd.2011.197. [DOI] [PMC free article] [PubMed] [Google Scholar]
- 36.Mazumdar T, Byers LA, Ng PK, Mills GB, Peng S, Diao L, Fan YH, Stemke-Hale K, Heymach JV, Myers JN, Glisson BS, Johnson FM. A Comprehensive Evaluation of Biomarkers Predictive of Response to PI3K Inhibitors and of Resistance Mechanisms in Head and Neck Squamous Cell Carcinoma. Mol Cancer Ther. 2014;13:2738–2750. doi: 10.1158/1535-7163.MCT-13-1090. [DOI] [PMC free article] [PubMed] [Google Scholar]
- 37.McKenna A, Hanna M, Banks E, Sivachenko A, Cibulskis K, Kernytsky A, Garimella K, Altshuler D, Gabriel S, Daly M, DePristo MA. The Genome Analysis Toolkit: a MapReduce framework for analyzing next-generation DNA sequencing data. Genome Res. 2010;20:1297–1303. doi: 10.1101/gr.107524.110. [DOI] [PMC free article] [PubMed] [Google Scholar]
- 38.Medema RH, Lin CC, Yang JC. Polo-like kinase 1 inhibitors and their potential role in anticancer therapy, with a focus on NSCLC. Clin Cancer Res. 2011;17:6459–6466. doi: 10.1158/1078-0432.CCR-11-0541. [DOI] [PubMed] [Google Scholar]
- 39.Moser R, Xu C, Kao M, Annis J, Lerma LA, Schaupp CM, Gurley KE, Jang IS, Biktasova A, Yarbrough WG, Margolin AA, Grandori C, Kemp CJ, Mendez E. Functional kinomics identifies candidate therapeutic targets in head and neck cancer. Clin Cancer Res. 2014;20:4274–4288. doi: 10.1158/1078-0432.CCR-13-2858. [DOI] [PMC free article] [PubMed] [Google Scholar]
- 40.Myers JN, Holsinger FC, Jasser SA, Bekele BN, Fidler IJ. An orthotopic nude mouse model of oral tongue squamous cell carcinoma. Clin Cancer Res. 2002;8:293–298. [PubMed] [Google Scholar]
- 41.Nokihara H, Yamada Y, Fujiwara Y, Yamamoto N, Wakui H, Nakamichi S, Kitazono S, Inoue K, Harada A, Taube T, Takeuchi Y, Tamura T. Phase I trial of volasertib, a Polo-like kinase inhibitor, in Japanese patients with advanced solid tumors. Invest New Drugs. 2016;34:66–74. doi: 10.1007/s10637-015-0300-0. [DOI] [PubMed] [Google Scholar]
- 42.Osman AA, Monroe MM, Alves MV Ortega, Patel AA, Katsonis P, Fitzgerald AL, Neskey DM, Frederick MJ, Woo SH, Caulin C, Hsu TK, McDonald TO, Kimmel M, Meyn RE, Lichtarge O, Myers JN. Wee-1 kinase inhibition overcomes cisplatin resistance associated with high-risk TP53 mutations in head and neck cancer through mitotic arrest followed by senescence. Mol Cancer Ther. 2015;14:608–619. doi: 10.1158/1535-7163.MCT-14-0735-T. [DOI] [PMC free article] [PubMed] [Google Scholar]
- 43.Pancari P, Mehra R. Systemic therapy for squamous cell carcinoma of the head and neck. Surgical oncology clinics of North America. 2015;24:437–454. doi: 10.1016/j.soc.2015.03.004. [DOI] [PubMed] [Google Scholar]
- 44.Pounds S, Morris SW. Estimating the occurrence of false positives and false negatives in microarray studies by approximating and partitioning the empirical distribution of p-values. Bioinformatics. 2003;19:1236–1242. doi: 10.1093/bioinformatics/btg148. [DOI] [PubMed] [Google Scholar]
- 45.Pujade-Lauraine E, Selle F, Weber B, Ray-Coquard IL, Vergote I, Sufliarsky J, Del Campo JM, Lortholary A, Lesoin A, Follana P, Freyer G, Pardo B, Vidal L, Tholander B, Gladieff L, Sassi M, Garin-Chesa P, Nazabadioko S, Marzin K, Pilz K, Joly F. Volasertib Versus Chemotherapy in Platinum-Resistant or -Refractory Ovarian Cancer: A Randomized Phase II Groupe des Investigateurs Nationaux pour l’Etude des Cancers de l’Ovaire Study. J Clin Oncol. 2016;34:706–713. doi: 10.1200/JCO.2015.62.1474. [DOI] [PubMed] [Google Scholar]
- 46.Schoffski P, Awada A, Dumez H, Gil T, Bartholomeus S, Wolter P, Taton M, Fritsch H, Glomb P, Munzert G. A phase I, dose-escalation study of the novel Polo-like kinase inhibitor volasertib (BI 6727) in patients with advanced solid tumours. Eur J Cancer. 2012;48:179–186. doi: 10.1016/j.ejca.2011.11.001. [DOI] [PubMed] [Google Scholar]
- 47.Schoffski P, Blay JY, De Greve J, Brain E, Machiels JP, Soria JC, Sleijfer S, Wolter P, Ray-Coquard I, Fontaine C, Munzert G, Fritsch H, Hanft G, Aerts C, Rapion J, Allgeier A, Bogaerts J, Lacombe D. Multicentric parallel phase II trial of the polo-like kinase 1 inhibitor BI 2536 in patients with advanced head and neck cancer, breast cancer, ovarian cancer, soft tissue sarcoma and melanoma. The first protocol of the European Organization for Research and Treatment of Cancer (EORTC) Network Of Core Institutes (NOCI) Eur J Cancer. 2010;46:2206–2215. doi: 10.1016/j.ejca.2010.03.039. [DOI] [PubMed] [Google Scholar]
- 48.Sebastian M, Reck M, Waller CF, Kortsik C, Frickhofen N, Schuler M, Fritsch H, Gaschler-Markefski B, Hanft G, Munzert G, von Pawel J. The efficacy and safety of BI 2536, a novel Plk-1 inhibitor, in patients with stage IIIB/IV non-small cell lung cancer who had relapsed after, or failed, chemotherapy: results from an open-label, randomized phase II clinical trial. J Thorac Oncol. 2010;5:1060–1067. doi: 10.1097/JTO.0b013e3181d95dd4. [DOI] [PubMed] [Google Scholar]
- 49.Sen B, Peng S, Saigal B, Williams MD, Johnson FM. Distinct interactions between c-Src and c-Met in mediating resistance to c-Src inhibition in head and neck cancer. Clin Cancer Res. 2011;17:514–524. doi: 10.1158/1078-0432.CCR-10-1617. [DOI] [PMC free article] [PubMed] [Google Scholar]
- 50.Sen B, Peng S, Woods DM, Wistuba I, Bell D, El-Naggar AK, Lai SY, Johnson FM. STAT5A-mediated SOCS2 expression regulates Jak2 and STAT3 activity following c-Src inhibition in head and neck squamous carcinoma. Clin Cancer Res. 2012;18:127–139. doi: 10.1158/1078-0432.CCR-11-1889. [DOI] [PMC free article] [PubMed] [Google Scholar]
- 51.Siegel RL, Miller KD, Jemal A. Cancer statistics, 2015. CA Cancer J Clin. 2015;65:5–29. doi: 10.3322/caac.21254. [DOI] [PubMed] [Google Scholar]
- 52.Spankuch-Schmitt B, Bereiter-Hahn J, Kaufmann M, Strebhardt K. Effect of RNA silencing of polo-like kinase-1 (PLK1) on apoptosis and spindle formation in human cancer cells. J Natl Cancer Inst. 2002;94:1863–1877. doi: 10.1093/jnci/94.24.1863. [DOI] [PubMed] [Google Scholar]
- 53.Stadler WM, Vaughn DJ, Sonpavde G, Vogelzang NJ, Tagawa ST, Petrylak DP, Rosen P, Lin CC, Mahoney J, Modi S, Lee P, Ernstoff MS, Su WC, Spira A, Pilz K, Vinisko R, Schloss C, Fritsch H, Zhao C, Carducci MA. An open-label, single-arm, phase 2 trial of the Polo-like kinase inhibitor volasertib (BI 6727) in patients with locally advanced or metastatic urothelial cancer. Cancer. 2014;120:976–982. doi: 10.1002/cncr.28519. [DOI] [PMC free article] [PubMed] [Google Scholar]
- 54.Stransky N, Egloff AM, Tward AD, Kostic AD, Cibulskis K, Sivachenko A, Kryukov GV, Lawrence MS, Sougnez C, McKenna A, Shefler E, Ramos AH, Stojanov P, Carter SL, Voet D, Cortes ML, Auclair D, Berger MF, Saksena G, Guiducci C, Onofrio RC, Parkin M, Romkes M, Weissfeld JL, Seethala RR, Wang L, Rangel-Escareno C, Fernandez-Lopez JC, Hidalgo-Miranda A, Melendez-Zajgla J, Winckler W, Ardlie K, Gabriel SB, Meyerson M, Lander ES, Getz G, Golub TR, Garraway LA, Grandis JR. The mutational landscape of head and neck squamous cell carcinoma. Science. 2011;333:1157–1160. doi: 10.1126/science.1208130. [DOI] [PMC free article] [PubMed] [Google Scholar]
- 55.Sur S, Pagliarini R, Bunz F, Rago C, Diaz LA, Jr, Kinzler KW, Vogelstein B, Papadopoulos N. A panel of isogenic human cancer cells suggests a therapeutic approach for cancers with inactivated p53. Proc Natl Acad Sci U S A. 2009;106:3964–3969. doi: 10.1073/pnas.0813333106. [DOI] [PMC free article] [PubMed] [Google Scholar]
- 56.Tanaka I, Osada H, Fujii M, Fukatsu A, Hida T, Horio Y, Kondo Y, Sato A, Hasegawa Y, Tsujimura T, Sekido Y. LIM-domain protein AJUBA suppresses malignant mesothelioma cell proliferation via Hippo signaling cascade. Oncogene. 2015;34:73–83. doi: 10.1038/onc.2013.528. [DOI] [PubMed] [Google Scholar]
- 57.Tanaka N, Patel AA, Wang J, Frederick MJ, Kalu NN, Zhao M, Fitzgerald AL, Xie TX, Silver NL, Caulin C, Zhou G, Skinner HD, Johnson FM, Myers JN, Osman AA. Wee-1 Kinase Inhibition Sensitizes High-Risk HPV+ HNSCC to Apoptosis Accompanied by Downregulation of MCl-1 and XIAP Antiapoptotic Proteins. Clin Cancer Res. 2015;21:4831–4844. doi: 10.1158/1078-0432.CCR-15-0279. [DOI] [PMC free article] [PubMed] [Google Scholar]
- 58.Tong P, Coombes KR, Johnson FM, Byers LA, Diao L, Liu DD, Lee JJ, Heymach JV, Wang J. drexplorer: A tool to explore dose-response relationships and drug-drug interactions. Bioinformatics. 2015;31:1692–1694. doi: 10.1093/bioinformatics/btv028. [DOI] [PMC free article] [PubMed] [Google Scholar]
- 59.Torre LA, Bray F, Siegel RL, Ferlay J, Lortet-Tieulent J, Jemal A. Global cancer statistics, 2012. CA Cancer J Clin. 2015;65:87–108. doi: 10.3322/caac.21262. [DOI] [PubMed] [Google Scholar]
- 60.Van den Bossche J, Lardon F, Deschoolmeester V, De Pauw I, Vermorken JB, Specenier P, Pauwels P, Peeters M, Wouters A. Spotlight on Volasertib: Preclinical and Clinical Evaluation of a Promising Plk1 Inhibitor. Med Res Rev. 2016;36:749–786. doi: 10.1002/med.21392. [DOI] [PubMed] [Google Scholar]
- 61.Van der Auwera GA, Carneiro MO, Hartl C, Poplin R, Del Angel G, Levy-Moonshine A, Jordan T, Shakir K, Roazen D, Thibault J, Banks E, Garimella KV, Altshuler D, Gabriel S, DePristo MA. From FastQ data to high confidence variant calls: the Genome Analysis Toolkit best practices pipeline. Current protocols in bioinformatics. 2013;43:11–33. doi: 10.1002/0471250953.bi1110s43. 11 10. [DOI] [PMC free article] [PubMed] [Google Scholar]
- 62.Wagenblast J, Hirth D, Eckardt A, Leinung M, Diensthuber M, Stover T, Hambek M. Antitumoral effect of PLK-1-inhibitor BI2536 in combination with cisplatin and docetaxel in squamous cell carcinoma cell lines of the head and neck. Molecular and clinical oncology. 2013;1:286–290. doi: 10.3892/mco.2012.45. [DOI] [PMC free article] [PubMed] [Google Scholar]
- 63.Wagenblast J, Hirth D, Thron L, Arnoldner C, Diensthuber M, Stover T, Hambek M. Effects of the Polo-like-kinase-1-inhibitor BI2536 in squamous cell carcinoma cell lines of the head and neck. Oncology letters. 2012;4:175–177. doi: 10.3892/ol.2012.700. [DOI] [PMC free article] [PubMed] [Google Scholar]
- 64.Wang K, Li M, Hakonarson H. ANNOVAR: functional annotation of genetic variants from high-throughput sequencing data. Nucleic Acids Res. 2010;38:e164. doi: 10.1093/nar/gkq603. [DOI] [PMC free article] [PubMed] [Google Scholar]
- 65.Wolf G, Elez R, Doermer A, Holtrich U, Ackermann H, Stutte HJ, Altmannsberger HM, Rubsamen-Waigmann H, Strebhardt K. Prognostic significance of polo-like kinase (PLK) expression in non-small cell lung cancer. Oncogene. 1997;14:543–549. doi: 10.1038/sj.onc.1200862. [DOI] [PubMed] [Google Scholar]
- 66.Wu Y, Zhuo X, Dai Z, Guo X, Wang Y, Zhang C, Lai L. Modeling the mitotic regulatory network identifies highly efficient anti-cancer drug combinations. Mol Biosyst. 2015;11:497–505. doi: 10.1039/c4mb00610k. [DOI] [PubMed] [Google Scholar]
- 67.Wu Z, Doondeea JB, Gholami AM, Janning MC, Lemeer S, Kramer K, Eccles SA, Gollin SM, Grenman R, Walch A, Feller SM, Kuster B. Quantitative chemical proteomics reveals new potential drug targets in head and neck cancer. Mol Cell Proteomics. 2011;10:M111 011635. doi: 10.1074/mcp.M111.011635. [DOI] [PMC free article] [PubMed] [Google Scholar]
- 68.Yuan K, Huang Y, Yao X. Illumination of mitotic orchestra during cell division: a Polo view. Cell Signal. 2011;23:1–5. doi: 10.1016/j.cellsig.2010.07.003. [DOI] [PMC free article] [PubMed] [Google Scholar]
- 69.Zabludoff SD, Deng C, Grondine MR, Sheehy AM, Ashwell S, Caleb BL, Green S, Haye HR, Horn CL, Janetka JW, Liu D, Mouchet E, Ready S, Rosenthal JL, Queva C, Schwartz GK, Taylor KJ, Tse AN, Walker GE, White AM. AZD7762, a novel checkpoint kinase inhibitor, drives checkpoint abrogation and potentiates DNA-targeted therapies. Mol Cancer Ther. 2008;7:2955–2966. doi: 10.1158/1535-7163.MCT-08-0492. [DOI] [PubMed] [Google Scholar]
- 70.Zhang L, Zhou Y, Cheng C, Cui H, Cheng L, Kong P, Wang J, Li Y, Chen W, Song B, Wang F, Jia Z, Li L, Yang B, Liu J, Shi R, Bi Y, Zhang Y, Zhao Z, Hu X, Yang J, Li H, Gao Z, Chen G, Huang X, Yang X, Wan S, Chen C, Li B, Tan Y, Chen L, He M, Xie S, Li X, Zhuang X, Wang M, Xia Z, Luo L, Ma J, Dong B, Zhao J, Song Y, Ou Y, Li E, Xu L, Xi Y, Li G, Xu E, Liang J, Guo J, Chen X, Li Q, Liu L, Zhang X, Yang H, Lin D, Cheng X, Guo Y, Zhan Q, Cui Y. Genomic analyses reveal mutational signatures and frequently altered genes in esophageal squamous cell carcinoma. Am J Hum Genet. 2015;96:597–611. doi: 10.1016/j.ajhg.2015.02.017. [DOI] [PMC free article] [PubMed] [Google Scholar]
- 71.Zhao M, Sano D, Pickering CR, Jasser SA, Henderson YC, Clayman GL, Sturgis EM, Ow TJ, Lotan R, Carey TE, Sacks PG, Grandis JR, Sidransky D, Heldin NE, Myers JN. Assembly and initial characterization of a panel of 85 genomically validated cell lines from diverse head and neck tumor sites. Clin Cancer Res. 2011;17:7248–7264. doi: 10.1158/1078-0432.CCR-11-0690. [DOI] [PMC free article] [PubMed] [Google Scholar]
- 72.Zitouni S, Nabais C, Jana SC, Guerrero A, Bettencourt-Dias M. Polo-like kinases: structural variations lead to multiple functions. Nat Rev Mol Cell Biol. 2014;15:433–452. doi: 10.1038/nrm3819. [DOI] [PubMed] [Google Scholar]
Associated Data
This section collects any data citations, data availability statements, or supplementary materials included in this article.
Supplementary Materials
Supplementary Fig. 1. Results of Quality control testing for assessment of reproducibility of drug sensitivity data. Treatment of HNSCC cells is plotted for the two cutoffs used for quality control: CCC greater than 0.8 (left) and location shift less than 0.665 (right).
Supplementary Fig. 2. Treatment with cell-cycle inhibitors inhibits the activity of their substrates in HNSCC cell lines. Cell-cycle inhibitor-sensitive (OSC19) and -resistant (JHU022) HNSCC cell lines were incubated with dimethyl sulfoxide (vehicle control), 1.65 μM AZD1775, 1.2 μM volasertib, or 0.77 μM AZD7762 (Cmax values) for the indicated times. Cells were then lysed and subjected to Western blotting with the indicated primary antibodies.
Supplementary Fig. 3. Similar drug sensitivity of HPV-positive (+) and -negative (−) HNSCC cell lines. Box plots with corresponding p values for the IC80 values (log base 10, μM) for volasertib, AZD7762, and AZD1775 in 50 HPV-negative and 9 HPV-positive HNSCC cell lines are shown.
Supplementary Fig. 4. RAS and AJUBA mutations predict sensitivity of HNSCC cells to treatment with PLK1, CHK1/2, and WEE1 inhibitors in vitro. Box plots with corresponding p values for the AUCs for volasertib, AZD7762, and AZD1775 in the 59 HNSCC cell lines are shown. Mut, mutant; WT, wild-type.
Supplementary Fig. 5. The frequency of specific genetic mutations in HNSCC. (A) The frequency of AJUBA mutations in all cancers tested in The Cancer Genome Atlas (TCGA). (B) The frequency of AJUBA, KRAS, HRAS, SMAD4, and IRS4 mutations in HNSCC cells according to The Cancer Genome Atlas data (accessed using the cBioPortal for Cancer Genomics on October 31, 2016). (C) Venn diagram of all mutations and their relation to drug sensitivity in the 59 HNSCC cell lines.
Supplementary Fig. 6. TP53 mutations do not predict sensitivity of HNSCC to treatment with PLK1, CHK1/2, or WEE1 inhibitors in vitro. Box plots with corresponding p values for the AUCs and IC80 values (log base 10, μM) for volasertib, AZD7762, and AZD1775 in the 59 HNSCC cell lines are shown. Mut, mutant; WT, wild-type.
Supplementary Fig. 7. PLK1 mRNA and functionally associated protein expression levels did not differ in AJUBA-mutant (Mut) and AJUBA-wild-type (WT) HNSCC cell lines. Box plots of expression of the indicated proteins in 52 AJUBA-WT and 7 AJUBA-Mut cell lines along with their p values are shown.
Supplementary Fig. 8. AJUBA overexpression (OE) does not alter PLK1, Bora, or TCTP mRNA expression in HNSCC cells. PCI15B cells transfected with pcDNA (control; empty vector alone) or AJUBA were assayed for mRNA expression using quantitative polymerase chain reaction, and the expression levels were normalized according to control levels. *p < 0.05
Supplementary Fig. 9. Protein expression of PLK1, BORA and AJUBA significantly correlates with volasertib drug sensitivity. Protein expression of PLK1, BORA, AURORA A and AJUBA was determined by western blot in 7 wild type AJUBA and 7 AJUBA mutant cell lines. The blue line represents linear regression and 95% confidence interval is indicated in dark gray.
Supplementary Fig. 10. The mRNA levels of PLK1 and functionally associated proteins did not correlate with sensitivity of HNSCC cells to treatment with the PLK1 inhibitor volasertib. The blue line indicates the linear regression and 95% confidence interval is indicated in dark gray.
Supplementary Fig. 11. HNSCC cell-doubling time correlated only with drug sensitivity to volasertib. Cell-doubling time was compared with drug sensitivity as measured according to the AUC or IC80. The blue lines indicates the linear regression and 95% confidence interval indicated in dark gray.