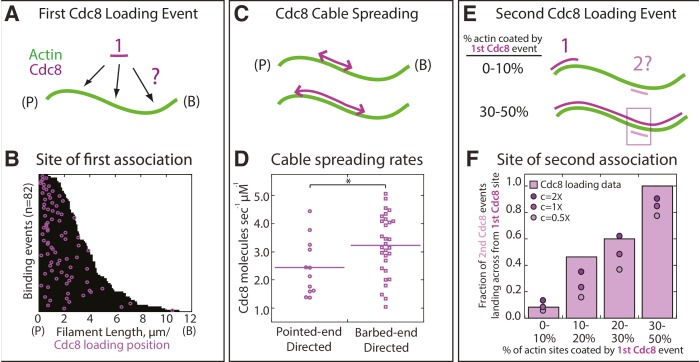
Figure 3. Quantification of loading and spreading of first and second Tropomyosin Cdc8 cables.
Two-color TIRFM of 1.5 μM Mg-ATP actin (15% Alexa 488) with 1.25 μM tropomyosin Cdc8 dimer (Cy5-labeled). (A) Depiction of potential sites for the first Cdc8 loading event. The actin filament and Cdc8 molecule are depicted by green and purple lines, respectively. (B) Plot of the first Cdc8 association event (purple circles) on actin filaments (black lines), with F-actin pointed ends (P) aligned at the left. n = 82 events. (C) Depiction of Cdc8 cable spreading toward the barbed (B) and pointed (P) ends of actin filaments. (D) Spreading rates of Cdc8 cables toward the barbed or pointed end. Purple line denotes mean. Two-tailed t-test for data sets with equal variance yielded p-value *p=0.037. n > 12 elongation events. (E) Depiction of site of second Cdc8 loading event, which can occur at a naked actin site (top cartoon) or across from the first-bound Cdc8 cable (bottom cartoon). The larger percentage of the F-actin surface coated by the initial Cdc8 cable (1) increases the probability that the second Cdc8 cable (2) will associate across from a site already bound by Cdc8. (F) Plot of the fraction of second Cdc8 events that associate with a F-actin site already coated by Cdc8, binned by percentage of F-actin already coated by Cdc8 (light purple bars). n = 38 events. Modeling of predicted degree of association given no indirect cooperativity (c = 1X, purple circles), positive indirect cooperativity (c = 2X, dark purple circles), and negative indirect cooperativity (c = 0.5X, light purple circles).


