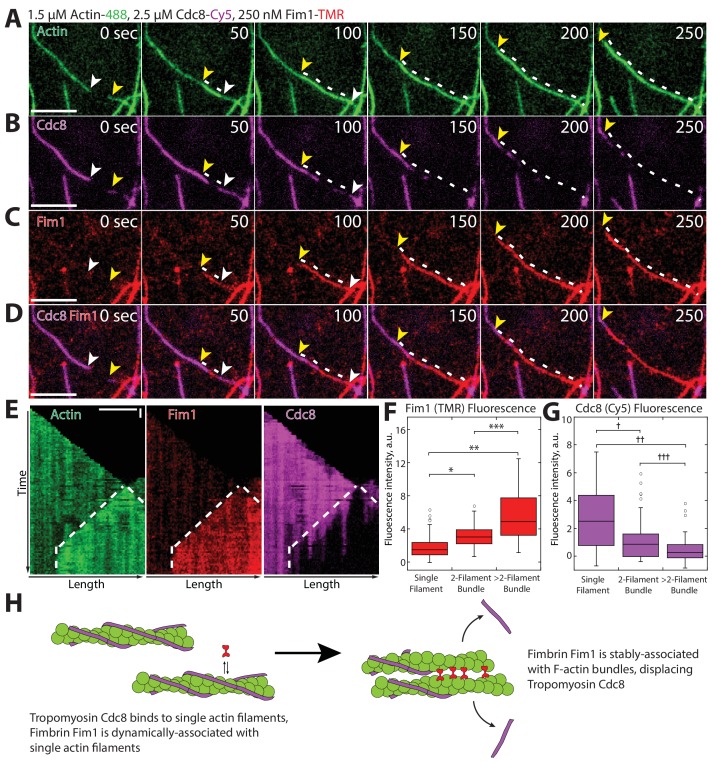
Figure 5. Fimbrin Fim1-mediated bundling induces cooperative removal of Tropomyosin Cdc8.
(A–E) Timelapse of three-color TIRFM of 1.5 μM Mg-ATP actin (15% Alexa 488-labeled) with 2.5 μM tropomyosin Cdc8 (Cy5-labeled) and 250 nM fimbrin Fim1 (TMR-labeled). Arrowheads and dotted line mark actin filament barbed ends and bundled region, respectively. (E) Kymographs of actin, Fim1, and Cdc8 during bundle formation. Dotted lines indicate the bundled region. Scale bars, 5 μm. Time bar, 30 s. (F–G) Box plots of the amount of Fim1-TMR (F) or Cdc8-Cy5 (G) fluorescence on single actin filaments, two-filament bundles, or bundles containing more than two filaments. Open circles indicate outliers. Two-tailed t-tests for data sets with unequal variance yielded p-values: *p-value=4.67 × 10⁻¹⁰, **p-value=4.74 × 10⁻¹¹, ***p-value=1.38 × 10⁻⁵, †p-value=4.52 × 10⁻⁷, ††p-value=1.16 × 10⁻¹², †††p-value=0.01. n > 42 measurements. (H) Cartoon model of how Fim1 and Cdc8 affect each other’s association with single and bundled actin filaments.

