

Abstract
Objective
This study investigates racial disparity in life expectancies (LEs) and life years lost (LYL) associated with multiple obesity-related chronic conditions (OCCs).
Methods
Data from the Medical Expenditure Panel Survey, 2008–2012, were used. Four OCCs were studied: diabetes, hypertension, coronary heart disease (CHD), and stroke. LE for each subpopulation was simulated by Markov modelling. LYL associated with a disease for a subpopulation was computed by taking the difference between LEs for members of that subpopulation without disease and LEs for members of that subpopulation who had that disease. Racial disparities were measured in the absolute differences in LEs and LYL between black women/men and white women/men.
Results
Blacks had higher risks of developing diabetes, hypertension, and stroke. Disparity in LE between whites and blacks was largest in men age 40–49 with at least stroke: blacks lived 3.12 years shorter than whites. Disparity in LYL between whites and blacks was largest in women age 70–79 with at least CHD: blacks had 1.98 years greater LYL than whites.
Conclusions
Racial disparity exists in incident disease and mortality risks, LEs, and LYL associated with multiple OCCs. Efforts targeting subpopulations with large disparities are required to reduce disparities in the burden of multiple OCCs.
Keywords: racial disparity, obesity-related chronic conditions, life expectancy, life years lost
INTRODUCTION
Obesity and multi-morbidity are prevalent in the United States. In fact, more than one in three U.S. adults age ≥20 are obese;1 and more than one in four Americans have multiple concurrent chronic conditions.2 Obesity and multi-morbidity are also costly. It was estimated that 21% of U.S. national health expenditures ($190 billion) were spent treating obesity-related illness in 2005, and U.S. adults age ≥18 with two or more chronic conditions were responsible for 57% of healthcare expenditures in 2012.3
Racial differences in obesity and multi-morbidity are well documented. For example, 47.8% of non-Hispanic blacks age ≥20 were obese, compared to 32.6% of non-Hispanic whites in 2011–2012,1 while 22.4% of non-Hispanic blacks age ≥18 had at least two chronic conditions, compared to 28.5% of non-Hispanic whites in 2009.4 Seemingly contradictory statistics such as these make clear the importance of further investigation on racial disparity at the intersection of obesity and multi-morbidity.
According to the 2011 U.S. Life Tables, LE at birth for the black population was 3.7 years lower than that for the white population,5 although this gap has decreased from 7.6 years in 1970.6 Major leading causes of death contributing to this gap included heart disease, cancer, homicide, diabetes, and perinatal conditions,6 among which heart disease and diabetes are obesity-related chronic conditions (OCCs).
The primary objective of this study is to investigate racial disparities in the prevalence of multiple OCCs, risks of developing multiple OCCs and mortality, life expectancies (LEs), and life years lost (LYL) associated with these OCCs in the U.S. general population age ≥40. We sought to study the combined disparities resulting from both biological and socioeconomic differences by race.
METHODS
Data
We used data from the Household Component (HC) Full Year Consolidated Data of the Medical Expenditure Panel Survey (MEPS), 2008–2012, the most recent five-year data available at the time of this study. The MEPS is a survey that provides nationally representative estimates of healthcare use, expenditures, sources of payment, and insurance coverage for the U.S. civilian noninstitutionalized population.7 The HC data are based on questionnaires given to individual household members and their medical providers.7 MEPS-HC data were used to form the analytic cohort, to estimate disease risks, and to simulate LEs.
To estimate mortality risk, we used data from the National Health Interview Survey (NHIS), 1988–2008, and merged the NHIS Sample Adult Files with the NHIS-Linked Mortality Public-use Files,8 which provide mortality follow-up data through December 31, 2011.9 The NHIS is a multi-purpose health survey providing information on the health of the civilian, noninstitutionalized, household population of the United States.10 The sampling frame of the MEPS-HC is drawn from the respondents to the NHIS.11
Race
We used the RACEX variable in the MEPS-HC for years 2008–2011, and the RACEV1X variable for year 2012 to create the race variables in our study. White/Black included people who reported themselves as white/black, with no other race reported. Other included all other respondents.
Target diseases
The OCCs addressed in our study were diabetes, hypertension, CHD, and stroke. They are the most common chronic conditions for Medicare beneficiaries,12 they are also among the 20 chronic conditions defined by the U.S. Department of Health and Human Services Interagency Workgroup on Multiple Chronic Conditions, and their data are available in the MEPS.13 In MEPS-HC, respondents who answered “Yes” to the following question were classified as having the disease: “Have you ever been told by a doctor or health professional that you have diabetes/hypertension/CHD/stroke?” Individuals who reported having a disease were then asked their age at first diagnosis.
Other variables
Individuals’ age was obtained in the MEPS-HC from AGE[year]X variables, which represents the exact age, calculated from date of birth and indicates age status as of the end of the corresponding year. Pregnancy status was obtained from PREGNTX variables, for which respondents were asked if she had been pregnant during the round; and cancer diagnosis was obtained from CANCERDX, which ascertained whether the person who answered the question had ever been diagnosed as having cancer or a malignancy of any kind. We used the BMINDX53 variable in the MEPS-HC to obtain body mass index (BMI) data computed from self-reported height and weight data. We then categorized into normal weight: BMI 18.5–24.9, overweight: BMI 25–29.9, and obese: BMI ≥30.14
Study population
We pooled 5-years of data from the MEPS-HC, following the analytic guidelines.15 Excluding non-respondents, we had a sample with a size of 168,214 (n=168,214) (Figure 1). The non-response rate in the MEPS-HC was 59.3% for year 2008, 57.2% for year 2009, 53.5% for year 2010, 54.9% for year 2011, and 56.3% for year 2012, and was adjusted for in the weight variables.16 We restricted our sample to adults age 40–84 (n=67,683), because these OCCs are more prevalent in the middle-aged population and age in the MEPS was top-coded at 85 years.17 We included people who were not pregnant at the time of survey (n=67,515) and did not have any cancer diagnosis (n=59,190).18,19 Moreover, we only kept individuals with a BMI ≥18.5 (n=56,811). We then excluded individuals who reported age of target disease diagnosis older than their age at survey or age of target disease diagnosis <18 (n=54,664), as well as people who used insulin to treat diabetes before age 30 if they had diabetes (n=54,635).20 This latter criterion was an attempt to exclude people with type-1 diabetes, because the peak age for diagnosis is in the mid-teens.21
Figure 1. Data attrition diagram.
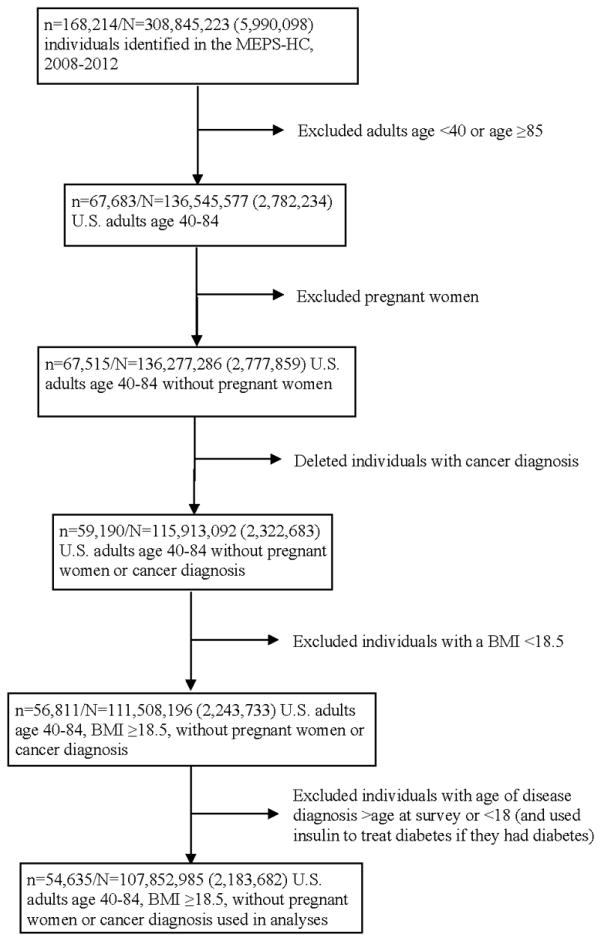
MEPS-HC: Household Component Full Year Consolidated Data Files of the Medical Expenditure Panel Survey; n: sample size; N: estimated population size. Standard deviations are in parentheses.
The analytic cohort contained 54,635 individuals, representing 107,852,985 (SD=2,183,682) people of the average annual population size for the pooled period, 2008–2012.15 We assumed that this cohort represents the 2010 U.S. population age 40–84.
Risks of diseases and mortality
We adopted a previously published method to estimate the disease22 and mortality risks.23 Specifically, we used the analytic cohort assembled from the MEPS-HC and estimated the probabilities of developing any one of the four OCCs by fitting a gender-specific exponential survival function (shown below), controlling for age at survey (40–49, 50–59, 60–69, ≥70), race (White, Black, Other), BMI category (normal weight, overweight, obese), and pre-existing comorbidities, their duration, and their duration squared.
where x′ is a vector of covariates as described above; β is a vector of parameters to be estimated; and t is time to event or censoring. Using the estimation of the probability of developing diabetes as an example, t is age at diabetes diagnosis or age at survey, if no reported diabetes diagnosis. The probability of developing diabetes at age t was derived from the estimated S(t).
We used the same survival function to estimate mortality risks. However, because mortality data for the analytic cohort is not available, we used data from the NHIS, 1988–2008, with mortality follow-up through December 31, 2011, as described in the Data section. Merging this data with the NHIS-Linked Mortality Public-use Files and using the same exclusion criteria for our study population on the available NHIS variables, we estimated the probabilities of all-cause mortality by fitting the gender-specific exponential survival function as described above, controlling for age, race, BMI category, comorbidities, and survey year. In this survival function, t is age at death or age at the end of 2011, if no death was recorded. We then projected the mortality probabilities for the 2010 U.S. population.
Although the objective of this study was to focus on the combined black-white disparities resulting from both biological and socioeconomic differences, to explore the change in relative risks for developing a target disease between blacks and whites when socioeconomic factors were taken into account, we additionally controlled for income (1st quartile in 2012$: <$11,719, 2nd quartile: $11,719–<$25,738, 3rd quartile: $25,738–<$48,461, 4th quartile: ≥$48,461), education (no degree, general equivalency diploma, high school, bachelor, master and up, other degree), and health insurance (uninsured, private, medicaid, medicare, other public). Similarly, for mortality risk estimation, we additionally controlled for income ($1–$14,999, $15,000–$34,999, $35,000–$54,999, ≥$55,000, unknown), education (no degree, general equivalency diploma, high school, bachelor, master and above, other degree), and health insurance (uninsured, private, medicaid, medicare, other public, unknown). We present these results in Appendix.
Prediction of LEs for the 2010 U.S. population
We constructed a Markov model with 17 mutually exclusive health states (well, combination of all four diseases, dead). The corresponding transition matrix was populated by the estimated probabilities of developing diseases and the projected mortality probabilities described in the previous section. LEs for whites, blacks, and other race at ages 40, 50, 60, and 70 in the 2010 population generated from our analytic cohort were simulated and then calibrated to match those in the United States Life Tables, 2010.24
The calibrated Markov model was then used to predict LEs for the 2010 U.S. population, divided into 72 subpopulations based on age (40–49, 50–59, 60–69, 70–79), gender, race, and BMI category. Bootstraps were performed 500 times to obtain means and standard errors.
Racial disparities in LEs as well as LYL associated with OCCs
We computed the racial disparity in LEs by subtracting the LE of a black population (LEB) from that of its white counterpart (LEW), i.e., LEW-LEB. We computed LYL associated with a given combination of the OCCs for a population by taking the difference between LEs for members of that population without any of the four diseases (LEno OCC) and LEs for members of that population who had that combination of diseases (LEOCC), i.e., LYLOCC = LEno OCC − LEOCC. We then computed the racial disparity in LYL by LYLOCCB − LYLOCCW. A positive number for the disparities in LEs and LYL indicates that the white population has an advantage over the black population.
Statistical analyses
Following the analytic guidelines provided with the datasets,11,15,25,26 we pooled multiple years of the data and adjusted for the complex sampling designs in all estimations and simulations.
For unadjusted analyses, demographic differences between races were tested using χ2-tests. For adjusted analyses, t-tests were used to determine differences between races. Differences in LE between whites and blacks were tested using t-tests with unequal variance. All tests were two-sided. Statistical significance was determined using α=0.05.
STATA/SE 11.2 (StataCorp, College Station, TX) was used to obtain estimates of disease/mortality risks, and MATLAB R2015a (MathWorks, Natick, MA) was used to perform simulations and bootstraps.
RESULTS
The population contained 87,864,620 (SD=2,050,771) whites, 12,330,178 (SD=650,944) blacks, and 7,658,187 (SD=620,536) people of other race age 40–84 (Table 1). Individuals with obesity accounted for 33.4% of the white population, compared to 44.3% of the black population. For OCCs, 14.1% of whites reported having at least two of the four OCCs, compared to 21.7% of blacks. For all racial groups, hypertension was the most prevalent OCC: 40.6% of whites and 56.8% of blacks had at least hypertension (hypertension+), followed by diabetes+ (White: 11.3% and Black: 18.4%), CHD+ (White: 7.1% and Black: 6.5%), and stroke+ (White: 3.9% and Black: 6.1%). Particularly, 11.2% of whites, compared to 16.8% of blacks, had two of the OCCs; 2.5% of whites, compared to 4.3% of blacks, had three of the OCCs; 0.4% of whites, compared to 0.7% of blacks, had all four OCCs.
Table 1.
Characteristics of the 2010 U.S. population age 40–84 by race (n=54,635; N=107,852,985)
| White | Black | Other | p-value | |
|---|---|---|---|---|
| Sample size | 38,076 | 10,926 | 5,633 | |
|
| ||||
| Population size | 87,864,620 | 12,330,178 | 7,658,187 | |
|
| ||||
| (standard deviation) | (2,050,771) | (650,944) | (620,536) | |
|
| ||||
| Population (%) | 81.47 | 11.43 | 7.10 | |
|
| ||||
| Men (%) | 49.67 | 45.00 | 47.13 | <.0001 |
|
| ||||
| Age (%) | <.0001 | |||
| 40–49 years | 33.22 | 37.00 | 37.84 | |
| 50–59 years | 32.99 | 34.10 | 32.54 | |
| 60–69 years | 20.77 | 19.09 | 17.66 | |
| ≥70 years | 13.03 | 9.82 | 11.96 | |
|
| ||||
| BMI category (%) | <.0001 | |||
| Normal weight | 28.41 | 19.67 | 47.71 | |
| Overweight | 38.17 | 36.05 | 33.98 | |
| Obese | 33.42 | 44.28 | 18.31 | |
|
| ||||
| Health state (%) | <.0001 | |||
| No OCCs | 54.44 | 39.66 | 54.57 | |
| Diabetes only | 2.48 | 2.36 | 3.84 | |
| Hypertension only | 26.98 | 35.28 | 25.25 | |
| CHD only | 1.19 | 0.51 | 0.82 | |
| Stroke only | 0.79 | 0.46 | 0.54 | |
| Diabetes+hypertension | 6.12 | 11.65 | 8.43 | |
| Diabetes+CHD | 0.22 | 0.12 | 0.12 | |
| Diabetes+stroke | 0.10 | 0.04 | 0.13 | |
| Hypertension+CHD | 3.28 | 2.44 | 1.95 | |
| Hypertension+stroke | 1.42 | 2.47 | 0.75 | |
| CHD+stroke | 0.09 | 0.04 | 0.06 | |
| Diabetes+hypertension+stroke | 0.53 | 1.60 | 0.71 | |
| Diabetes+hypertension+CHD | 1.43 | 1.91 | 1.79 | |
| Diabetes+CHD+stroke | 0.08 | 0.01 | 0.00 | |
| Hypertension+CHD+stroke | 0.48 | 0.72 | 0.40 | |
| Diabetes+hypertension+CHD+stroke | 0.39 | 0.73 | 0.63 | |
|
| ||||
| At least hypertension | 40.63 | 56.80 | 39.91 | <.0001 |
|
| ||||
| At least diabetes | 11.33 | 18.43 | 15.66 | <.0001 |
|
| ||||
| At least CHD | 7.14 | 6.48 | 5.78 | <.0001 |
|
| ||||
| At least stroke | 3.88 | 6.07 | 3.23 | <.0001 |
|
| ||||
| Number of OCCs (%) | <.0001 | |||
| No OCCs | 54.44 | 39.66 | 54.57 | |
| 1 OCC | 31.44 | 38.61 | 30.44 | |
| 2 OCCs | 11.21 | 16.76 | 11.45 | |
| 3 OCCs | 2.52 | 4.25 | 2.90 | |
| 4 OCCs | 0.39 | 0.73 | 0.63 | |
| 0–1 OCC (%) | 85.88 | 78.27 | 85.02 | |
| 2–3 OCCs (%) | 13.73 | 21.00 | 14.35 | |
| ≥2 OCCs (%) | 14.12 | 21.73 | 14.98 | |
n: sample size; N: population size; BMI: body mass index; OCC: obesity-related chronic condition; CHD: coronary heart disease. Boldface indicates statistical significance (p <0.05).
In the multivariable adjusted analyses, compared to whites (Figure 2), blacks had higher risks of developing diabetes (men: HR, 1.46 [95% CI, 1.31–1.63]; women: HR, 1.63 [95% CI, 1.47–1.81]), hypertension (men: HR, 1.28 [95% CI, 1.22–1.35]; women: HR, 1.56 [95% CI, 1.49–1.64]), and stroke (men: HR, 1.88 [95% CI, 1.46–2.42]; women: HR, 1.49 [95% CI, 1.26–1.78]). Black men had nonsignificant lower risks of developing CHD (HR, 0.85 [95% CI, 0.72–1.01]), and black women had nonsignificant higher risks of developing CHD (HR, 1.14 [95% CI, 0.94–1.38]). In terms of mortality, blacks had higher risks (men: HR, 1.26 [95% CI, 1.21–1.31]; women: HR, 1.11 [95% CI, 1.07–1.15]). When additionally controlling for income, education, and health insurance (see Appendix Figure S1), the disparities in the disease and mortality risks decreased in scale (but still statistically significant), except for CHD – black men had marginally significant lower risks of developing CHD (HR, 0.81 [95% CI, 0.67–0.99]), and black women had nonsignificant higher risks of developing CHD (HR, 1.09 [95% CI, 0.90–1.34]).
Figure 2. Racial disparities in disease and mortality risks: Hazard ratios and 95% confidence intervals for developing diabetes, hypertension, CHD, or stroke and for mortality (Reference group: whites).

Hazard ratios for each disease were obtained from multivariable adjusted survival analysis, controlling for age, race, BMI category, and pre-existing comorbidities, their duration, and their duration squared. Hazard ratios for mortality were obtained from multivariable adjusted survival analysis, controlling for age, race, BMI category, comorbidities, and survey year.
Overall, whites had advantages over blacks in LEs (Figure 3A). These advantages decreased by age; by age 70–79, blacks had advantages in LEs over whites for women. Stratifying by disease, disparities in LE between the white and the black populations (LEW-LEB) ranged from −1.60 years for women age 70–79 without OCCs to 3.12 years for men age 40–49 with stroke+. All of these disparities were statistically significant (see Appendix Table S1). The white advantage in LE in men age 40–49 with stroke+ was driven by the disparity in LE for men age 40–49 with diabetes, hypertension, and stroke (5.16 years, see Appendix Table S3 and Figure S2A), the largest disparity when stratified by health state. The second largest white advantage in LE was men age 50–59 with CHD+ (2.82 years, Figure 3A).
Figure 3. Racial disparities in life expectancies and life years lost associated with OCCs by disease.

A. Disparity in life expectancies (LEW-LEB)
See Appendix Table S1 for detailed numbers and statistics.
B. Disparity in life years lost (LYLB-LYLW)
See Appendix Table S2 for detailed numbers and statistics.
Disparities in LYL associated with at least one of these OCCs are presented in Figure 3B. Whites had advantages in LYL in men age 40–49 (except for men age 40–49 with CHD+ or diabetes+), women and men age 60–69, and women age 70–79. Disparities in LYL between the white and the black populations (LYLB-LYLW) ranged from −1.34 years for men age 70–79 with CHD+ to 1.98 years for women age 70–79 with CHD+. All of these disparities were statistically significant (see Appendix Table S2). The white advantage in this latter population was possibly driven by the large disparity for this gender-age population with diabetes, CHD, and stroke (4.51 years, see Appendix Table S4 and Figure S2B) and with CHD only (2.47 years, Appendix Table S4). The second largest white advantage in LYL was women age 70–79 with hypertension+ (1.34 years, Figure 3B). The largest black advantages were people with CHD+: men age 70–79 (−1.34 years) and men age 40–49 (−1.20 years).
DISCUSSION
We investigated racial disparities in the prevalence of multiple OCCs (diabetes, hypertension, CHD, and stroke), and disease and mortality risks in the U.S. general population age ≥40. Furthermore, we computed racial disparities in LEs and LYL associated with multiple OCCs and found that consistent disparities existed between blacks and whites.
Our findings are consistent with previous literature in that compared to whites, blacks had higher prevalence and risks for obesity and OCCs, including hypertension, diabetes, and stroke,1,27–30 but not for CHD.31,32 For the latter, using a prospective cohort study, Safford and colleagues found that black men had a lower risk but black women had a higher, but non-significant, risk for incident nonfatal CHD than their white counterparts,32 which is consistent with our findings.
Using the NHIS data and targeting five other chronic diseases in addition to the four OCCs in our study, Ward and Schiller showed that ~33% of non-Hispanic whites age 45–64 and ~62% age ≥65 had ≥2 chronic conditions,13 compared to 14% of whites age ≥40 with ≥2 OCCs in our study. They also showed that ~43% of non-Hispanic blacks age 45–64 and ~67% age ≥65 had ≥2 chronic diseases,13 compared to 22% of blacks age ≥40 with ≥2 OCCs in our study. Although the prevalence of multiple chronic conditions is higher in their study due to additional diseases not related to obesity, they also do find a disparity in the prevalence of multiple chronic conditions.
We found disparities between blacks and whites in LEs. Compared to blacks, whites had longer LEs in younger populations (age 40–69) and male populations (all age groups). The advantage in LE for white women diminished by age, which is consistent with the pattern in the 2010 U.S. life tables,24 but the white advantage in LE for older women disappeared in those 70–79 in our study, while this disparity disappeared at age 80 in the 2010 U.S. life tables.24 This difference could be attributed to the fact that we focused on disease burden in estimating LEs, which relates to the distribution of populations with diseases.
Disparities between blacks and whites were also observed in LYL, but the magnitude was smaller and the pattern was less consistent than that exhibited in LEs. In fact, whites had more LYL than blacks in most combinations of disease status. However, large advantages in LYL for whites were present in women age 70–79. This can be largely attributed to longer LE for blacks than whites without OCCs and shorter LE for blacks with at least CHD in this gender-age population.
Our findings show that the racial disparity in LE for populations with at least hypertension was 1.92 years for women and 2.32 years for men age 40–49, and given that this disparity decreased with age, this disparity would be larger than these two estimates for women and men age 20–29, compared to 1.80 years for people age 25 estimated by Wong and colleagues.33 Our racial disparities were estimated as an overall combination of biological and socioeconomic factors, while theirs was measured adjusting for education (despite this their racial disparity was still a combined estimate of socioeconomic factors, other than educational attainment), which is smaller than ours. Furthermore, they showed that this disparity would decrease to 1.57 years if hypertension were to be eliminated as a cause of death, and this decrease in the disparity in LE, calculated as (LEB-LEBno hypertension)-(LEW-LEWno hypertension), would be 0.23 years. We found that LYL associated with hypertension was −0.37 years for women age 40–49 and 0.04 years for men age 40–49. Extending to age 20–29, we expect that LYL associated with hypertension for blacks would be less than that for whites, indicating a black advantage. This deviation can be explained by the following. First, their computation of the change in the disparity in LE is only conceptually similar to our method, and is calculated using a different formula. Second, they used a simulated population of individuals all starting at age 25 and truncated at age 75. This truncation eliminates the likelihood of whites living past 75 more often than blacks;34 instead we used the population represented by the data to simulate LE, and our simulations reflect this likelihood. Third, our study captured the indirect effect of hypertension in that it increases the risks of other diseases, which increase the risk of mortality.
This study is the first to investigate racial disparity in the prevalence of and outcomes related to multiple OCCs in the U.S. general population. Our study was not designed to identify biological racial differences. Rather, we aimed to combine both socioeconomic and biological differences in the racial disparities we estimated. Therefore, we chose not to include socioeconomic variables in our analyses, because socioeconomic status may be along a causal pathway that links race and health and we may not get a full picture of the extent of the disparity by controlling for it.35,36
Our study is restrained by the following limitations. First, our racial groups did not take ethnicity into account, because adding ethnicity will divide our racial groups into >3 racial/ethnic groups and hence result in no individuals (data) for many age-gender-race/ethnicity-BMI category subpopulations with different health states. We evaluated potential solutions, including pooling more years of data or dividing age into <4 groups. For the former, age of diagnosis for the target conditions was not available in the MEPS data until 2008; for the latter, since the development of multiple chronic conditions are highly correlated with age, the drawback of reducing the number of age groups was evaluated to outweigh the benefit of adding ethnicity. Therefore, we kept three racial groups and focused on black-white comparison. Nonetheless, we recognize the potential impact of not separating out Hispanic origin populations. Upon checking, we found that 14.2% of the white population and 1.8% of the black population derived from our analytic cohort were Hispanic. The impact would not be negligible if Hispanic whites were significantly different from those of non-Hispanic whites. Second, like all other studies using national data, the data are self-reported. Although studies have shown that self-reported data are reasonably accurate,37–39 the estimates could be biased due to non-random reporting error. Third, we only included four OCCs due to limited availability of other diseases in the data, which could result in overestimated disease burdens, although the bias arising from including four conditions is smaller than the bias reported in studies only targeting one disease. Fourth, the data did not allow us to differentiate the type of diseases, e.g., type-1 or type-2 diabetes. Last, our results were limited to individuals with diagnosed diseases. For example, studies have estimated that ~3.7 million Americans had undiagnosed diabetes in 2010, and blacks were more likely to have undiagnosed diabetes and prediabetes.40
CONCLUSION
Our study provides evidence that disparities between blacks and whites in the prevalence and risks of and outcomes related to multiple obesity-related chronic conditions continue to exist. Although public health initiatives have sought to narrow the gap, more efforts will be needed to eliminate these disparities. Given limited resources, to eliminate these disparities, higher priority should be given to those populations with large disparities.
Supplementary Material
Figure S1 Racial disparities in disease and mortality risks additionally controlling for income, education, and insurance: hazard ratios and 95% confidence intervals for developing diabetes, hypertension, CHD, or stroke and for mortality (Reference group: whites)
Table S1. Racial disparity in life expectancies by disease (LEW-LEB)
Table S2. Racial disparity in life years lost by disease (LYLB-LYLW)
Figure S2 Racial disparities in life expectancies by health state and racial disparities in life years lost by disease combination
Table S3. Racial disparity in life expectancies (LEs) by health state (LEW-LEB)
Table S4. Racial disparity in life years lost (LYL) by disease combination (LYLB-LYLW)
What is already known about this subject?
Obesity and multi-morbidity are prevalent in the United States.
Obesity and multi-morbidity have significant health consequences and are costly.
Racial disparities in multi-morbidity and in obesity exist.
What does this study add?
Racial disparities exist in incident disease and mortality risks associated with multiple obesity-related chronic conditions.
Racial disparities exist in life expectancies associated with having multiple obesity-related chronic conditions.
Racial disparities exist in life years lost associated with having multiple obesity-related chronic conditions.
Acknowledgments
Disclaimer: The conclusions and opinions presented herein are solely the responsibility of the authors and do not necessarily represent the official views of the Foundation for Barnes-Jewish Hospital, the National Institutes of Health, the Agency for Healthcare Research and Quality, or American Cancer Society.
Prior presentations: None.
Footnotes
Financial disclosure: No financial disclosures were reported by the authors of this paper.
Conflict of interest/Funding: The Foundation for Barnes-Jewish Hospital and the National Institutes of Health Grant U54 CA155496 supported this research. S-H. Chang is supported by the Agency for Healthcare Research and Quality Grant K01 HS022330. She has no financial disclosures. G.A. Colditz is supported by the American Cancer Society Clinical Research Professorship. He has no financial disclosures. Yao-Chi Yu has no financial disclosures. Nils P. Carlsson has no financial disclosures. Xiaoyan Liu has no financial disclosures. These sponsors had no role in the design of the study; the collection, management, analysis, and interpretation of the data; and the decision to approve publication of the finished manuscript.
Contributors: Dr. Chang had full access to all of the data in the study and takes responsibility for the integrity of the data and the accuracy of the data analysis.
Study concept and design: Chang
Analysis and interpretation of data: Chang, Yu, Carlsson, Liu, Colditz
Drafting of the manuscript: Chang, Carlsson
Critical revision of the manuscript for important intellectual content: Chang, Yu, Carlsson, Liu, Colditz
Statistical expertise: Chang, Liu
Obtained funding: Chang, Colditz
Administrative, technical, or material support: Chang, Carlsson, Colditz
Study supervision: Chang, Colditz
References
- 1.Flegal KM, Carroll MD, Kit BK, Ogden CL. Prevalence of obesity and trends in the distribution of body mass index among US adults, 1999–2010. JAMA. 2012 Feb 1;307(5):491–497. doi: 10.1001/jama.2012.39. [DOI] [PubMed] [Google Scholar]
- 2.Anderson G. [Accessed January 6, 2016];Chronic Care: Making the Case for Ongoing Care. 2010 http://www.rwjf.org/content/dam/farm/reports/reports/2010/rwjf54583.
- 3.Chevarley FM. Health Expenditures for Adults by Number of Treated Chronic Conditions, Race/Ethnicity, and Age, 2012. [Accessed January 11, 2016];Statistical Brief #485. 2015 http://meps.ahrq.gov/mepsweb/data_files/publications/st485/stat485.pdf. [PubMed]
- 4.Machlin SR, Soni A. Health care expenditures for adults with multiple treated chronic conditions: estimates from the Medical Expenditure Panel Survey, 2009. Preventing chronic disease. 2013;10:E63. doi: 10.5888/pcd10.120172. [DOI] [PMC free article] [PubMed] [Google Scholar]
- 5.Arias E. United States Life Tables, 2011. National vital statistics reports : from the Centers for Disease Control and Prevention, National Center for Health Statistics, National Vital Statistics System. 2015 Sep 22;64(11):1–63. [PubMed] [Google Scholar]
- 6.Kochanek KD, Arias E, Anderson RN. How did cause of death contribute to racial differences in life expectancy in the United States in 2010? NCHS Data Brief. 2013 Jul;(125):1–8. [PubMed] [Google Scholar]
- 7.Cohen JW, Cohen SB, Banthin JS. The medical expenditure panel survey: a national information resource to support healthcare cost research and inform policy and practice. Med Care. 2009 Jul;47(7 Suppl 1):S44–50. doi: 10.1097/MLR.0b013e3181a23e3a. [DOI] [PubMed] [Google Scholar]
- 8.Centers for Disease Control and Prevention. Analytic Guidelines for National Center for Health Statistics 2011 Linked Mortality Files. 2015 http://www.cdc.gov/nchs/data/datalinkage/2011_linked_mortality_analytic_guidelines.pdf.
- 9.National Center for Health Statistics. Office of Analysis and Epidemiology, Public-use Linked Mortality File. http://www.cdc.gov/nchs/data_access/data_linkage/mortality/data_files_data_dictionaries.htm.
- 10.National Center for Health Statistics. [Accessed December 29, 2013];National Health Interview Survey: The principal source of information on the health of the U.S. population. https://www.cdc.gov/nchs/data/nhis/brochure2010january.pdf.
- 11.Agency for Healthcare Research and Quality. [Accessed January 11, 2016];MEPS-HC Panel Design and Data Collection Process. http://meps.ahrq.gov/mepsweb/survey_comp/hc_data_collection.jsp.
- 12.Centers for Medicare and Medicaid Services. Chronic Conditions Among Medicare Beneficiaries: 2012 Edition. 2012 http://www.cms.gov/Research-Statistics-Data-and-Systems/Statistics-Trends-and-Reports/Chronic-Conditions/Downloads/2012Chartbook.pdf.
- 13.Ward BW, Schiller JS. Prevalence of multiple chronic conditions among US adults: estimates from the National Health Interview Survey, 2010. Preventing chronic disease. 2013;10:E65. doi: 10.5888/pcd10.120203. [DOI] [PMC free article] [PubMed] [Google Scholar]
- 14.Obesity: preventing and managing the global epidemic. Report of a WHO consultation. World Health Organ Tech Rep Ser. 2000;894:i–xii. 1–253. [PubMed] [Google Scholar]
- 15.Agency for Healthcare Research and Quality. 1996–2012 Pooled Linkage Variance Estimation File. 2014 http://meps.ahrq.gov/data_stats/download_data/pufs/h36/h36u12doc.pdf.
- 16.Agency for Healthcare Research and Quality. MEPS-HC Response Rates by Panel. https://meps.ahrq.gov/survey_comp/hc_response_rate.jsp.
- 17.Agency for Healthcare Research and Quality. Medical Expenditure Panel Survey HC-138: 2010 Full Year Consolidated Data File. 2012 http://meps.ahrq.gov/data_stats/download_data/pufs/h138/h138doc.shtml#252Navigating.
- 18.Chang S-H, Pollack LM, Colditz GA. Obesity, mortality, and life years lost associated with breast cancer in nonsmoking US Women, National Health Interview Survey, 1997–2000. Preventing chronic disease. 2013;10:E186. doi: 10.5888/pcd10.130112. [DOI] [PMC free article] [PubMed] [Google Scholar]
- 19.Chang S-H, Pollack LM, Colditz GA. Life Years Lost Associated with Obesity-Related Diseases for U.S. Non-Smoking Adults. PloS one. 2013;8(6):e66550. doi: 10.1371/journal.pone.0066550. [DOI] [PMC free article] [PubMed] [Google Scholar]
- 20.Zhuo X, Zhang P, Barker L, Albright A, Thompson TJ, Gregg E. The lifetime cost of diabetes and its implications for diabetes prevention. Diabetes Care. 2014 Sep;37(9):2557–2564. doi: 10.2337/dc13-2484. [DOI] [PubMed] [Google Scholar]
- 21.Centers for Disease Control and Prevention. [Accessed April 15, 2015];National Diabetes Statistics Report. 2014 http://www.cdc.gov/diabetes/pubs/statsreport14/national-diabetes-report-web.pdf.
- 22.Leung MY, Carlsson NP, Colditz GA, Chang S-H. The burden of obesity on diabetes in the United States: Medical Expenditure Panel Survey, 2008–2012. Value in Health. 2016 doi: 10.1016/j.jval.2016.08.735. (In press) [DOI] [PMC free article] [PubMed] [Google Scholar]
- 23.Leung MY, Pollack LM, Colditz GA, Chang S-H. Life years lost and lifetime health care expenditures associated with diabetes in the U.S., National Health Interview Survey, 1997–2000. Diabetes Care. 2015 Mar;38(3):460–468. doi: 10.2337/dc14-1453. [DOI] [PMC free article] [PubMed] [Google Scholar]
- 24.Arias E. United States life tables, 2010. National vital statistics reports : from the Centers for Disease Control and Prevention, National Center for Health Statistics, National Vital Statistics System. 2014 Nov;63(7):1–63. [PubMed] [Google Scholar]
- 25.National Center for Health Statistics. Office of Analysis and Epidemiology, Public-use Linked Mortality File. 2015 http://www.cdc.gov/nchs/data_access/data_linkage/mortality/data_files_data_dictionaries.htm.
- 26.Centers for Disease Control and Prevention. Analytic Guidelines for National Center for Health Statistics 2011 Linked Mortality Files. 2015 http://www.cdc.gov/nchs/data/datalinkage/2011_linked_mortality_analytic_guidelines.pdf.
- 27.Hertz RP, Unger AN, Cornell JA, Saunders E. Racial disparities in hypertension prevalence, awareness, and management. Arch Intern Med. 2005 Oct 10;165(18):2098–2104. doi: 10.1001/archinte.165.18.2098. [DOI] [PubMed] [Google Scholar]
- 28.Jones DW, Hall JE. Racial and ethnic differences in blood pressure: biology and sociology. Circulation. 2006 Dec 19;114(25):2757–2759. doi: 10.1161/CIRCULATIONAHA.106.668731. [DOI] [PubMed] [Google Scholar]
- 29.Kramer H, Han C, Post W, et al. Racial/ethnic differences in hypertension and hypertension treatment and control in the multi-ethnic study of atherosclerosis (MESA) Am J Hypertens. 2004 Oct;17(10):963–970. doi: 10.1016/j.amjhyper.2004.06.001. [DOI] [PubMed] [Google Scholar]
- 30.Mozaffarian D, Benjamin EJ, Go AS, et al. Heart disease and stroke statistics--2015 update: a report from the American Heart Association. Circulation. 2015 Jan 27;131(4):e29–322. doi: 10.1161/CIR.0000000000000152. [DOI] [PubMed] [Google Scholar]
- 31.Keil JE, Sutherland SE, Knapp RG, Lackland DT, Gazes PC, Tyroler HA. Mortality rates and risk factors for coronary disease in black as compared with white men and women. N Engl J Med. 1993 Jul 8;329(2):73–78. doi: 10.1056/NEJM199307083290201. [DOI] [PubMed] [Google Scholar]
- 32.Safford MM, Brown TM, Muntner PM, et al. Association of race and sex with risk of incident acute coronary heart disease events. JAMA. 2012 Nov 7;308(17):1768–1774. doi: 10.1001/jama.2012.14306. [DOI] [PMC free article] [PubMed] [Google Scholar]
- 33.Wong MD, Shapiro MF, Boscardin WJ, Ettner SL. Contribution of major diseases to disparities in mortality. N Engl J Med. 2002 Nov 14;347(20):1585–1592. doi: 10.1056/NEJMsa012979. [DOI] [PubMed] [Google Scholar]
- 34.National Center for Health Statistics. [Accessed March 14, 2016];Vital Statistics of the United States, 1990. 1994 http://www.cdc.gov/nchs/data/lifetables/life90_2acc.pdf.
- 35.Bharmal N, Tseng CH, Kaplan R, Wong MD. State-level variations in racial disparities in life expectancy. Health services research. 2012 Feb;47(1 Pt 2):544–555. doi: 10.1111/j.1475-6773.2011.01345.x. [DOI] [PMC free article] [PubMed] [Google Scholar]
- 36.Hebert PL, Sisk JE, Howell EA. When does a difference become a disparity? Conceptualizing racial and ethnic disparities in health. Health Aff (Millwood) 2008 Mar-Apr;27(2):374–382. doi: 10.1377/hlthaff.27.2.374. [DOI] [PubMed] [Google Scholar]
- 37.Margolis KL, Lihong Q, Brzyski R, et al. Validity of diabetes self-reports in the Women’s Health Initiative: comparison with medication inventories and fasting glucose measurements. Clinical trials. 2008;5(3):240–247. doi: 10.1177/1740774508091749. [DOI] [PMC free article] [PubMed] [Google Scholar]
- 38.Vargas CM, Burt VL, Gillum RF, Pamuk ER. Validity of self-reported hypertension in the National Health and Nutrition Examination Survey III, 1988–1991. Preventive medicine. 1997 Sep-Oct;26(5 Pt 1):678–685. doi: 10.1006/pmed.1997.0190. [DOI] [PubMed] [Google Scholar]
- 39.McAdams MA, Van Dam RM, Hu FB. Comparison of self-reported and measured BMI as correlates of disease markers in US adults. Obesity (Silver Spring) 2007 Jan;15(1):188–196. doi: 10.1038/oby.2007.504. [DOI] [PubMed] [Google Scholar]
- 40.Dall TM, Narayan KM, Gillespie KB, et al. Detecting type 2 diabetes and prediabetes among asymptomatic adults in the United States: modeling American Diabetes Association versus US Preventive Services Task Force diabetes screening guidelines. Popul Health Metr. 2014;12:12. doi: 10.1186/1478-7954-12-12. [DOI] [PMC free article] [PubMed] [Google Scholar]
Associated Data
This section collects any data citations, data availability statements, or supplementary materials included in this article.
Supplementary Materials
Figure S1 Racial disparities in disease and mortality risks additionally controlling for income, education, and insurance: hazard ratios and 95% confidence intervals for developing diabetes, hypertension, CHD, or stroke and for mortality (Reference group: whites)
Table S1. Racial disparity in life expectancies by disease (LEW-LEB)
Table S2. Racial disparity in life years lost by disease (LYLB-LYLW)
Figure S2 Racial disparities in life expectancies by health state and racial disparities in life years lost by disease combination
Table S3. Racial disparity in life expectancies (LEs) by health state (LEW-LEB)
Table S4. Racial disparity in life years lost (LYL) by disease combination (LYLB-LYLW)