

Abstract
Background
Alcohol Dependence (AD) shows evidence for genetic liability, but genes influencing risk remain largely unidentified.
Methods
We conducted a genomewide association study in 706 related AD cases and 1748 unscreened population controls from Ireland. We sought replication in 15,496 samples of European descent. We used model organisms to assess the role of orthologous genes in ethanol response behaviors. We tested one primate-specific gene for expression differences in case/control post-mortem brain tissue.
Results
We detected significant association in COL6A3 and suggestive association in two previously implicated loci, KLF12 and RYR3. None of these signals are significant in replication. A suggestive signal in the long noncoding RNA LOC339975 is significant in case:control meta-analysis, but not in a population sample. Knockdown of a COL6A3 ortholog in C. elegans reduced ethanol sensitivity. Col6a3 expression correlated with handling-induced convulsions in mice. Loss of function of the KLF12 ortholog in C. elegans impaired development of acute functional tolerance. Klf12 expression correlated with locomotor activation following ethanol injection in mice. Loss of function of the RYR3 ortholog reduced ethanol sensitivity in C. elegans and rapid tolerance in Drosophila. The ryanodine receptor antagonist dantrolene reduced motivation to self-administer ethanol in rats. Expression of LOC339975 does not differ between cases and controls but is reduced in carriers of the associated rs11726136 allele in nucleus accumbens.
Conclusions
We detect association between AD and COL6A3, KLF12, RYR3 and LOC339975. Despite non-replication of COL6A3, KLF12 and RYR3 signals, orthologs of these genes influence behavioral response to ethanol in model organisms, suggesting potential involvement in human ethanol response and AD liability. The associated LOC339975 allele may influence gene expression in human nucleus accumbens. Although the functions of long noncoding RNAs are poorly understood, there is mounting evidence implicating these genes in multiple brain functions and disorders.
Keywords: alcohol dependence, COL6A3, KLF12, LOC339975, RYR3
Introduction
Alcohol dependence (AD) is a major public health burden with substantial costs for individuals and societies (Rice, 1999). Despite robust evidence for genetic influences on risk (Cotton, 1979; Sigvardsson et al., 1996; Prescott et al., 2005a) and heritability estimates of ~50% (Ystrom et al., 2011), the genes influencing AD risk remain largely unidentified.
Prior genome-wide association studies (GWAS) of AD and alcohol-related phenotypes in European samples detected novel signals in the PECR (Treutlein et al., 2009), AUTS2 (Schumann et al., 2011) and uncharacterized c15orf53 (Wang et al., 2013) genes. None of these novel signals were replicated. Two independent signals were detected and replicated around the long-standing candidate gene ADH1B (Frank et al., 2012; Gelernter et al., 2014). Three studies of Asian subjects identified signals at ALDH2 (Baik et al., 2011; Quillen et al., 2014) and the ADH1B functional variant H47R (rs1229984) (Park et al., 2013), likely due to the frequencies of functional ADH and ALDH alleles in Asian populations.
To identify genes influencing alcohol-related phenotypes, we conducted a GWAS of AD. To maximize power, we studied an ethnically homogeneous sample of cases, affected siblings and unscreened controls from Ireland, correcting for relatedness and lack of control screening analytically. We sought replication in 15,496 subjects of European descent (6742 case/controls and 8754 population samples).
Well-developed experimental approaches can test directly whether changes in candidate genes impact behavioral response to ethanol in vertebrate (Crabbe, 2002) and invertebrate (Grotewiel and Bettinger, 2015) model organisms (MO). Orthologs of genes that affect simple ethanol responses in invertebrates also affect more complex ethanol responses in mammals, including measures of sensitivity and voluntary drinking (Kapfhamer et al., 2008; Liu et al., 2008; Bhandari et al., 2012). This approach has previously been successful in demonstrating functional relevance of genes implicated by GWAS in ethanol response behaviors (Schumann et al., 2011).
To provide functional support for GWAS candidates, we tested whether perturbation of orthologous genes alters behavioral response to ethanol in C. elegans and/or Drosophila, depending on the presence of orthologous genes and the availability of genetic reagents and information. In vertebrate MO, we analyzed correlations between candidate gene expression and alcohol phenotypes bioinformatically in curated archival data from recombinant inbred mouse lines and we tested the effect of pharmacological antagonism of one candidate gene product on motivation to self-administer ethanol in rats after chronic ethanol exposure. For one candidate gene with no ortholog outside of primates, we tested for expression differences in alcohol dependent and control human post-mortem brain tissue stratified by clinical status or genotype.
Materials and Methods
GWAS Discovery Sample
Participants in the Irish Affected Sib Pair Study of Alcohol Dependence (IASPSAD) were recruited in Ireland and Northern Ireland between 1998 and 2002 (Prescott et al., 2005b). Briefly, probands were ascertained in community alcoholism treatment facilities and public and private hospitals. Probands were eligible for inclusion if they met DSM-IV criteria for lifetime AD and if all four grandparents had been born in Ireland, Northern Ireland, Scotland, Wales, or England. Probands, siblings, and parents were interviewed by clinically trained research interviewers, most of whom had extensive clinical experience with alcoholism. We assessed lifetime history of AD using a modified version of the Semi-Structured Assessment of the Genetics of Alcoholism (SSAGA) interview, version II (Bucholz et al., 1994), demographic characteristics, other comorbid conditions, alcohol-related traits, personality features, and clinical records. All participants provided informed consent. We included 815 probands and siblings in genotyping.
2048 DNA samples from healthy, unpaid volunteers donating blood at the Irish Blood Transfusion Service and obtained from the Trinity Biobank at Trinity College Dublin were used as controls. Biobank controls were eligible if they denied any problems with alcohol or history of mental illness and if all four grandparents had been born in Ireland, Northern Ireland, Scotland, Wales, or England. Because of the sample source, controls were not formally screened for AD, but the lack of screening was addressed analytically (see GWAS Statistical Analyses). Information about age and sex was available for these subjects.
GWAS Genotyping, Quality Control and Imputation
Genomic DNAs passing quality control (QC) standards were genotyped on Affymetrix v6.0 SNP arrays. All arrays included in analysis passed standard QC measures. Genotypes were called using BEAGLECALL (Browning and Yu, 2009), followed by rigorous genotype QC. We imputed the 1000 Genomes Project (1000 Genomes Project Consortium, 2010) April 2012 integrated variant reference panel of 36.5 million simple nucleotide polymorphisms (SNPs) using IMPUTE2 (Howie et al., 2009). We converted posterior genotypic probabilities to allelic dosages using GenABEL (Aulchenko et al., 2007). After post-imputation QC, 8,344,348 SNPs were available for analysis. Complete details of array, SNP and individual QC, BEAGLECALL genotyping, imputation and post-imputation QC are included in Supplementary Information and Supplementary Figures S1–S3.
GWAS Statistical Analyses
We tested individual SNPs for association by Modified Quasi-Likelihood Score (MQLS) (Thornton and McPeek, 2007) because MQLS accepts genotypes in post-imputation dosage format and can account for subject relatedness by using a kinship matrix calculated from pedigree data. Unscreened Biobank controls were coded as phenotype unknown. We included an estimated sex-weighted 8.9% population AD prevalence derived from population (Hasin et al., 2007) and unpaid Dutch blood donor (Atsma et al., 2011) data to account for lack of control screening. Varying this estimate from 0% to 12% gave a similar p-value distribution for all prevalence estimates. MQLS cannot include covariates. We used a threshold of p≤5×10⁻⁸ for genomewide significant (GWS) results. Odds ratios were not calculated due to the non-independence of related case alleles. Secondary analytic approaches for gene-based, network and geneset analyses are described in Supplementary Methods.
Selection for Further Study
We calculated false discovery rate (FDR) q-values (Storey and Tibshirani, 2003) for all SNPs to select loci for further study. For replication and secondary analysis of discovery data, we used a threshold q<0.3 (p<1×10⁻⁵ for our p-value distribution, 30% of results are false discoveries) to maximize discovery potential. For functional studies, we included any loci achieving genomewide significant statistical signals in discovery or replication (COL6A3, LOC339975) and any loci with both q<0.1 (10% of results are false discoveries) and prior evidence of involvement in ethanol phenotypes from human and/or MO studies (KLF12, RYR3).
Assessment of Variants for Potential Functional Impact
For variants with q<0.1, we assessed variant potential to impact function either directly or via LD with other variants using GWAS3D (Li et al., 2013). GWAS3D provides an adjusted p-value from Fisher’s combined probability test incorporating the GWAS evidence of genetic association with evidence that the variant alters 1) coding or 2) conserved sequence, or 3) sites of long-range interactions, 4) binding energy for known transcription factors or lies within 5) promoter, 6) enhancer or 7) insulator elements from ENCODE and other published sources.
GWAS Replication
We conducted replication analyses in N=15,496 European subjects from three AD case-control samples (Treutlein et al., 2009; Edenberg et al., 2010; Frank et al., 2012; Gelernter et al., 2014) and one population sample (Heath et al., 2011). Details of the individual samples, genotyping and imputation are provided in Supplementary Information. We conducted look-up analysis of replication SNPs in each sample and meta-analysis of all replication SNPs first in the four ascertained case-control samples, then adding the unascertained population sample, for which AD diagnoses were derived rather than directly assessed (Heath et al., 2011), using METAL (Willer et al., 2010). We weighted meta-analyses by sample size and direction of effect because MQLS does not generate standard errors. Many markers are non-independent due to LD, so we assessed the 274 replication SNPs for independence using SNAP (Johnson et al., 2008) to determine the number of independent tests.
Invertebrate model organism studies
C. elegans studies
A single, continuous acute exposure of C. elegans to 400 mM exogenous ethanol yields an internal concentration of 40–50 mM (Alaimo et al., 2012) (~200 mg/dL, within the range observed in humans after heavy drinking (Bond et al., 2010)). A concentration dependent slowing of locomotion at 10 minutes exposure (measuring initial sensitivity) is followed at ~30 minutes by an increase in speed of locomotion (measuring acute functional tolerance, AFT) (Davies et al., 2003; Davies et al., 2004) despite an increase in the internal tissue concentration of ethanol (Alaimo et al., 2012). Both measures can be independently affected by the loss of individual genes (Davies et al., 2003; Davies et al., 2004; Kapfhamer et al., 2008; Bettinger et al., 2012; Bhandari et al., 2012; Mathies et al., 2015).
C. elegans strains
C. elegans strains were maintained as previously described (Brenner, 1974). Strains used in these studies were wild-type N2 (var. Bristol), RB1603 klf-3(ok1975), TR2170 unc-68(r1161) and TR2171 unc-68(r1162).
RNAi treatment
RNA interference (RNAi) induction and locomotion assays were performed as previously described (Kamath et al., 2001). Briefly, cultures of bacteria containing RNAi vectors corresponding to genes C16E9.1, C18H7.1, cutl-23 or empty vector (L4440) (Geneservice, Cambridge, UK) were plated on NGM plates with 1mM IPTG, and allowed to grow at room temperature for 24 hours. 3–5 fourth larval stage wild type N2 worms were placed on the seeded plates and incubated at 20°C and allowed to produce F1 progeny, which were maintained on RNAi cultures to adulthood. First-day adult F1 progeny were collected and subjected to behavioral analysis.
Locomotion tracking
Locomotion was assayed as previously described (Bettinger et al., 2012). Ten worms for each strain were tested in each assay, and we calculate the average of the speeds of the 10 worms in each iteration of the assay (n = 1). Comparisons were only made of animals tested simultaneously on the same plates. Briefly, Nematode Growth Media (NGM)-containing plates were dried for 2 hours with lids off at 37˚C, then copper rings were embedded in the surface of the plate to act as corrals. Ethanol was added to the plates to a final concentration of 0 mM or 400 mM, the plates were sealed, and the ethanol was allowed to equilibrate for 2 hours. Worms were placed in the corrals and two-minute movies were captured at 10 and 30 minutes of exposure using a Retiga 4000R camera (QImaging, Surrey, British Columbia) on an Olympus SZX-7 microscope. Movies were analyzed using ImagePro Plus (6.2) (MediaCybernetics, Rockville, MD) software. We derived two measures of ethanol response, Initial Sensitivity (depression of speed of locomotion at 10 minutes exposure compared to the same strain untreated) and Acute Functional Tolerance (AFT, increase in speed at 30 minutes exposure compared to the same strain at 10 minutes).
Statistical analysis
Comparisons were made of animals tested in identical conditions. Relative speeds (treated/untreated × 100) were used in comparisons. We used Prism 5.0 software (GraphPad, La Jolla, CA) to perform 2-way ANOVA comparisons across time of ethanol exposure and genotype with Bonferroni post-hoc comparisons at each time point to determine differences between genotypes. Development of AFT was tested using a paired two-tailed t-test.
Drosophila studies
Only one candidate locus (RYR3) had both a Drosophila ortholog and genetic reagents available. Detailed methods for Drosophila studies are provided in Supplementary Materials and Methods.
Mammalian model organism studies
Mouse studies
We queried selected candidate genes for localization to ethanol behavioral QTL intervals using the Mouse Genome Informatics (MGI) tool set. We queried published expression microarray and ethanol behavioral response datasets within the curated GeneNetwork web-based resource of genetic, phenotypic and genomic data for evidence that basal candidate gene expression correlated with measured ethanol behavioral phenotypes in C57BL/6J × DBA/2J recombinant inbred (BXD) mouse lines. All expression data were from Affymetrix M430 microarrays (Affymetrix, Santa Clara, CA). We included saline or air treated BXD control whole brain (GN113), nucleus accumbens (NAc) (GN156), prefrontal cortex (PFC) (GN135), and ventral tegmental area (VTA) (GN228) (Wolen et al., 2012).
We used the single Col6a3 probeset (1424131_at_A). We selected the most representative probeset based on GeneNetwork quality scores for Ryr3 (1427427_at_A) and Klf12 (1455521_at; we also assessed the better of the two probesets showing Klf12 ethanol response (Wolen et al., 2012), 1439847_s_at). Robust multi-array average (RMA) normalized expression data were used for Spearman rank correlation analyses with ethanol behavioral phenotypes. Identifiers of probesets and phenotypes used for specific analyses are shown in Results and in Figure 5. Expression and phenotype data archived in GeneNetwork were produced in different labs and at different times; as a result, the N of BXD lines tested in our analyses varies across the tissues and phenotypes analyzed. We use the GeneNetwork default setting to retrieve the top 1000 correlations for each probeset × tissue pair.
Figure 5. Bioinformatic analysis of correlation of Col6a3, Klf12 or Ryr3 expression with ethanol behaviors in C57BL/6J × DBA/2J recombinant inbred (BXD) mouse lines.
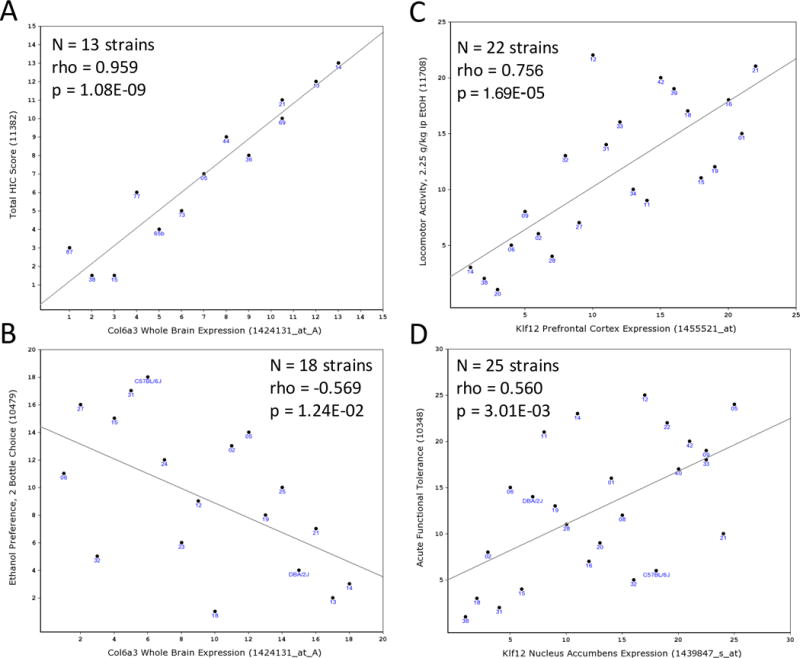
The GeneNetwork (GN) web-based analysis platform was used to identify correlations between between basal expression levels of Col6a3, Klf12 or Ryr3 and ethanol behaviors. Panels A-D display Spearman ranked order correlations between microarray gene expression (x-axis) and behavioral phenotypes (y-axis). Col6a3 (probeset 1424131_at) in GN113 whole brain expression dataset showed significant positive correlation with total handling induced convulsion (HIC) score (sum of baseline subtracted HIC at 4, 6 and 7 hrs) after 4 g/kg intraperitoneal (IP) ethanol in males (GN record 11382; Panel A) and negative correlation with ethanol 2-bottle choice voluntary consumption (GN record 10479; Panel B). Klf12 basal expression in prefrontal cortex (GN135, probeset 1455521_at) was significantly positively correlated with locomotor activity 0–5 minutes after 2.25 g/kg IP ethanol (GN record 11708; Panel C) and in nucleus accumbens (GN156, probeset 1439827_s_at) was positively correlated with ethanol acute functional tolerance (GN record 10348; Panel D).
A total of 5134 traits are present in GeneNetwork, but they are not all independent because of both the multiple related measures made within studies and the partial overlap of BXD lines used between studies. GeneNetwork developers suggest that Bonferroni correction for 200 independent traits approximates an FDR of 0.2 based on data in (Wang et al., 2016)). We apply a more stringent correction for 2000 independent tests to maintain a conservative significance threshold of 0.05/2000=2.5E-05.
Rat studies
We studied the effect of pharmacological antagonism of ryanodine receptors on ethanol self-administration in rats. Detailed methods for this single rat study are provided in Supplementary Materials and Methods.
Human post-mortem studies
PFC and NAc tissues from 41 AD cases and 41 controls were provided by the New South Wales Tissue Resource Centre. Age, sex, ethnicity, brain weight, brain pH, post-mortem interval (PMI), tissue hemisphere, cause of death, blood toxicology, smoking status, neuropathology and liver pathology were provided for each subject. Confounding effects of all these covariates were controlled by analysis of covariance (ANCOVA, Supplementary Table S7). Total RNA was isolated from 100mg frozen tissue using the mirVana-PARIS kit (Life Technologies, Carlsbad, CA) following manufacturer’s protocols. RNA concentration was measured using the Quant-iT Broad Range RNA Assay kit (Life Technologies). The RNA Integrity Number (RIN) was measured on the Agilent 2100 Bioanalyzer (Agilent Technologies, Inc., Santa Clara, CA). Quantitative real-time PCR (qRT-PCR) analyses were performed as previously described using SYBR Green (Riley et al., 2010) with primers spanning the LOC339975 exon 2–3 junction. Samples with missing genotypes and outliers (±2SD from the mean) were omitted from further analysis.
Results
Irish case/control discovery dataset
After all QC, the dataset consisted of 706 probands and affected siblings, 464 (65.7%) male and 242 (34.3%) female, mean age 41.8 (standard deviation (SD) 9.8) years, and 1748 population controls, 755 (43.2%) male and 993 (56.8%) female, mean age 37.2 (SD 12.6) years, with 8,344,348 SNPs for analysis. The Manhattan plot for case/control analysis of AD is shown in Figure 1. The QQ plot for the final dataset after imputation and all QC is shown in Figure 2.
Figure 1. Manhattan plot for case/control analysis of Alcohol Dependence (AD).
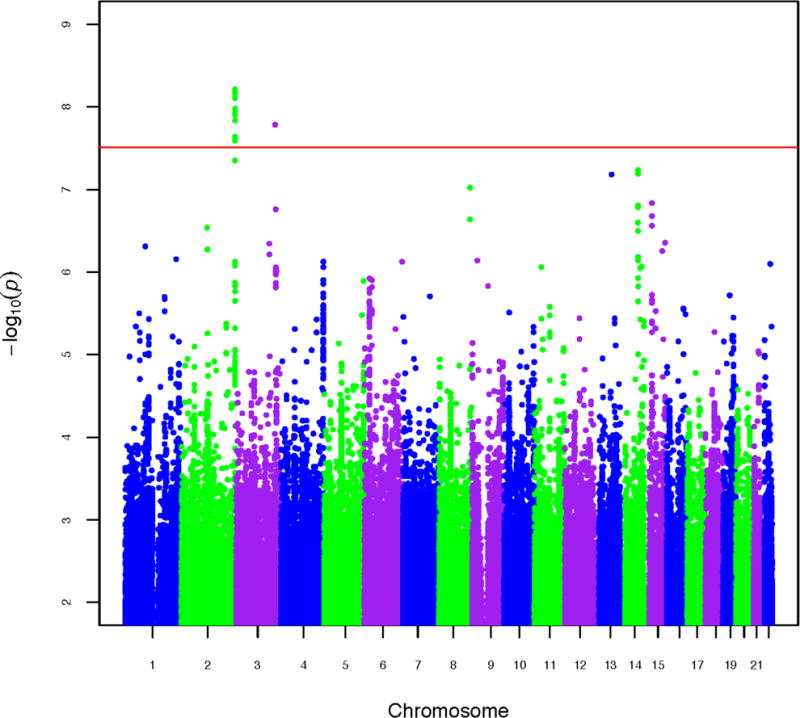
Horizontal red line indicates genome-wide significance (5 × 10⁻⁸).
Figure 2. Q-Q plot for final post-imputation dataset after all quality control (QC) and exclusions.
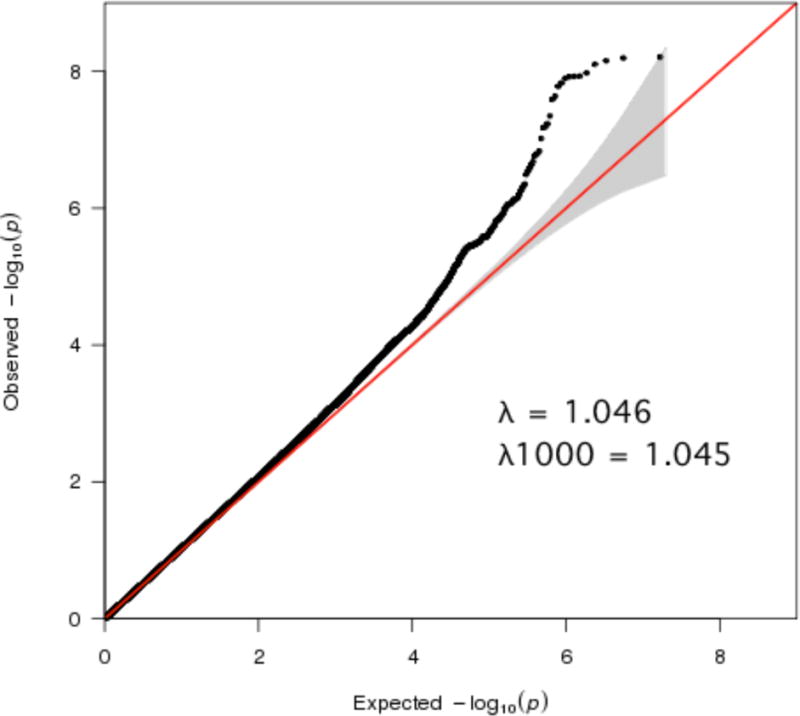
Gray shading indicates 95% confidence interval for expected values. The post-imputation lambda (1.046) and sample size-standardized lambda1000 (1.045) indicate there is little inflation of test statistics.
Variation in COL6A3 is associated with AD
In single marker analyses, 14 SNPs defining two independent genomic intervals achieve genome-wide significance, 13 within the collagen VI A3 (COL6A3) gene on chromosome 2q37.2 (Figure 3A), including the most significant SNP in our study, rs2256485, p=6.17×10⁻⁹ (Table 1). COL6A3 encodes an extracellular matrix (ECM) protein expressed in brain. Although there is no prior human association evidence for this gene, remodeling of the ECM has been strongly implicated in response to various drugs of abuse (Lubbers et al., 2014). The second interval is defined by a single SNP (rs150268941, p=1.65×10⁻⁸, Table 1) on chromosome 3q26.31 (Supplementary Figure S5A).
Figure 3. LocusZoom plots of COL6A3, RYR3, KLF12 and LOC339975.
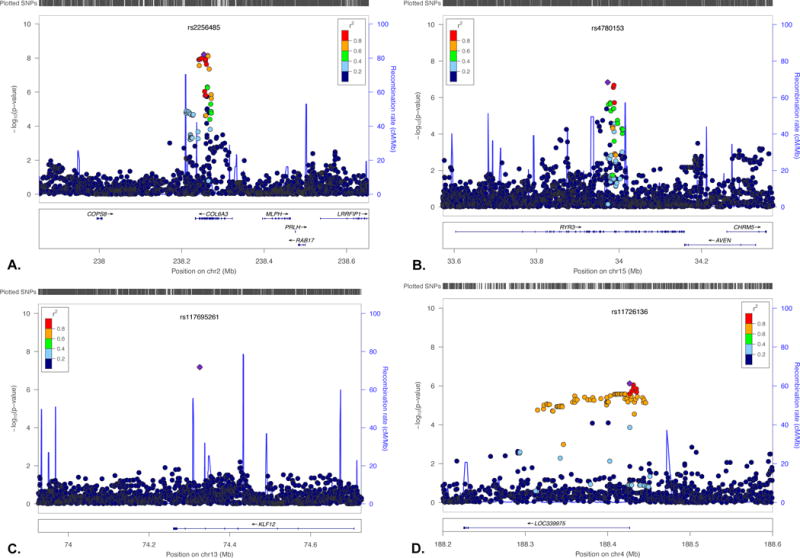
Genomewide significant results in COL6A3 (A) and three other regions of suggestive association supported by additional data, RYR3 (B), KLF12 (C) and LOC339975 (D).
Table 1. Results of GWAS analyses.
A. SNPs from Irish discovery GWAS with q-values < 0.1 (p < 1 × 10⁻⁵) or significant replication results. Genomewide significant p-values < 5 × 10⁻⁸ are shown in bold. Chr: chromosome; bp: base pair position; SNP: dbSNP identifier; Gene: SNP is within or in LD with the given locus, or is intergenic. p: p-value in Irish discovery GWAS; q: FDR q-value in Irish discovery GWAS;. B. SNPs with functional evidence showing increased signal from GWAS3D combined p-value. All 28 SNPs with q<0.1 were assessed with GWAS3D for evidence of functional impact of the target SNP or SNPs in high LD with the target. Combined p: GWAS3D Fisher’s combined probability test p-value is shown where signal is increased by evidence for SNP function; Superscripts: *: functional evidence comes from a SNP in LD with the tested SNP (functional SNP rsID and r2 are shown in parentheses below), otherwise functional evidence comes from the tested SNP itself; S: synonymous coding variant; T: significant change in transcription factor binding energy; E: SNP lies within an ENCODE-defined enhancer region; C: evidence of conservation from GERP score. C. Lookup replication and meta-analysis of independent case/control samples. COGA, GESGA and Yale/Penn p: lookup replication p-values in COGA, GESGA and Yale/U Penn samples, respectively; NA indicates SNP was not available in the specific dataset; N, Z and Meta 1 p: meta-analysis sample N, Z-score and p-value, respectively, in meta-analysis of independent case/control samples. D. Meta-analysis of all case/control samples including the Irish discovery sample. N, Z and Meta 2 p: meta-analysis sample N, Z-score and p-value, respectively, in meta-analysis of Irish plus independent case/control samples; Sign test: direction of effect in Irish, COGA, GESGA and Yale/U Penn samples, respectively; signs indicate that direction of effect is same (+), opposite (−) or data point unavailable (?) in each sample. E. Meta-analysis of all samples including the Australian population sample. OZALC p: p-value in look-up replication in the Australian population sample; N, Z and Meta 3 p: meta-analysis sample N, Z-score and p-value, respectively, in meta-analysis of 4 case/control samples plus the Australian population sample; Sign test: direction of effect in Irish, COGA, GESGA, Yale/U Penn and OZALC samples, respectively; signs indicate that direction of effect is same (+), opposite (−) or data point unavailable (?) in each sample.
| A. Irish discovery MQLS analysis | B. GWAS3D | C. Independent
Case:Control Replication and Meta-analysis |
D. Irish Plus Independent Case/Control Meta-analysis | E. All Case/Control +
Population Sample Meta-analysis |
|||||||||||||||||
|---|---|---|---|---|---|---|---|---|---|---|---|---|---|---|---|---|---|---|---|---|---|
|
| |||||||||||||||||||||
| Chr | bp | SNP | Gene | p | q | Combined p |
COGA p |
GESGA p |
Yale/Penn p |
N | Z | Meta 1 p |
N | Z | Meta 2 p |
Sign Test | OZALC p |
N | Z | Meta 3 p |
Sign Test |
| 2 | 114506030 | rs72833664 | SLC35F5 | 2.91E-07 | 0.088 | 5.01E-08T,E | NA | NA | 0.500 | 1842 | −0.67 | 5.00E-01 | 4303 | −4.32 | 1.56E-05 | -??- | NA | 4303 | −4.32 | 1.56E-05 | -??-? |
| 2 | 238240863 | rs56310758 | COL6A3 | 1.26E-08 | 0.011 | 0.043 | 0.431 | 0.521 | 6742 | −1.82 | 6.81E-02 | 9203 | 1.38 | 1.67E-01 | +--- | 0.556 | 17957 | 1.40 | 1.61E-01 | +---+ | |
| 2 | 238241881 | rs75561681 | COL6A3 | 2.57E-08 | 0.016 | 0.010 | 0.433 | 0.518 | 6742 | 2.07 | 3.85E-02 | 9203 | −1.11 | 2.68E-01 | -+++ | 0.706 | 17957 | −1.06 | 2.91E-01 | -+++- | |
| 2 | 238243285 | rs2270671 | COL6A3 | 1.18E-08 | 0.011 | 6.40E-10S,T,E,C | 0.063 | 0.424 | 0.250 | 6742 | −2.02 | 4.30E-02 | 9203 | 1.22 | 2.24E-01 | +--- | 0.545 | 17957 | 1.29 | 1.96E-01 | +---+ |
| 2 | 238244559 | rs10929226 | COL6A3 | 1.17E-08 | 0.011 | 1.37E-09T,E | 0.061 | 0.426 | 0.453 | 6742 | −1.82 | 6.87E-02 | 9203 | 1.39 | 1.64E-01 | +--- | 0.576 | 17957 | 1.39 | 1.66E-01 | +---+ |
| 2 | 238247257 | rs112523013 | COL6A3 | 1.05E-08 | 0.011 | 1.28E-09T,E | 0.067 | 0.352 | 0.213 | 6742 | 2.16 | 3.11E-02 | 9203 | −1.11 | 2.66E-01 | -+++ | 0.586 | 17957 | −1.18 | 2.39E-01 | -+++- |
| 2 | 238253149 | rs2646258 | COL6A3 | 6.38E-09 | 0.011 | 5.03E-10S,T,E,C | 0.049 | 0.352 | 0.200 | 6742 | −2.24 | 2.52E-02 | 9203 | 1.09 | 2.77E-01 | +--- | 0.622 | 17957 | 1.12 | 2.62E-01 | +---+ |
| 2 | 238253930 | rs2256485 | COL6A3 | 6.17E-09 | 0.011 | 6.18E-13*,S,T,E,C (rs2646265, 1) | 0.033 | 0.345 | 0.204 | 6742 | 2.31 | 2.07E-02 | 9203 | −1.03 | 3.05E-01 | -+++ | 0.602 | 17957 | −1.10 | 2.72E-01 | -+++- |
| 2 | 238257013 | rs2646265 | COL6A3 | 1.47E-08 | 0.012 | 1.40E-12S,T,E,C | 0.075 | 0.332 | 0.180 | 6742 | −2.21 | 2.70E-02 | 9203 | 1.04 | 3.00E-01 | +--- | 0.629 | 17957 | 1.08 | 2.80E-01 | +---+ |
| 2 | 238257213 | rs2646264 | COL6A3 | 1.20E-08 | 0.011 | 0.095 | 0.359 | 0.237 | 6742 | 2.04 | 4.15E-02 | 9203 | −1.20 | 2.29E-01 | -+++ | 0.632 | 17957 | −1.20 | 2.32E-01 | -+++- | |
| 2 | 238259387 | rs2646261 | COL6A3 | 2.31E-08 | 0.015 | 0.081 | 0.445 | 0.184 | 6742 | 2.04 | 4.13E-02 | 9203 | −1.14 | 2.53E-01 | -+++ | 0.640 | 17957 | −1.15 | 2.52E-01 | -+++- | |
| 2 | 238262254 | rs2645764 | COL6A3 | 6.99E-09 | 0.011 | 0.177 | 0.298 | 0.355 | 6742 | −1.85 | 6.45E-02 | 9203 | 1.41 | 1.58E-01 | +--- | 0.388 | 17957 | 1.61 | 1.07E-01 | +---+ | |
| 2 | 238263299 | rs2645763 | COL6A3 | 7.86E-09 | 0.011 | 0.171 | 0.298 | 0.339 | 6742 | −1.87 | 6.10E-02 | 9203 | 1.38 | 1.67E-01 | +--- | 0.389 | 17957 | 1.59 | 1.12E-01 | +---+ | |
| 2 | 238266146 | rs2645777 | COL6A3 | 4.47E-08 | 0.026 | 0.133 | 0.295 | 0.323 | 6742 | −1.96 | 5.06E-02 | 9203 | 1.16 | 2.48E-01 | +--- | 0.349 | 17957 | 1.48 | 1.38E-01 | +---+ | |
| 3 | 172575312 | rs150268941 | intergenic | 1.65E-08 | 0.012 | 0.202 | NA | 0.327 | 3241 | 0.10 | 9.21E-01 | 5702 | 3.78 | 1.55E-04 | ++?- | NA | 5702 | 3.78 | 1.55E-04 | ++?-? | |
| 8 | 175451990 | rs142645748 | NAALADL2 | 1.75E-07 | 0.065 | 3.91E-09T | NA | NA | 0.447 | 1842 | 0.76 | 4.47E-01 | 4303 | 4.45 | 8.66E-06 | +??+ | NA | 4303 | 4.45 | 8.66E-06 | +??+? |
| 8 | 137895174 | rs79048468 | intergenic | 2.32E-07 | 0.079 | 0.525 | NA | 0.591 | 3241 | −0.01 | 9.90E-01 | 5702 | −3.41 | 6.57E-04 | --?+ | 0.095 | 14456 | −3.44 | 5.86E-04 | --?+- | |
| 8 | 137907672 | rs117687198 | intergenic | 9.57E-08 | 0.043 | 6.03E-08T | 0.405 | NA | 0.515 | 3241 | 0.06 | 9.55E-01 | 5702 | 3.55 | 3.89E-04 | ++?- | 0.098 | 14456 | 3.52 | 4.38E-04 | ++?-+ |
| 13 | 74325506 | rs117695261 | KLF12 | 6.63E-08 | 0.031 | 0.825 | 0.804 | 0.054 | 6742 | 1.09 | 2.77E-01 | 9203 | 3.72 | 1.97E-04 | +-++ | NA | 9203 | 3.72 | 1.97E-04 | +-++? | |
| 14 | 77100157 | rs117727648 | intergenic | 2.53E-07 | 0.083 | 1.21E-08T | 0.892 | NA | 0.323 | 3241 | 0.84 | 4.04E-01 | 5702 | 4.02 | 5.91E-05 | ++?+ | NA | 5702 | 4.02 | 5.91E-05 | ++?+? |
| 14 | 77641605 | rs113653607 | intergenic | 1.64E-07 | 0.064 | 1.39E-09T | 0.386 | NA | 0.591 | 3241 | −0.98 | 3.30E-01 | 5702 | 2.71 | 6.83E-03 | +-?- | 0.084 | 14456 | 3.04 | 2.36E-03 | +-?-+ |
| 14 | 77750946 | rs142687658 | POMT2 | 6.46E-08 | 0.032 | 3.40E-08T,E | NA | NA | 0.651 | 1842 | 0.45 | 6.51E-01 | 4303 | 4.38 | 1.17E-05 | +??+ | 0.190 | 4303 | 4.38 | 1.17E-05 | +??+? |
| 14 | 77755799 | rs150915059 | POMT2 | 3.20E-07 | 0.093 | NA | NA | 0.643 | 1842 | 0.46 | 6.43E-01 | 4303 | 4.17 | 3.06E-05 | +??+ | NA | 4303 | 4.17 | 3.06E-05 | +??+? | |
| 14 | 77806492 | rs150017190 | intergenic | 1.57E-07 | 0.064 | 3.31E-09T,E | NA | NA | 0.619 | 1842 | 0.50 | 6.19E-01 | 4303 | 4.29 | 1.78E-05 | +??+ | 0.149 | 4303 | 4.29 | 1.78E-05 | +??+? |
| 14 | 77828430 | rs56198483 | TMED8 | 5.85E-08 | 0.032 | 3.09E-08T | 0.083 | NA | 0.539 | 3241 | 0.68 | 4.98E-01 | 5702 | 4.07 | 4.63E-05 | ++?- | 0.878 | 5702 | 4.07 | 4.63E-05 | ++?-? |
| 15 | 33972420 | rs4780153 | RYR3 | 1.47E-07 | 0.063 | 7.92E-10*,T,E (rs2076954, 0.87) | 0.951 | 0.930 | 0.276 | 6742 | −0.61 | 5.45E-01 | 9203 | 2.20 | 2.78E-02 | ++-- | 0.730 | 17957 | 1.33 | 1.82E-01 | ++--- |
| 15 | 33984848 | rs1353348 | RYR3 | 2.77E-07 | 0.087 | 0.761 | 0.985 | 0.164 | 6742 | 0.60 | 5.47E-01 | 9203 | −2.14 | 3.22E-02 | --++ | 0.805 | 17957 | −1.36 | 1.74E-01 | --+++ | |
| 15 | 33986294 | rs939432 | RYR3 | 2.11E-07 | 0.075 | 0.814 | 0.813 | 0.156 | 6742 | 0.81 | 4.21E-01 | 9203 | −1.99 | 4.61E-02 | --++ | 0.779 | 17957 | −1.23 | 2.18E-01 | --+++ | |
|
| |||||||||||||||||||||
| 4 | 188426585 | rs11726136 | LOC339975 | 7.52E-07 | 0.149 | 0.090 | NA | 0.014 | 3241 | −2.96 | 3.07E-03 | 5702 | −5.48 | 4.2E-08 | --?- | 0.779 | 14456 | −3.66 | 2.50E-04 | --?-- | |
Additional loci are suggestively associated with AD
A total of 28 SNPs in 7 LD-independent loci had q<0.1 (Table 1). These include SNPs in two loci with prior support from both human and MO alcohol studies (the ryanodine receptor 3 (RYR3) gene, chr. 15q14, rs4780153, p=1.47×10⁻⁷, Figure 3B and the Krueppel-like factor 12 (KLF12) gene, chr. 13q22.1, rs117695261, p=6.63×10⁻⁸, Figure 3C). Four additional regions with suggestive signals are shown in Supplementary Figure S5B–E.
If the Fisher’s combined probability test from GWAS3D provided increased evidence based on potential function of the test SNP or a SNP in LD with the test SNP, the combined p-value is also shown in Table 1. Of the 28 SNPs with q<0.1 input to GWAS3D, 14 showed more significant combined p-values after incorporating evidence of function. Of these 14 results, 12 were based on evidence of functional impact for the GWAS target SNP itself. For the two sites where the increased evidence was based on putative functional impact of a variant in LD with the GWAS signal, the LD SNP rsID, r2 with the GWAS target and functional evidence are shown. GWAS3D analysis yields strongly enhanced signals in COL6A3 (rs2646265: p=1.47×10⁻⁸, combined p=1.40×10⁻¹²; rs2256485: r2=1 with rs2646265, p=6.17×10⁻⁹, combined p=6.18×10⁻¹³) and RYR3 (rs4780153: r2=0.867 with rs2076954, p=1.47×10⁻⁷, combined p=7.92×10⁻¹⁰).
The signals at 3q26.31 (Supplementary Figure S5A) and KLF12 (Figure 3C) are with single imputed SNPs of low minor allele frequency (MAF). In 1000 Genomes Phase 3 data from UK subjects (GBR, British residents of England and Scotland), rs117695261 (MAF 0.03) in KLF12 has no r2>0.2 with any other SNP, consistent with the lack of correlated signals in Irish subjects. By contrast, rs150268941 on 3q26.31 is tagged by rs148750402, which was imputed and analyzed in our sample (0.034, p=0.00147, q=0.754464). Direct genotyping of rs150268941 also did not support the observed association (see Supplementary Information), and we did not consider the chromosome 3q26.1 region further.
Human replication
A total of 274 SNPs had discovery q<0.3, and were included in replication. SNAP analysis indicated that 121 represent LD-independent tests, setting replication significance at 0.05/121=0.0004. Lookup replication and meta-analysis results arranged by chromosome and base pair are also shown for all 28 SNPs with q<0.1 in Table 1. Supplementary Table S1 shows these results for all 274 SNPs with q<0.3. No individual SNP achieved p<0.0004 in any sample. In meta-analysis of the 4 case-control samples, one SNP in a second novel locus, the long noncoding RNA (lncRNA) gene LOC339975 showed a GWS signal (chr. 4q35.2, rs11726136, p=7.52×10⁻⁷, q=0.149 in the discovery sample, Figure 3D, and GWS p=4.20×10⁻⁸ in meta-analysis of the four case/control samples, Table 1 and Supplementary Table S1). Because of differences in ascertainment and severity of affection, we performed replication analyses including the Australian population sample separately; this signal was not significant when the Australian sample was included (Supplementary Table S1).
We also assessed evidence in our discovery data for association with loci identified in prior AD GWAS in subjects of European ancestry. We detect modest signals in PECR (minimum p=0.0017), AUTS2 (minimum p=0.0009) and ADH1B (minimum p=0.00166) but none of these signals are with the SNPs originally reported (Supplementary Table S2). We detect no evidence of signal in c15orf53 (minimum p=0.2058).
Secondary analyses
Results of secondary analyses of discovery GWAS data are shown in Supplementary Table S3 (gene-based analyses), Supplementary Figure S6 and Supplementary Table S4 (network analyses) and Supplementary Table S5 (geneset analyses). Gene-based analyses assess over-representation of case-control allele frequency differences in all SNPs within defined genic regions (with LD pruning or weighting as described in Supplementary Materials and Methods). The hybrid set-based test (HYST) incorporated in KGG shows strong gene-based association of AD with COL6A3 (p=7.30×10⁻⁹, q=0.00016), RYR3 (p=2.62×10⁻⁷, q=0.0029) and LOC339975 (p=5.31×10⁻⁶, q=0.0248) (Supplementary Table S3).
Selection for functional studies
We undertook functional studies of four candidate loci, COL6A3 and LOC339975 based on the GWS signals in discovery or replication analyses and KLF12 and RYR3 based on discovery q<0.1 and prior evidence of implicating these loci in alcohol-related phenotypes (reviewed below). We used established behavioral paradigms to test orthologs of COL6A3, KLF12 and RYR3 for effects on behavioral responses to ethanol in C. elegans and Drosophila where orthologous genes were present in the models and genetic reagents and information were available. We analyzed correlation between brain gene expression and alcohol-related phenotypes in BXD mouse data for all three genes. All these studies are summarized in Table 2 and we report here the results of all studies performed. We additionally tested the effect of the ryanodine receptor antagonist dantrolene on ethanol self-administration in rats. The fourth gene, LOC339975, is primate-specific and was taken forward for study in human post-mortem brain.
Table 2. Summary of evidence for 10 GWAS loci with q<0.1.
Shaded rows indicate the four human loci taken forward for further study. Bold text indicates significant results for the test displayed, with significance levels for each analysis as described in the text. A. Summary of GWAS or literature evidence for loci with genomewide significant results or q<0.1 (Locus: Gene symbol for each locus; q: FDR q-value from the GWAS analysis for loci with q<0.1 shown; Support: No: no genomewide significant results in this study OR suggestive results in this study but no prior support, and locus not considered further; GWS: locus displays genomewide significant results in primary analysis (COL6A3) or replication (LOC339975); Prior: locus displays q<0.1 in this study AND has prior support from the literature. Only loci marked GWS or PRIOR were taken forward for study in model organisms. B, C, E. Summary of C. elegans (B), Drosophila (C) and rat (E) studies (Ortholog: gene symbol for ortholog(s) of the four loci taken forward from A (No indicates no ortholog present and no further consideration of that gene in that species); Reagent: mutant strain identifier for existing loss of function mutations, RNAi indicating availability of RNAi reagents for the gene, or name of pharmacological antagonist; Tested: Yes: tested in this study; PT: phenotype affected by genetic manipulation (IS: initial sensitivity; AFT: acute functional tolerance; RT: rapid tolerance; ESA: ethanol self-administration; None: no phenotype affected); p: p-value for tests showing a significant effect on phenotype. D. Summary of mouse bioinformatics studies (Ortholog: mouse gene symbol for ortholog(s) of the four loci taken forward from A (No indicates no ortholog in mice); Tissue: tissue tested for correlation between basal gene expression and behavioral phenotypes (Brain: whole brain; PFC: prefrontal cortex; NAc: nucleus accumbens; VTA: ventral tegmental area); PT: phenotype correlated with basal gene expression (HIC: handling induced convulsions; 2BC: voluntary ethanol consumption in two-bottle choice design; LA5, LA20: locomotor activation 0–5 minutes or 0–20 minutes (respectively) after ethanol administration; none: no phenotype correlated with basal gene expression); N: N of BXD strains with available data included in analysis; Rho: Spearman rank correlation coefficient; Rank: correlation rank; p: p-value for tests showing a significant effect on phenotype.
| A. GWAS and literature | B. C. elegans studies | C. Drosophila studies | D. Mouse bioinformatics analyses | E. Rat studies | ||||||||||||||||||||
|---|---|---|---|---|---|---|---|---|---|---|---|---|---|---|---|---|---|---|---|---|---|---|---|---|
| Locus | q | Support | Ortholog | Reagent | Tested | PT | p | Ortholog | Reagent | Tested | PT | p | Ortholog | Tissue | PT | N | Rho | Rank | p | Ortholog | Reagent | Tested | PT | p |
| SLC35F5 | 0.088 | No | ||||||||||||||||||||||
|
| ||||||||||||||||||||||||
| COL6A3 | 0.011 | GWS | C16E9.1 | RNAi | Yes | IS | <0.05 | No | Col6a3 | Brain | HIC | 13 | 0.959 | 1 | 1.05E-09 | Col6a3 | n/a | No | ||||||
| C18H7.1 | RNAi | Yes | none | Brain | 2BC | 18 | −0.569 | 67 | 0.0124 | |||||||||||||||
| cutl-23 | RNAi | Yes | none | |||||||||||||||||||||
|
| ||||||||||||||||||||||||
| ECT2 | 0.012 | No | ||||||||||||||||||||||
| SPATA16 | 0.012 | No | ||||||||||||||||||||||
| NAALADL2 | 0.065 | No | ||||||||||||||||||||||
|
| ||||||||||||||||||||||||
| KLF12 | 0.031 | Prior | klf-3 | ok1975 | Yes | AFT | <0.001 | No | Klf12 | PFC | LA5 | 22 | 0.756 | 1 | 1.69E-05 | Klf12 | n/a | No | ||||||
| PFC | LA20 | 22 | 0.747 | 3 | 2.54E-05 | |||||||||||||||||||
| NAc | AFT | 25 | 0.560 | 29 | 0.003 | |||||||||||||||||||
| Brain | none | |||||||||||||||||||||||
| VTA | none | |||||||||||||||||||||||
|
| ||||||||||||||||||||||||
| POMT2 | 0.032 | No | ||||||||||||||||||||||
| TMED8 | 0.032 | No | ||||||||||||||||||||||
|
| ||||||||||||||||||||||||
| RYR3 | 0.063 | Prior | unc-68 | r1161 | Yes | IS | <0.01 | RyR | d03686 | Yes | RT | <0.0001 | Ryr3 | Brain | none | Ryr3 | Dantrolene | Yes | ESA | <0.05 | ||||
| r1162 | Yes | IS | <0.01 | k04913 | Yes | RT | <0.0001 | |||||||||||||||||
| LOC339975 | 0.149 | GWS | No | No | No | No | ||||||||||||||||||
COL6A3: Regulation of ethanol sensitivity in C. elegans and correlation with handling-induced convulsions in mice
We tested three C. elegans genes with equally high orthology to human COL6A3 for effects on initial sensitivity and AFT. RNAi knockdown of C16E9.1 decreased initial sensitivity compared to control RNAi animals (p<0.05, Figure 4A) but did not affect the development of AFT. RNAi knockdown of the other COL6A3 orthologs (C18H7.1 and cutl-23) produced no significant differences in either measure (Figure 4B,C). Statistics and uncorrected basal speed data for all C. elegans experiments are shown in Supplementary Table S6.
Figure 4. Mutations in C. elegans orthologs of human candidate genes cause ethanol response phenotypes.
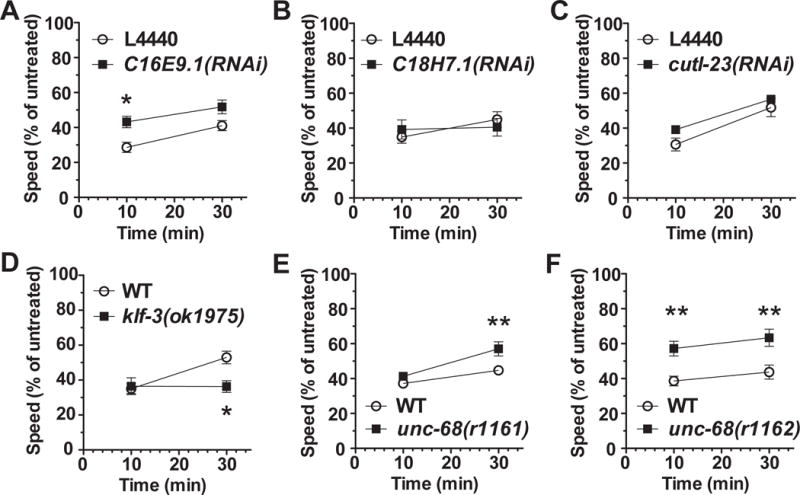
Speed of locomotion was measured at 10 and 30 minutes, and expressed as a percent of the untreated control speed. Control worms were tested simultaneously on the same plates. Worms were treated with 400 mM exogenous ethanol. The waxy cuticle of worms excludes most of the exogenous ethanol, tissue concentrations are approximately 12% of the exogenous dose (~48 mM). A, B, C: RNAi-induced gene knockdown reduced sensitivity to ethanol for C16E9.1 (a COL6A3 ortholog) but not for two other orthologous genes relative to untreated worms. D: Loss-of-function of the KLF12 ortholog, klf-3, prevented the development of acute functional tolerance between the 10- and 30-minute time points relative to wild-type N2. E, F: unc-68 mutant animals demonstrate reduced sensitivity to ethanol relative to wild-type N2. Statistical significance is shown for 2-way ANOVA followed by post-hoc comparisons across genotypes (*, p<0.05, **, p<0.01, ***, p<0.001).
In mice, Col6a3 is located within the Alcw5 QTL interval (MGI:3037048) for handling-induced convulsions (HIC) following 72 hour ethanol vapor exposure (Bergeson et al., 2003). The Alcw5 QTL maps to 39.16 centiMorgans (cM) on mouse chromosome 1, with a support interval of 28–47 cM. After converting cM to megabase pairs (Mb) for the latest version of the mouse genome (GRCm38/mm10), this yields a physical location of the Alcw5 QTL peak of 75.57 Mb and a QTL support interval of 62.12–107.66 Mb. Col6a3 is located at mouse chr1:90766860–90843971, within the defined Alcw5 QTL support interval.
In GeneNetwork, the strongest correlation observed for mouse Col6a3 basal whole brain expression (GN113, probeset 1424131_at_A) is with total HIC score (sum of baseline subtracted HIC at 4, 6 and 7 hrs) after 4 g/kg IP ethanol in males (Philip et al., 2010) (trait 11382, correlation rank=1, rho=0.959, p=1.05×10⁻⁹, N=13 strains, Figure 5A), which surpasses our Bonferroni-corrected significance level of p=2.5×10⁻⁵. HIC at 7 hours in males (trait 11380, correlation rank=2, rho=0.835, p=3.11×10⁻⁶, N=18 strains) and in males and females (trait 11894, correlation rank=3, rho=0.780, p=5.11×10⁻⁵, N=18 strains) (Philip et al., 2010) are also strongly correlated with Col6a3 expression, and all three HIC measures are highly correlated (phenotypic rho=0.91–0.95). Col6a3 expression correlated negatively with 2-bottle choice ethanol preference (Phillips et al., 1994) (trait 10479, correlation rank=67, rho=−0.569, p=0.0124, N=18 strains, Figure 5B). While this is not significant after multiple test correction, it is consistent with the expectation that factors increasing HIC will decrease voluntary consumption (Metten et al., 1998).
KLF12: Regulation of acute functional tolerance to ethanol in C. elegans and gene expression correlation with locomotor activity in mice
There is significant prior evidence for a role of KLF12 in ethanol response behaviors across species. In BXD mice, Klf12 is regulated by acute ethanol in PFC, NAc and VTA, and is a hub in a network of ethanol responsive genes (Wolen et al., 2012). In humans, KLF12 acts in combination with the co-repressor CTBP1 (Schuierer et al., 2001), and in C. elegans, the ctbp-1 gene is required for the development of AFT (Bettinger et al., 2012). The closest C. elegans ortholog to human KLF12 is klf-3, and this evidence collectively suggests KLF-3 is likely to act together with CTBP-1 to regulate AFT in worms.
We tested a strong loss-of-function allele in klf-3. There was no difference in initial sensitivity between wild-type N2 and klf-3(ok1975) mutants (Figure 4D). While wild-type N2 animals demonstrated normal AFT at 30 minutes, klf-3 mutants failed to develop AFT (Figure 4D, t-test of degree of speed recovery between 10 and 30 min, 400 mM ethanol: N2 vs. klf-3(ok1975), t3=8.99, p<0.001). These data strongly suggest that the transcriptional regulation provided by KLF-3 is required for the development of AFT in worms.
Based on patterns of regulation of mouse Klf12 by ethanol (Wolen et al., 2012), we analyzed correlation between basal Klf12 expression in mouse PFC (GN135), NAc (GN156), VTA (GN228) and whole brain (GN113) datasets and BXD panel phenotypes in GeneNetwork. The strongest correlations observed for basal Klf12 expression in PFC (GN135, probeset 1455521_at) were with locomotor activity 0–5 minutes (trait 11708, correlation rank=1, rho=0.756, p=1.69×10⁻⁵, N=22 strains, Figure 5C) and 0–20 minutes (trait 11705, correlation rank=3, rho=0.747, p=2.54×10⁻⁵, N=22 strains) after 2.25 g/kg IP ethanol in females (Philip et al., 2010). The first result remains significant and the second falls just below significance after Bonferroni correction. Basal Klf12 expression in mouse NAc (GN156, probeset 1439847_s_at) was positively correlated with AFT (Kirstein et al., 2002) (trait 10348, correlation rank=29, rho=0.560, p=0.003, N=25 strains, Figure 5D). While not significant after Bonferroni correction, this is consistent with the failure to develop AFT in C. elegans klf-3 mutants.
RYR3: Regulation of initial sensitivity to ethanol in C. elegans, rapid tolerance to ethanol in Drosophila, and motivation to self administer alcohol in rats
Previous studies have implicated ryanodine receptors (RyR) in ethanol phenotypes: in humans, RYR3 was implicated in a GWAS of alcohol response (Joslyn et al., 2010). Ryr1 and Ryr2 upregulation in mouse brain is observed following acute exposure to multiple drugs including alcohol (Kurokawa et al., 2010; Kurokawa et al., 2013) and behavioral changes like conditioned place preference and withdrawal expected following acute exposure are blocked by the RyR antagonist dantrolene (Kurokawa et al., 2010; Kurokawa et al., 2013).
C. elegans has one RyR gene, unc-68. We tested the effect of ethanol on two strains carrying different unc-68 mutations (r1161 and r1162). Loss of unc-68 confers reduced sensitivity to ethanol (minimum p<0.001 for r1162, Figure 4E, F). We also observed consistent effects of mutations in two additional genes with products involved in calcium regulation and known to interact with UNC-68 (Supplementary Materials and Methods, Supplementary Results and Supplementary Figure S7).
There is a single RYR3 ortholog in Drosophila, RyR. We found that two insertional mutations that cause partial loss of function in RyR reduce the development of rapid tolerance to ethanol with no obvious effects on initial sensitivity (Supplementary Materials and Methods, Supplementary Results and Supplementary Figure S8).
The mouse Ryr3 gene is localized to the support intervals for a complex group of ethanol behavioral QTL mapped to Chr 2 but Ryr3 basal whole brain expression (GN113; probeset 1427427_at) is not strongly correlated with ethanol-related phenotypes.
The availability of dantrolene, a pharmacological antagonist of ryanodine receptors, allowed us to assess the effect of antagonism of RyRs on the complex behavior of ethanol self administration in rats. We found that in rats, dantrolene dose-dependently reduced motivation to self-administer ethanol after 50 contiguous days of chronic ethanol self-administration (Supplementary Materials and Methods, Supplementary Results and Supplementary Figure S9).
rs11726136 genotype alters LOC339975 expression in human nucleus accumbens
LOC339975 shows homology only with sequences from other primates. In order to assess the potential functional impact of alleles at rs11726136, we therefore tested AD case and control post-mortem tissue from PFC and NAc for differences in LOC339975 expression by clinical status or genotype. The final numbers available for analysis were for PFC, 28 cases and 30 controls and 50 reference allele T/T and 5 T/G genotypes, and for NAc, 34 cases and 35 controls and 58 T/T and 7 T/G genotypes (Supplementary Table S7).
We included age, sex, ethnicity, brain weight, brain pH, PMI, tissue hemisphere, cause of death, blood toxicology, smoking status, neuropathology and liver pathology as covariates in analysis. Neuropathology and brain weight were both significantly associated with expression level in the NAc; no covariates were associated with expression level in the PFC (Supplementary Table S7). We detected no difference in expression level between AD cases and controls in either NAc (p=0.75) or PFC (p=0.23) (Figure 6A,B and Supplementary Table S7A,B). After controlling for covariates, expression of LOC339975 is significantly reduced in carriers of the associated non-reference allele in NAc (p=0.003, Figure 6C, Supplementary Table S7C) but did not differ by genotype in PFC (p=0.54, Figure 6D, Supplementary Table S7D). Alternative regulation in NAc and PFC is consistent with the presence of several distinct transcription factor binding sites upstream of lncRNA genes (Alam et al., 2014). Although we do not detect case/control differences in expression, our data suggest the associated allele of rs11726136 has functional consequence based on the reduced LOC339975 expression observed in the NAc in heterozygotes.
Figure 6. Expression of long noncoding RNA LOC339975 in human post-mortem nucleus accumbens (NAc) and dorsolateral pre-frontal cortex (PFC) stratified by diagnostic status and by genotype.
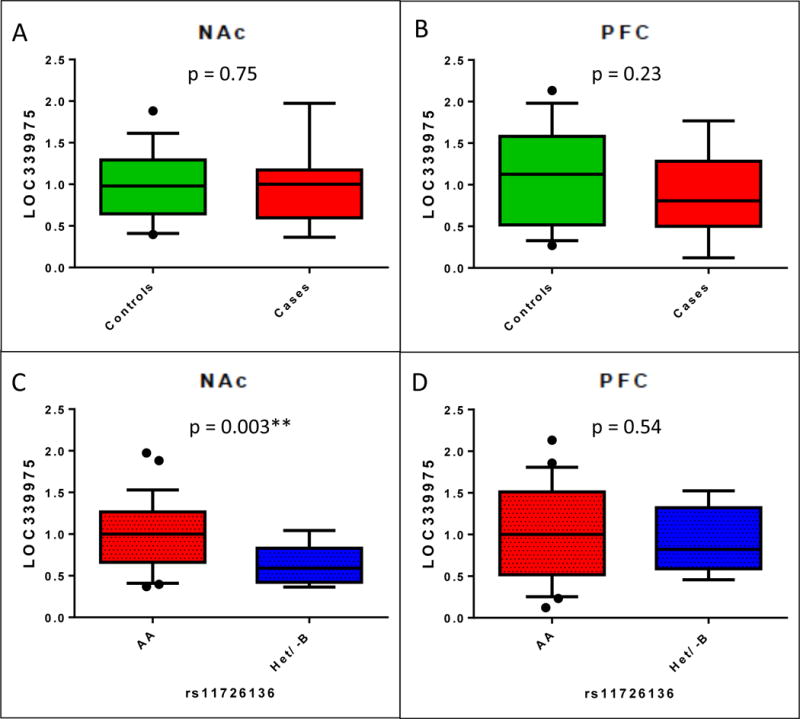
Control mean RIN was 5.6 (SD=1.8), case mean RIN was 5.8 (SD=1.5), and did not differ between cases and controls (Mann-Whitney p=0.78). Samples that did not amplify (NAc, N=13; PFC, N=24) and 4 samples missing rs11726136 genotypes were excluded. Case:control comparisons of LOC339975 expression in A. 34 case and 35 control NAc samples, and B. 28 case and 30 control PFC samples. There were no significant differences in expression between diagnostic groups. Genotypic comparisons of LOC339975 expression in C. 58 reference (T/T) homozygote and 7 T/G heterozygote NAc samples, and D. 50 T/T homozygote and 5 T/G heterozygote PFC samples. While no significant differences in expression by genotype were observed in the PFC, NAc expression was significantly reduced in carriers of the associated non-reference G allele compared to reference allele homozygotes (F=9.72, p=0.003).
Discussion
We identified two novel GWS association signals in COL6A3 and LOC339975, and suggestive signals in a number of loci, including two genes with prior support, KLF12 and RYR3. COL6A3, RYR3 and LOC339975 are further supported by gene-based analyses (Supplementary Table S3). We detect evidence of human replication only for LOC339975 but we observe consistent evidence across multiple MOs that COL6A3, KLF12 and RYR3 orthologs modulate behavioral response to ethanol. Human post-mortem studies show that the AD-associated allele reduces LOC339975 expression in NAc.
Collagen VI A3 (COL6A3)
Collagen IV (Joslyn et al., 2010) and VIII (Edenberg et al., 2010) genes were implicated in ethanol response and AD. COL6A3 is located in a QTL interval for alcohol withdrawal identified in the IASPSAD sample (Kuo et al., 2006). Although this signal did not replicate, our GWS association with potentially functional SNPs (GWAS3D results, Table 1) is supported by the reduced sensitivity after RNAi knockdown in C. elegans (Figure 4A), mapping to the Alcw5 QTL for HIC in mice and the strong correlation between expression and HIC in BXD lines (Figure 5A). COL6A3 encodes a component of the ECM, and there is mounting evidence (Lubbers et al., 2014) that multiple substances of abuse increase ECM remodeling, and that remodeling is required for the expected behavioral changes following exposure. Ethanol dose-dependently induces tissue plasminogen activator (tPA), required for ECM remodeling, which enhances ethanol reward (Bahi and Dreyer, 2012). Withdrawal seizures are reduced in tPA-deficient mice following chronic ethanol administration (Pawlak et al., 2005). Inhibition of proteolytic enzymes that degrade the ECM block escalated responding during acute withdrawal in dependent animals (Smith et al., 2011). Collectively, these results argue that ECM structural components (like COL6A3) and remodeling enzymes are important determinants of ethanol-induced neuroadaptation. We hypothesize that Col6a3 may underlie the Alcw5 HIC QTL.
Krueppel-like factor 12 (KLF12)
Klf12 is regulated by acute ethanol in mouse brain and is a hub in a network of ethanol-responsive genes (Wolen et al., 2012) including many implicated in ethanol response (e.g. Grm3 (Gass and Olive, 2008), Kcnma1 (Davies et al., 2003) and Gsk3b (French and Heberlein, 2009)). Orthologs of KLF12 (Figure 4D) and its binding partner CTBP1 (Bettinger et al., 2012) are required for the development of AFT in C. elegans. The targets of KLF12 regulation are not yet known, but the convergent evidence argues strongly they are central to acute ethanol response and potentially relevant to AD risk.
Ryanodine receptor 3 (RYR3)
RYR3 was implicated in a GWAS of ethanol response (Joslyn et al., 2010) and our observed association may be driven by functional SNPs (GWAS3D analysis, Table 1). In C. elegans, loss of the single RyR gene unc-68 reduces initial sensitivity to ethanol (Figure 4E, F). This mutation would be predicted to decrease intracellular Ca2+. Consistent with this observation, we found that mutations in csq-1, which would be predicted to increase intracellular Ca2+ concentration, increase initial sensitivity (Supplementary Figure S7A). Mutations in the ether-a-go-go-related potassium channel gene unc-103, which has a genetic interaction with unc-68, also decrease sensitivity to ethanol (Supplementary Figure S7D). In Drosophila, reduction of function of the RyR gene blunts rapid tolerance (Supplementary Figure S8B).
The RyR antagonist dantrolene reduces cocaine (Kurokawa et al., 2011) and methamphetamine (Kurokawa et al., 2010) induced conditioned place preference, ethanol withdrawal symptoms (Kurokawa et al., 2013) and motivation to self-administer ethanol after chronic exposure in a dose-dependent manner in rats (Supplementary Figure S9), but these studies are limited by the nonspecificity of dantrolene, an antagonist of both ryanodine and inositol triphosphate receptors, the latter functioning upstream of RyR activation. In myocytes, RyRs provide the Ca2+ ions that activate BK channels (Lifshitz et al., 2011), which have strong effects on ethanol response in vivo and in vitro (Davies et al., 2003; Martin et al., 2008). Ethanol modulates BK channel function in a calcium-dependent manner (Liu et al., 2008) and we hypothesize that RyRs may be involved in this calcium-dependent modulation of BK channel function.
lncRNA LOC339975
lncRNA are of emerging importance in the function and dysfunction of the brain (Roberts et al., 2014). Expression of the estimated 25–50K lncRNA genes in the human genome (Hangauer et al., 2013) is widespread in the brain and highly regulated (Mercer et al., 2008; Guttman et al., 2011). lncRNA are implicated in multiple neurodevelopmental, neurodegenerative and neuropsychiatric diseases, including schizophrenia (Barry et al., 2014), Alzheimer’s (Faghihi et al., 2008), autism (Kerin et al., 2012) and neuronal excitability and epilepsy (Barry et al., 2017). A recent GWAS of AD detected GWS association in the lncRNA LOC100507053 (Gelernter et al., 2014). While this signal is part of the larger ADH gene cluster signal reported and associated SNPs could only be analyzed in African-Americans due to MAF or imputation information, LOC100507053 is anti-sense to multiple ADH genes, and has potential to regulate their expression. Although the role of these transcripts remains unclear, the growing number of reported associations argue that lncRNA genes are also important in human health and disease. Our data suggest the associated allele of rs11726136 may have functional consequence based on the reduced LOC339975 expression observed in the NAc.
Limitations
Unscreened controls: While the use of unscreened controls is common in studies of traits with low population prevalence, unscreened controls are not ideal for traits with the high population prevalence of AD (Wellcome Trust Case Control Consortium, 2007). However, the most likely impact of this lack of screening is for a proportion of controls to be unrecognized and phenotypically misclassified cases. This will reduce the contrast between cases and controls, increase Type II error and reduce study power to detect effects. Importantly, the use of unscreened controls is not expected to increase Type I error and produce spurious positive results.
Lack of strong human replication: The lack of strong human replication is a serious limitation of our study. However, non-replication of novel signals is common in GWAS of AD and may have several causes. Specific to our study, differences in sampling, data production, QC, imputation or analysis can confound meta-analysis. The GESGA sample was imputed to an older, smaller HapMap reference panel, has many missing data points and shows the least consistent sign tests (Table 1 and Supplementary Table S1). The OZALC population sample was genotyped at multiple sites, a well-known source of systematic genotype bias. We note that our strongest replication signals come from analyses of the three samples (Irish, COGA, Yale/Penn) with the most consistent ascertainment and genotyping. More generally, this pattern of non-replication may reflect the multiple independent domains of risk for AD (Kendler et al., 2012), including variation in 1) alcohol-specific physiological measures like initial sensitivity and tolerance (Schuckit et al., 1997), 2) brain reward circuitry implicated in substance use and other pathological behaviors (Volkow et al., 2012),, and 3) personality traits like internalizing and externalizing behaviors (Harford et al., 2013), which are unlikely to be influenced by the same genes. As in other complex traits, these issues will be overcome primarily by increasing sample size and power. Finally, since both KLF12 and RYR3 were previously implicated in substance phenotypes, our findings may be considered as replication evidence for these signals.
Limited phenotypic consilience: Across our MO studies, many different phenotypes are affected by manipulation of candidate orthologs, with little consilience between species. Although mammalian and invertebrate nervous systems show extensive molecular and functional conservation (Bargmann, 1998; Brownlee and Fairweather, 1999) and many drugs mediate their behavioral effects through orthologous target proteins (Matthews and Kopczynski, 2001; Kaletta and Hengartner, 2006), phenotypic consilience and consistent direction of effect following manipulation of a specific gene are not always observed across species (e.g. manipulations of chloride intracellular channel 4 (Clic4) orthologs altered sensitivity in flies and mice but in different directions (Bhandari et al., 2012). There are also differences in ethanol-response measures available for different MOs (e.g. AFT has not been demonstrated in flies despite direct efforts to elicit this response (Chan et al., 2014)). Within species, we observe consilience across studies for effects of 1) Klf-3 and binding partner Ctbp1 on AFT and 2) genes influencing intracellular calcium levels on initial sensitivity in worms, and 2) Col6a3 on HIC in mice.
Conclusions
Our combined data implicate COL6A3, KLF12, RYR3 and LOC339975 in response to ethanol across multiple species and/or AD risk in humans. Our data are also consistent with prior work implicating remodeling of the ECM (COL6A3), regulation of ethanol-responsive genes (KLF12), and regulation of intracellular calcium release (RYR3) in response to ethanol.
Supplementary Material
Acknowledgments
BPR and KSK thank all the members of the Virginia Commonwealth University Alcohol Research Center for their invaluable insight and helpful discussions. AEA, TBB, LMH, FA, DMD, BSM, SAB, BTW, KSK and BPR were supported by National Institute on Alcohol Abuse and Alcoholism grants P20 AA017828 to BPR, KSK, MFM and DMD, R01 AA011408 to KSK and BPR and R37 AA011408 to KSK. AE was supported by National Institute on Alcohol Abuse and Alcoholism grant K01 AA021399 to AE. Sample collection was supported by previous funding of National Institute on Alcohol Abuse and Alcoholism grant R01 AA011408 to CAP and KSK. Control genotyping was supported by National Institute of Mental Health grant R01 MH083094 to BPR and Wellcome Trust Case Control Consortium 2 grant WTCCC-084710. MG thanks Lauren Thomas and Lara Lewellyn for expert technical assistance. Drosophila work was supported by National Institute on Alcohol Abuse and Alcoholism grants P20 AA017828 and R01 AA020634 to MG and MFM. JCB, AGD, LDM, RCR and JTA were supported by National Institute on Alcohol Abuse and Alcoholism grants P20 AA017828 to AGD and JCB and R01 AA016837 to JCB. Some strains were provided by the Caenorhabditis Genetics Center (CGC), which is funded by the NIH Office of Research Infrastructure Programs grant P40 OD010440. MFM was supported by P20 AA017828 and R01 AA020634. VIV, MM, GOM and VSW were supported by R21 AA022749.
Collaborative Study of the Genetics of Alcoholism (COGA): Victor Hesselbrock, Lance Bauer, Grace Chan, Howard J. Edenberg, Xiaoling Xuei, John Nurnberger Jr., Sean O’Connor, Tatiana Foroud, Daniel L. Koller, Leah Wetherill, Samuel Kuperman, John Kramer, Bernice Porjesz, Sun J. Kang, Niklas Manz, Madhavi Rangaswamy, Laura Bierut, John Rice, Kathleen Bucholz, John W. Rohrbaugh, Jen C. Wang, Alison Goate, Marc Schuckit, Jay Tischfield, Andrew Brooks, Laura Almasy, Robert E. Taylor, Danielle M. Dick.
German Study of the Genetics of Addictions (GESGA): Josef Frank, MSc, Sven Cichon, PhD, Jens Treutlein, PhD, Monika Ridinger, MD, Manuel Mattheisen, MD, Per Hoffmann, PhD, Stefan Herms, MSc,, Norbert Wodarz, MD, Michael Soyka, MD, Peter Zill, PhD, Wolfgang Maier, MD, Rainald Mössner, MD, Franziska Degenhardt, MD,, Wolfgang Gaebel, MD, Norbert Dahmen, MD, Norbert Scherbaum, MD, Christine Schmäl, MD, Michael Steffens, MD, Susanne Lucae, MD, Marcus Ising, MD, Bertram Müller-Myhsok, MD, Markus M Nöthen, MD, Karl Mann, MD, Falk Kiefer, MD, and Marcella Rietschel, MD.
Funding Source: This work was principally supported by National Institute on Alcohol Abuse and Alcoholism grants R01-AA-011408 to BPR and KSK, and P20-AA-017828 and P50-AA-022537 to BPR, MFM, KSK, JCB, AGD, MSG, MSB and DMD. A full list of funding sources is included in the acknowledgements.
Footnotes
Author Contributions
BPR conceived and designed the study, acquired funding, organized replication and wrote the manuscript with AEA and LMH. AEA and LMH organized the study and performed primary analyses of the data; TBB performed imputation with assistance from FA for imputation of COGA data; access to COGA data was provided by DMD; AAM undertook QC analyses; BTW oversaw data cleaning, QC, imputation and analysis of genotypic data with assistance from BSM and SAB. VSW, OM, MM and VIV undertook bioinformatic and post-mortem brain studies of LOC339975. AE performed geneset enrichment analysis. RCR, JTA, GGB, LDM, AGD and JCB undertook C. elegans studies. MFM and BPR performed GeneNetwork analyses of archival BxD mouse data. RFC, PB and MG undertook Drosophila studies. RSP, BR and MSB undertook dantrolene studies in rats. DGP, DW, CAP and KSK organized the collection of samples in Ireland and Northern Ireland. The COGA Consortium, JBW, GZ, GWM, AKH, NGM, ACH and PAFM (for the OzAlc Consortium), JF, MR, NW, MS, PZ, MI, MMN, FK, MR and the GESGA Consortium, and JG, RS, RK, LA, HZ, HRK and LAF (for the Yale/UPenn Consortium) provided access to their sample data for replication. All authors contributed to and approved the final manuscript.
Financial Disclosures
M. Ridinger received compensation from Lundbeck Switzerland and the Lundbeck Institute for advisory boards and expert meetings, and from Lundbeck and Lilly Suisse for workshops and presentations. N. Wodarz has received speaker’s honoraria and travel funds from Janssen-Cilag and Essex Pharma. He took part in industry sponsored multi-center randomized trials by D&A Pharma and Lundbeck. H. R. Kranzler has been a consultant or advisory board member for Alkermes, Lilly, Lundbeck, Pfizer, and Roche. He is also a member of the American Society of Clinical Psychopharmacology’s Alcohol Clinical Trials Initiative, which is supported by AbbVie, Alkermes, Ethypharm, Lilly, Lundbeck, and Pfizer. Except as noted above, all other authors report no biomedical financial interests or potential conflicts of interest.
Supplementary information is available at the Alcoholism Clinical and Experimental Research website.
Online Resources:
Trinity College Biobank: http://www.tcd.ie/IMM/trinity-biobank/; accessed June, 2011.
1000 Genomes Project: http://www.1000genomes.org; accessed April, 2016.
GWAS3D: http://jjwanglab.org/gwas3d/gwas3d/gwas3d/welcome; accessed August, 2016.
Mouse Genome Informatics: http://www.informatics.jax.org; accessed February, 2016.
GeneNetwork: http://www.genenetwork.org/webqtl/main.py; accessed February, 2016.
New South Wales Tissue Resource Centre: http://sydney.edu.au/medicine/pathology/trc; accessed December, 2014.
References
- 1000 Genomes Project Consortium. A map of human genome variation from population-scale sequencing. Nature. 2010;467:1061–1073. doi: 10.1038/nature09534. [DOI] [PMC free article] [PubMed] [Google Scholar]
- Alaimo JT, Davis SJ, Song SS, Burnette CR, Grotewiel M, Shelton KL, Pierce-Shimomura JT, Davies AG, Bettinger JC. Ethanol metabolism and osmolarity modify behavioral responses to ethanol in C. elegans. Alcohol Clin Exp Res. 2012;36:1840–1850. doi: 10.1111/j.1530-0277.2012.01799.x. [DOI] [PMC free article] [PubMed] [Google Scholar]
- Alam T, Medvedeva YA, Jia H, Brown JB, Lipovich L, Bajic VB. Promoter analysis reveals globally differential regulation of human long non-coding RNA and protein-coding genes. PLoS One. 2014;9:e109443. doi: 10.1371/journal.pone.0109443. [DOI] [PMC free article] [PubMed] [Google Scholar]
- Atsma F, Veldhuizen I, de Vegt F, Doggen C, de Kort W. Cardiovascular and demographic characteristics in whole blood and plasma donors: results from the Donor InSight study. Transfusion. 2011;51:412–420. doi: 10.1111/j.1537-2995.2010.02867.x. [DOI] [PubMed] [Google Scholar]
- Aulchenko YS, Ripke S, Isaacs A, van Duijn CM. GenABEL: an R library for genome-wide association analysis. Bioinformatics. 2007;23:1294–1296. doi: 10.1093/bioinformatics/btm108. [DOI] [PubMed] [Google Scholar]
- Bahi A, Dreyer JL. Involvement of tissue plasminogen activator “tPA” in ethanol-induced locomotor sensitization and conditioned-place preference. Behav Brain Res. 2012;226:250–258. doi: 10.1016/j.bbr.2011.09.024. [DOI] [PubMed] [Google Scholar]
- Baik I, Cho NH, Kim SH, Han BG, Shin C. Genome-wide association studies identify genetic loci related to alcohol consumption in Korean men. Am J Clin Nutr. 2011;93:809–816. doi: 10.3945/ajcn.110.001776. [DOI] [PubMed] [Google Scholar]
- Bargmann CI. Neurobiology of the Caenorhabditis elegans genome. Science. 1998;282:2028–2033. doi: 10.1126/science.282.5396.2028. [DOI] [PubMed] [Google Scholar]
- Barry G, Briggs JA, Vanichkina DP, Poth EM, Beveridge NJ, Ratnu VS, Nayler SP, Nones K, Hu J, Bredy TW, Nakagawa S, Rigo F, Taft RJ, Cairns MJ, Blackshaw S, Wolvetang EJ, Mattick JS. The long non-coding RNA Gomafu is acutely regulated in response to neuronal activation and involved in schizophrenia-associated alternative splicing. Mol Psychiatry. 2014;19:486–494. doi: 10.1038/mp.2013.45. [DOI] [PubMed] [Google Scholar]
- Barry G, Briggs JA, Hwang DW, Nayler SP, Fortuna PR, Jonkhout N, Dachet F, Maag JL, Mestdagh P, Singh EM, Avesson L, Kaczorowski DC, Ozturk E, Jones NC, Vetter I, Arriola-Martinez L, Hu J, Franco GR, Warn VM, Gong A, Dinger ME, Rigo F, Lipovich L, Morris MJ, O’Brien TJ, Lee DS, Loeb JA, Blackshaw S, Mattick JS, Wolvetang EJ. The long non-coding RNA NEAT1 is responsive to neuronal activity and is associated with hyperexcitability states. Sci Rep. 2017;7:40127. doi: 10.1038/srep40127. [DOI] [PMC free article] [PubMed] [Google Scholar]
- Bergeson SE, Kyle Warren R, Crabbe JC, Metten P, Gene Erwin V, Belknap JK. Chromosomal loci influencing chronic alcohol withdrawal severity. Mamm Genome. 2003;14:454–463. doi: 10.1007/s00335-002-2254-4. [DOI] [PubMed] [Google Scholar]
- Bettinger JC, Leung K, Bolling MH, Goldsmith AD, Davies AG. Lipid environment modulates the development of acute tolerance to ethanol in Caenorhabditis elegans. PLoS One. 2012;7:e35192. doi: 10.1371/journal.pone.0035192. [DOI] [PMC free article] [PubMed] [Google Scholar]
- Bhandari P, Hill JS, Farris SP, Costin B, Martin I, Chan CL, Alaimo JT, Bettinger JC, Davies AG, Miles MF, Grotewiel M. Chloride intracellular channels modulate acute ethanol behaviors in Drosophila, Caenorhabditis elegans and mice. Genes Brain Behav. 2012;11:387–397. doi: 10.1111/j.1601-183X.2012.00765.x. [DOI] [PMC free article] [PubMed] [Google Scholar]
- Bond J, Ye Y, Cherpitel CJ, Room R, Rehm J, Borges G, Cremonte M, Gmel G, Hao W, Sovinova H, Stockwell T. The relationship between self-reported drinking and BAC level in emergency room injury cases: is it a straight line? Alcohol Clin Exp Res. 2010;34:1118–1125. doi: 10.1111/j.1530-0277.2010.01188.x. [DOI] [PMC free article] [PubMed] [Google Scholar]
- Brenner S. The genetics of Caenorhabditis elegans. Genetics. 1974;77:71–94. doi: 10.1093/genetics/77.1.71. [DOI] [PMC free article] [PubMed] [Google Scholar]
- Browning BL, Yu Z. Simultaneous genotype calling and haplotype phasing improves genotype accuracy and reduces false-positive associations for genome-wide association studies. Am J Hum Genet. 2009;85:847–861. doi: 10.1016/j.ajhg.2009.11.004. [DOI] [PMC free article] [PubMed] [Google Scholar]
- Brownlee DJ, Fairweather I. Exploring the neurotransmitter labyrinth in nematodes. Trends Neurosci. 1999;22:16–24. doi: 10.1016/s0166-2236(98)01281-8. [DOI] [PubMed] [Google Scholar]
- Bucholz KK, Cadoret R, Cloninger CR, Dinwiddie SH, Hesselbrock VM, Nurnberger JI, Jr, Reich T, Schmidt I, Schuckit MA. A new, semi-structured psychiatric interview for use in genetic linkage studies: a report on the reliability of the SSAGA. J Stud Alcohol. 1994;55:149–158. doi: 10.15288/jsa.1994.55.149. [DOI] [PubMed] [Google Scholar]
- Chan RF, Lewellyn L, DeLoyht JM, Sennett K, Coffman S, Hewitt M, Bettinger JC, Warrick JM, Grotewiel M. Contrasting Influences of Drosophila white/mini-white on Ethanol Sensitivity in Two Different Behavioral Assays. Alcohol Clin Exp Res. 2014;38:1582–1593. doi: 10.1111/acer.12421. [DOI] [PMC free article] [PubMed] [Google Scholar]
- Cotton NS. The familial incidence of alcoholism: a review. J Stud Alcohol. 1979;40:89–116. doi: 10.15288/jsa.1979.40.89. [DOI] [PubMed] [Google Scholar]
- Crabbe JC. Alcohol and genetics: new models. Am J Med Genet. 2002;114:969–974. doi: 10.1002/ajmg.b.10984. [DOI] [PubMed] [Google Scholar]
- Davies AG, Pierce-Shimomura JT, Kim H, VanHoven MK, Thiele TR, Bonci A, Bargmann CI, McIntire SL. A central role of the BK potassium channel in behavioral responses to ethanol in C. elegans. Cell. 2003;115:655–666. doi: 10.1016/s0092-8674(03)00979-6. [DOI] [PubMed] [Google Scholar]
- Davies AG, Bettinger JC, Thiele TR, Judy ME, McIntire SL. Natural variation in the npr-1 gene modifies ethanol responses of wild strains of C. elegans. Neuron. 2004;42:731–743. doi: 10.1016/j.neuron.2004.05.004. [DOI] [PubMed] [Google Scholar]
- Edenberg HJ, Koller DL, Xuei X, Wetherill L, McClintick JN, Almasy L, Bierut LJ, Bucholz KK, Goate A, Aliev F, Dick D, Hesselbrock V, Hinrichs A, Kramer J, Kuperman S, Nurnberger JI, Jr, Rice JP, Schuckit MA, Taylor R, Todd Webb B, Tischfield JA, Porjesz B, Foroud T. Genome-wide association study of alcohol dependence implicates a region on chromosome 11. Alcohol Clin Exp Res. 2010;34:840–852. doi: 10.1111/j.1530-0277.2010.01156.x. [DOI] [PMC free article] [PubMed] [Google Scholar]
- Faghihi MA, Modarresi F, Khalil AM, Wood DE, Sahagan BG, Morgan TE, Finch CE, St Laurent G, 3rd, Kenny PJ, Wahlestedt C. Expression of a noncoding RNA is elevated in Alzheimer’s disease and drives rapid feed-forward regulation of beta-secretase. Nat Med. 2008;14:723–730. doi: 10.1038/nm1784. [DOI] [PMC free article] [PubMed] [Google Scholar]
- Frank J, Cichon S, Treutlein J, Ridinger M, Mattheisen M, Hoffmann P, Herms S, Wodarz N, Soyka M, Zill P, Maier W, Mossner R, Gaebel W, Dahmen N, Scherbaum N, Schmal C, Steffens M, Lucae S, Ising M, Muller-Myhsok B, Nothen MM, Mann K, Kiefer F, Rietschel M. Genome-wide significant association between alcohol dependence and a variant in the ADH gene cluster. Addict Biol. 2012;17:171–180. doi: 10.1111/j.1369-1600.2011.00395.x. [DOI] [PMC free article] [PubMed] [Google Scholar]
- French RL, Heberlein U. Glycogen synthase kinase-3/Shaggy mediates ethanol-induced excitotoxic cell death of Drosophila olfactory neurons. Proc Natl Acad Sci U S A. 2009;106:20924–20929. doi: 10.1073/pnas.0910813106. [DOI] [PMC free article] [PubMed] [Google Scholar]
- Gass JT, Olive MF. Glutamatergic substrates of drug addiction and alcoholism. Biochem Pharmacol. 2008;75:218–265. doi: 10.1016/j.bcp.2007.06.039. [DOI] [PMC free article] [PubMed] [Google Scholar]
- Gelernter J, Kranzler HR, Sherva R, Almasy L, Koesterer R, Smith AH, Anton R, Preuss UW, Ridinger M, Rujescu D, Wodarz N, Zill P, Zhao H, Farrer LA. Genome-wide association study of alcohol dependence:significant findings in African- and European-Americans including novel risk loci. Mol Psychiatry. 2014;19:41–49. doi: 10.1038/mp.2013.145. [DOI] [PMC free article] [PubMed] [Google Scholar]
- Grotewiel M, Bettinger JC. Drosophila and Caenorhabditis elegans as Discovery Platforms for Genes Involved in Human Alcohol Use Disorder. Alcohol Clin Exp Res. 2015;39:1292–1311. doi: 10.1111/acer.12785. [DOI] [PMC free article] [PubMed] [Google Scholar]
- Guttman M, Donaghey J, Carey BW, Garber M, Grenier JK, Munson G, Young G, Lucas AB, Ach R, Bruhn L, Yang X, Amit I, Meissner A, Regev A, Rinn JL, Root DE, Lander ES. lincRNAs act in the circuitry controlling pluripotency and differentiation. Nature. 2011;477:295–300. doi: 10.1038/nature10398. [DOI] [PMC free article] [PubMed] [Google Scholar]
- Hangauer MJ, Vaughn IW, McManus MT. Pervasive transcription of the human genome produces thousands of previously unidentified long intergenic noncoding RNAs. PLoS Genet. 2013;9:e1003569. doi: 10.1371/journal.pgen.1003569. [DOI] [PMC free article] [PubMed] [Google Scholar]
- Harford TC, Chen CM, Saha TD, Smith SM, Ruan WJ, Grant BF. DSM-IV personality disorders and associations with externalizing and internalizing disorders: results from the National Epidemiologic Survey on Alcohol and Related Conditions. J Psychiatr Res. 2013;47:1708–1716. doi: 10.1016/j.jpsychires.2013.07.016. [DOI] [PMC free article] [PubMed] [Google Scholar]
- Hasin DS, Stinson FS, Ogburn E, Grant BF. Prevalence, correlates, disability, and comorbidity of DSM-IV alcohol abuse and dependence in the United States: results from the National Epidemiologic Survey on Alcohol and Related Conditions. Arch Gen Psychiatry. 2007;64:830–842. doi: 10.1001/archpsyc.64.7.830. [DOI] [PubMed] [Google Scholar]
- Heath AC, Whitfield JB, Martin NG, Pergadia ML, Goate AM, Lind PA, McEvoy BP, Schrage AJ, Grant JD, Chou YL, Zhu R, Henders AK, Medland SE, Gordon SD, Nelson EC, Agrawal A, Nyholt DR, Bucholz KK, Madden PA, Montgomery GW. A quantitative-trait genome-wide association study of alcoholism risk in the community: findings and implications. Biol Psychiatry. 2011;70:513–518. doi: 10.1016/j.biopsych.2011.02.028. [DOI] [PMC free article] [PubMed] [Google Scholar]
- Howie BN, Donnelly P, Marchini J. A flexible and accurate genotype imputation method for the next generation of genome-wide association studies. PLoS Genet. 2009;5:e1000529. doi: 10.1371/journal.pgen.1000529. [DOI] [PMC free article] [PubMed] [Google Scholar]
- Johnson AD, Handsaker RE, Pulit SL, Nizzari MM, O’Donnell CJ, de Bakker PI. SNAP: a web-based tool for identification and annotation of proxy SNPs using HapMap. Bioinformatics. 2008;24:2938–2939. doi: 10.1093/bioinformatics/btn564. [DOI] [PMC free article] [PubMed] [Google Scholar]
- Joslyn G, Ravindranathan A, Brush G, Schuckit M, White RL. Human variation in alcohol response is influenced by variation in neuronal signaling genes. Alcohol Clin Exp Res. 2010;34:800–812. doi: 10.1111/j.1530-0277.2010.01152.x. [DOI] [PubMed] [Google Scholar]
- Kaletta T, Hengartner MO. Finding function in novel targets: C. elegans as a model organism. Nat Rev Drug Discov. 2006;5:387–398. doi: 10.1038/nrd2031. [DOI] [PubMed] [Google Scholar]
- Kamath RS, Martinez-Campos M, Zipperlen P, Fraser AG, Ahringer J. Effectiveness of specific RNA-mediated interference through ingested double-stranded RNA in Caenorhabditis elegans. Genome Biol. 2001;2:RESEARCH0002. doi: 10.1186/gb-2000-2-1-research0002. [DOI] [PMC free article] [PubMed] [Google Scholar]
- Kapfhamer D, Bettinger JC, Davies AG, Eastman CL, Smail EA, Heberlein U, McIntire SL. Loss of RAB-3/A in Caenorhabditis elegans and the mouse affects behavioral response to ethanol. Genes Brain Behav. 2008;7:669–676. doi: 10.1111/j.1601-183X.2008.00404.x. [DOI] [PMC free article] [PubMed] [Google Scholar]
- Kendler KS, Chen X, Dick D, Maes H, Gillespie N, Neale MC, Riley B. Recent advances in the genetic epidemiology and molecular genetics of substance use disorders. Nat Neurosci. 2012;15:181–189. doi: 10.1038/nn.3018. [DOI] [PMC free article] [PubMed] [Google Scholar]
- Kerin T, Ramanathan A, Rivas K, Grepo N, Coetzee GA, Campbell DB. A noncoding RNA antisense to moesin at 5p14.1 in autism. Sci Transl Med. 2012;4:128ra140. doi: 10.1126/scitranslmed.3003479. [DOI] [PubMed] [Google Scholar]
- Kirstein SL, Davidson KL, Ehringer MA, Sikela JM, Erwin VG, Tabakoff B. Quantitative trait loci affecting initial sensitivity and acute functional tolerance to ethanol-induced ataxia and brain cAMP signaling in BXD recombinant inbred mice. J Pharmacol Exp Ther. 2002;302:1238–1245. doi: 10.1124/jpet.302.3.1238. [DOI] [PubMed] [Google Scholar]
- Kuo PH, Neale MC, Riley BP, Webb BT, Sullivan PF, Vittum J, Patterson DG, Thiselton DL, van den Oord EJ, Walsh D, Kendler KS, Prescott CA. Identification of Susceptibility Loci for Alcohol-related Traits in the Irish-Affected Sib Pair Study of Alcohol Dependence. Alcoholism-Clinical and Experimental Research. 2006;30:1801–1816. doi: 10.1111/j.1530-0277.2006.00217.x. [DOI] [PubMed] [Google Scholar]
- Kurokawa K, Mizuno K, Shibasaki M, Ohkuma S. Regulation of ryanodine receptors by dopamine D1 receptors during methamphetamine-induced place conditioning. J Neurochem. 2010;115:1206–1214. doi: 10.1111/j.1471-4159.2010.07010.x. [DOI] [PubMed] [Google Scholar]
- Kurokawa K, Mizuno K, Shibasaki M, Ohkuma S. Dopamine D(1) receptors participate in cocaine-induced place preference via regulation of ryanodine receptor expression. J Pharmacol Sci. 2011;117:87–97. doi: 10.1254/jphs.11106fp. [DOI] [PubMed] [Google Scholar]
- Kurokawa K, Mizuno K, Ohkuma S. Dopamine D1 receptor signaling system regulates ryanodine receptor expression in ethanol physical dependence. Alcohol Clin Exp Res. 2013;37:771–783. doi: 10.1111/acer.12036. [DOI] [PubMed] [Google Scholar]
- Li MJ, Wang LY, Xia Z, Sham PC, Wang J. GWAS3D: Detecting human regulatory variants by integrative analysis of genome-wide associations, chromosome interactions and histone modifications. Nucleic Acids Res. 2013;41:W150–158. doi: 10.1093/nar/gkt456. [DOI] [PMC free article] [PubMed] [Google Scholar]
- Lifshitz LM, Carmichael JD, Lai FA, Sorrentino V, Bellve K, Fogarty KE, ZhuGe R. Spatial organization of RYRs and BK channels underlying the activation of STOCs by Ca(2+) sparks in airway myocytes. J Gen Physiol. 2011;138:195–209. doi: 10.1085/jgp.201110626. [DOI] [PMC free article] [PubMed] [Google Scholar]
- Liu J, Vaithianathan T, Manivannan K, Parrill A, Dopico AM. Ethanol modulates BKCa channels by acting as an adjuvant of calcium. Mol Pharmacol. 2008;74:628–640. doi: 10.1124/mol.108.048694. [DOI] [PMC free article] [PubMed] [Google Scholar]
- Lubbers BR, Smit AB, Spijker S, van den Oever MC. Neural ECM in addiction, schizophrenia, and mood disorder. Prog Brain Res. 2014;214:263–284. doi: 10.1016/B978-0-444-63486-3.00012-8. [DOI] [PubMed] [Google Scholar]
- Martin GE, Hendrickson LM, Penta KL, Friesen RM, Pietrzykowski AZ, Tapper AR, Treistman SN. Identification of a BK channel auxiliary protein controlling molecular and behavioral tolerance to alcohol. Proc Natl Acad Sci U S A. 2008;105:17543–17548. doi: 10.1073/pnas.0801068105. [DOI] [PMC free article] [PubMed] [Google Scholar]
- Mathies LD, Blackwell GG, Austin MK, Edwards AC, Riley BP, Davies AG, Bettinger JC. SWI/SNF chromatin remodeling regulates alcohol response behaviors in Caenorhabditis elegans and is associated with alcohol dependence in humans. Proc Natl Acad Sci U S A. 2015;112:3032–3037. doi: 10.1073/pnas.1413451112. [DOI] [PMC free article] [PubMed] [Google Scholar]
- Matthews DJ, Kopczynski J. Using model-system genetics for drug-based target discovery. Drug Discov Today. 2001;6:141–149. doi: 10.1016/s1359-6446(00)01612-3. [DOI] [PubMed] [Google Scholar]
- Mercer TR, Dinger ME, Sunkin SM, Mehler MF, Mattick JS. Specific expression of long noncoding RNAs in the mouse brain. Proc Natl Acad Sci U S A. 2008;105:716–721. doi: 10.1073/pnas.0706729105. [DOI] [PMC free article] [PubMed] [Google Scholar]
- Metten P, Phillips TJ, Crabbe JC, Tarantino LM, McClearn GE, Plomin R, Erwin VG, Belknap JK. High genetic susceptibility to ethanol withdrawal predicts low ethanol consumption. Mamm Genome. 1998;9:983–990. doi: 10.1007/s003359900911. [DOI] [PubMed] [Google Scholar]
- Park BL, Kim JW, Cheong HS, Kim LH, Lee BC, Seo CH, Kang TC, Nam YW, Kim GB, Shin HD, Choi IG. Extended genetic effects of ADH cluster genes on the risk of alcohol dependence: from GWAS to replication. Hum Genet. 2013;132:657–668. doi: 10.1007/s00439-013-1281-8. [DOI] [PubMed] [Google Scholar]
- Pawlak R, Melchor JP, Matys T, Skrzypiec AE, Strickland S. Ethanol-withdrawal seizures are controlled by tissue plasminogen activator via modulation of NR2B-containing NMDA receptors. Proc Natl Acad Sci U S A. 2005;102:443–448. doi: 10.1073/pnas.0406454102. [DOI] [PMC free article] [PubMed] [Google Scholar]
- Philip VM, Duvvuru S, Gomero B, Ansah TA, Blaha CD, Cook MN, Hamre KM, Lariviere WR, Matthews DB, Mittleman G, Goldowitz D, Chesler EJ. High-throughput behavioral phenotyping in the expanded panel of BXD recombinant inbred strains. Genes Brain Behav. 2010;9:129–159. doi: 10.1111/j.1601-183X.2009.00540.x. [DOI] [PMC free article] [PubMed] [Google Scholar]
- Phillips TJ, Crabbe JC, Metten P, Belknap JK. Localization of genes affecting alcohol drinking in mice. Alcohol Clin Exp Res. 1994;18:931–941. doi: 10.1111/j.1530-0277.1994.tb00062.x. [DOI] [PubMed] [Google Scholar]
- Prescott CA, Caldwell CB, Carey G, Vogler GP, Trumbetta SL, Gottesman II. The Washington University Twin Study of alcoholism. Am J Med Genet B Neuropsychiatr Genet. 2005a;134:48–55. doi: 10.1002/ajmg.b.30124. [DOI] [PubMed] [Google Scholar]
- Prescott CA, Sullivan PF, Myers JM, Patterson DG, Devitt M, Halberstadt LJ, Walsh D, Kendler KS. The Irish Affected Sib Pair Study of Alcohol Dependence: study methodology and validation of diagnosis by interview and family history. Alcohol Clin Exp Res. 2005b;29:417–429. doi: 10.1097/01.alc.0000156085.50418.07. [DOI] [PubMed] [Google Scholar]
- Quillen EE, Chen XD, Almasy L, Yang F, He H, Li X, Wang XY, Liu TQ, Hao W, Deng HW, Kranzler HR, Gelernter J. ALDH2 is associated to alcohol dependence and is the major genetic determinant of “daily maximum drinks” in a GWAS study of an isolated rural Chinese sample. Am J Med Genet B Neuropsychiatr Genet. 2014;165B:103–110. doi: 10.1002/ajmg.b.32213. [DOI] [PMC free article] [PubMed] [Google Scholar]
- Rice DP. Economic costs of substance abuse, 1995. Proc Assoc Am Physicians. 1999;111:119–125. doi: 10.1046/j.1525-1381.1999.09254.x. [DOI] [PubMed] [Google Scholar]
- Riley B, Thiselton D, Maher BS, Bigdeli T, Wormley B, McMichael GO, Fanous AH, Vladimirov V, O’Neill FA, Walsh D, Kendler KS. Replication of association between schizophrenia and ZNF804A in the Irish Case-Control Study of Schizophrenia sample. Mol Psychiatry. 2010;15:29–37. doi: 10.1038/mp.2009.109. [DOI] [PMC free article] [PubMed] [Google Scholar]
- Roberts TC, Morris KV, Wood MJ. The role of long non-coding RNAs in neurodevelopment, brain function and neurological disease. Philos Trans R Soc Lond B Biol Sci. 2014;369 doi: 10.1098/rstb.2013.0507. [DOI] [PMC free article] [PubMed] [Google Scholar]
- Schuckit MA, Tipp JE, Smith TL, Wiesbeck GA, Kalmijn J. The relationship between Self-Rating of the Effects of alcohol and alcohol challenge results in ninety-eight young men. J Stud Alcohol. 1997;58:397–404. doi: 10.15288/jsa.1997.58.397. [DOI] [PubMed] [Google Scholar]
- Schuierer M, Hilger-Eversheim K, Dobner T, Bosserhoff AK, Moser M, Turner J, Crossley M, Buettner R. Induction of AP-2alpha expression by adenoviral infection involves inactivation of the AP-2rep transcriptional corepressor CtBP1. J Biol Chem. 2001;276:27944–27949. doi: 10.1074/jbc.M100070200. [DOI] [PubMed] [Google Scholar]
- Schumann G, Coin LJ, Lourdusamy A, Charoen P, Berger KH, Stacey D, Desrivieres S, Aliev FA, Khan AA, Amin N, Aulchenko YS, Bakalkin G, Bakker SJ, Balkau B, Beulens JW, Bilbao A, de Boer RA, Beury D, Bots ML, Breetvelt EJ, Cauchi S, Cavalcanti-Proenca C, Chambers JC, Clarke TK, Dahmen N, de Geus EJ, Dick D, Ducci F, Easton A, Edenberg HJ, Esko T, Fernandez-Medarde A, Foroud T, Freimer NB, Girault JA, Grobbee DE, Guarrera S, Gudbjartsson DF, Hartikainen AL, Heath AC, Hesselbrock V, Hofman A, Hottenga JJ, Isohanni MK, Kaprio J, Khaw KT, Kuehnel B, Laitinen J, Lobbens S, Luan J, Mangino M, Maroteaux M, Matullo G, McCarthy MI, Mueller C, Navis G, Numans ME, Nunez A, Nyholt DR, Onland-Moret CN, Oostra BA, O’Reilly PF, Palkovits M, Penninx BW, Polidoro S, Pouta A, Prokopenko I, Ricceri F, Santos E, Smit JH, Soranzo N, Song K, Sovio U, Stumvoll M, Surakk I, Thorgeirsson TE, Thorsteinsdottir U, Troakes C, Tyrfingsson T, Tonjes A, Uiterwaal CS, Uitterlinden AG, van der Harst P, van der Schouw YT, Staehlin O, Vogelzangs N, Vollenweider P, Waeber G, Wareham NJ, Waterworth DM, Whitfield JB, Wichmann EH, Willemsen G, Witteman JC, Yuan X, Zhai G, Zhao JH, Zhang W, Martin NG, Metspalu A, Doering A, Scott J, Spector TD, Loos RJ, Boomsma DI, Mooser V, Peltonen L, Stefansson K, van Duijn CM, Vineis P, Sommer WH, Kooner JS, Spanagel R, Heberlein UA, Jarvelin MR, Elliott P. Genome-wide association and genetic functional studies identify autism susceptibility candidate 2 gene (AUTS2) in the regulation of alcohol consumption. Proc Natl Acad Sci U S A. 2011;108:7119–7124. doi: 10.1073/pnas.1017288108. [DOI] [PMC free article] [PubMed] [Google Scholar]
- Sigvardsson S, Bohman M, Cloninger CR. Replication of the Stockholm Adoption Study of alcoholism. Confirmatory cross-fostering analysis. Arch Gen Psychiatry. 1996;53:681–687. doi: 10.1001/archpsyc.1996.01830080033007. [DOI] [PubMed] [Google Scholar]
- Smith AW, Nealey KA, Wright JW, Walker BM. Plasticity associated with escalated operant ethanol self-administration during acute withdrawal in ethanol-dependent rats requires intact matrix metalloproteinase systems. Neurobiol Learn Mem. 2011;96:199–206. doi: 10.1016/j.nlm.2011.04.011. [DOI] [PMC free article] [PubMed] [Google Scholar]
- Storey JD, Tibshirani R. Statistical significance for genomewide studies. Proc Natl Acad Sci U S A. 2003;100:9440–9445. doi: 10.1073/pnas.1530509100. [DOI] [PMC free article] [PubMed] [Google Scholar]
- Thornton T, McPeek MS. Case-control association testing with related individuals: a more powerful quasi-likelihood score test. Am J Hum Genet. 2007;81:321–337. doi: 10.1086/519497. [DOI] [PMC free article] [PubMed] [Google Scholar]
- Treutlein J, Cichon S, Ridinger M, Wodarz N, Soyka M, Zill P, Maier W, Moessner R, Gaebel W, Dahmen N, Fehr C, Scherbaum N, Steffens M, Ludwig KU, Frank J, Wichmann HE, Schreiber S, Dragano N, Sommer WH, Leonardi-Essmann F, Lourdusamy A, Gebicke-Haerter P, Wienker TF, Sullivan PF, Nothen MM, Kiefer F, Spanagel R, Mann K, Rietschel M. Genome-wide association study of alcohol dependence. Arch Gen Psychiatry. 2009;66:773–784. doi: 10.1001/archgenpsychiatry.2009.83. [DOI] [PMC free article] [PubMed] [Google Scholar]
- Volkow ND, Wang GJ, Fowler JS, Tomasi D. Addiction circuitry in the human brain. Annu Rev Pharmacol Toxicol. 2012;52:321–336. doi: 10.1146/annurev-pharmtox-010611-134625. [DOI] [PMC free article] [PubMed] [Google Scholar]
- Wang JC, Foroud T, Hinrichs AL, Le NX, Bertelsen S, Budde JP, Harari O, Koller DL, Wetherill L, Agrawal A, Almasy L, Brooks AI, Bucholz K, Dick D, Hesselbrock V, Johnson EO, Kang S, Kapoor M, Kramer J, Kuperman S, Madden PA, Manz N, Martin NG, McClintick JN, Montgomery GW, Nurnberger JI, Jr, Rangaswamy M, Rice J, Schuckit M, Tischfield JA, Whitfield JB, Xuei X, Porjesz B, Heath AC, Edenberg HJ, Bierut LJ, Goate AM. A genome-wide association study of alcohol-dependence symptom counts in extended pedigrees identifies C15orf53. Mol Psychiatry. 2013;18:1218–1224. doi: 10.1038/mp.2012.143. [DOI] [PMC free article] [PubMed] [Google Scholar]
- Wang X, Pandey AK, Mulligan MK, Williams EG, Mozhui K, Li Z, Jovaisaite V, Quarles LD, Xiao Z, Huang J, Capra JA, Chen Z, Taylor WL, Bastarache L, Niu X, Pollard KS, Ciobanu DC, Reznik AO, Tishkov AV, Zhulin IB, Peng J, Nelson SF, Denny JC, Auwerx J, Lu L, Williams RW. Joint mouse-human phenome-wide association to test gene function and disease risk. Nat Commun. 2016;7:10464. doi: 10.1038/ncomms10464. [DOI] [PMC free article] [PubMed] [Google Scholar]
- Wellcome Trust Case Control Consortium. Genome-wide association study of 14,000 cases of seven common diseases and 3,000 shared controls. Nature. 2007;447:661–678. doi: 10.1038/nature05911. [DOI] [PMC free article] [PubMed] [Google Scholar]
- Willer CJ, Li Y, Abecasis GR. METAL: fast and efficient meta-analysis of genomewide association scans. Bioinformatics. 2010;26:2190–2191. doi: 10.1093/bioinformatics/btq340. [DOI] [PMC free article] [PubMed] [Google Scholar]
- Wolen AR, Phillips CA, Langston MA, Putman AH, Vorster PJ, Bruce NA, York TP, Williams RW, Miles MF. Genetic dissection of acute ethanol responsive gene networks in prefrontal cortex: functional and mechanistic implications. PLoS One. 2012;7:e33575. doi: 10.1371/journal.pone.0033575. [DOI] [PMC free article] [PubMed] [Google Scholar]
- Ystrom E, Reichborn-Kjennerud T, Aggen SH, Kendler KS. Alcohol dependence in men: reliability and heritability. Alcohol Clin Exp Res. 2011;35:1716–1722. doi: 10.1111/j.1530-0277.2011.01518.x. [DOI] [PMC free article] [PubMed] [Google Scholar]
Associated Data
This section collects any data citations, data availability statements, or supplementary materials included in this article.