Abstract
Research on the emotional brain has often focused on a few structures thought to be central to this type of processing – hypothalamus, amygdala, insula, and so on. Conceptual thinking about emotion has viewed this mental faculty as linked to broader brain circuits, too, including early ideas by Papez and others. Here, we discuss research that embraces a distributed view of emotion circuits, and efforts to unravel the impact on emotional manipulations on the processing of several large-scale brain networks that are chiefly important for mental operations traditionally labeled with terms such as “perception,” “action,” and “cognition.” Furthermore, we describe networks as dynamic processes, and how emotion-laden stimuli strongly impact network structure. As networks are not static entities, their organization unfolds temporally, such that specific brain regions affiliate with them in a time-varying fashion. Thus, at a specific moment, brain regions participate more strongly in some networks than others. In this dynamic view of brain function, emotion has broad, distributed effects on processing in a manner that transcends traditional boundaries and inflexible labels, such as “emotion” and “cognition.” What matters is the coordinated action that supports behaviors.
Introduction
Historically, thinking about the brain bases of emotion has fluctuated between a focus on regions and a focus on circuits – just like in other areas of neuroscience.
Work in the 1920s and 1930s focused on understanding the roles of regions “below the cortex” in emotional expression. Starting in the 1860s, studies in which the cerebral cortex of cats and dogs was excised led researchers to propose that emotional expression (for instance, the hissing, growling, and showing of teeth of a cat) was controlled subcortically in the thalamus, nearby structures, or in the brainstem (Finger 1994). Work by Cannon and Bard in the 1920s convinced many that the hypothalamus was the epicenter of this behavior. This research, together with the electrical stimulation studies pioneered by Hess, placed the hypothalamus at the center of the emotional brain.
Decades later, the amygdala would come to the fore as the emotional centerpiece of the brain. Starting with the observations by Weiskrantz (1956) that “psychic blindness” (initially described by Klüver and Bucy in the late 1930s) could be observed in monkeys with more circumscribed lesions involving the amygdala, this structure would be catapulted into center stage in the late 1980s and early 1990s given the discovery of its necessary role in aversive classical conditioning. The initial wave of human neuroimaging work, starting in the 1990s, was able for the first time to systematically investigate emotion in the human brain, and solidified the role of the amygdala as the cornerstone of the emotional brain. Recent work with modern techniques such as optogenetics have also highlighted the role of the amygdala in emotional processing (Tye and others 2011).
At the same time, the idea that emotion should be understood in terms of large-scale circuits was an active countercurrent from early on. Papez (1937) was one of the first to propose a distributed mechanism responsible for emotion involving, among others, the hypothalamus, hippocampus, anterior thalamus, and cingulate gyrus. MacLean (1949) built directly upon Papez's ideas and proposed a circuit involving the cingulate gyrus and subcortical regions, such as the hypothalamus. Later, Morgane, in particular, argued persuasively against “emotion centers” in the brain. He proposed that the hypothalamus should be understood as “only a single link in a larger multicircuit complex rather than … an entity unto itself controlling any behavior as some form of command center” (Morgane 1979, p. 7). This stance stood in stark contrast to a more traditional viewpoint that the hypothalamus functions as a “head ganglion” that operates as an overall controller region. Subsequently, Barbas (1995) emphasized how emotion circuits involve sensory cortices, too. Sensory cortices project both to the amygdala and the orbitofrontal cortex, which are then positioned to assess the emotional and motivational significance of the stimuli. Interestingly, the amygdala also projects to the orbitofrontal cortex at the very sites that receive sensory inputs also received by the amygdala. Some researchers have emphasized not only that certain regions participate in emotional functions, but that they work together as “networks” (Lindquist and others 2012; Pessoa 2008; Pessoa and others 2010). Finally, cognitive-emotional interactions and integration have been described (Barbas 1995; Pessoa 2013).
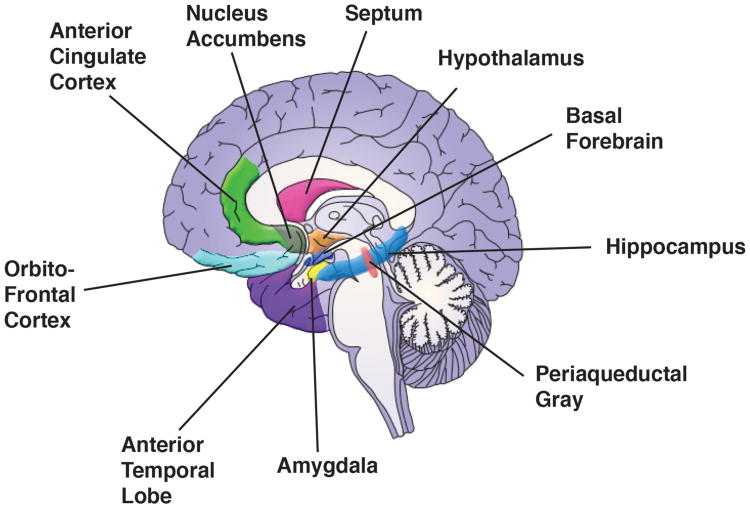
Today, the number of brain regions discussed in emotion research has grown considerably (Figure 1). But as described here, a more effective approach is one that focuses on how assemblies of many of these regions, together with those commonly labeled as “perceptual,” “motor,” “motivational,” and “cognitive” carry out the functions required to support behaviors. In this type of framework, what is important is not a brain region's anatomical location, but its position in a space of functional relationships to other regions. And from the perspective of a brain region, at a given time, a region affiliates with a set of other regions, thereby defining a momentary circuit – a spatiotemporal network --, as illustrated below.
Figure 1.
Brain regions discussed in emotion research. Although research often focuses on the role of a given region, how they interact with one another, as well as other brain regions, is crucially important. The insula, which is often discussed in the context of emotional processing, is not shown on the medial slice. All region locations are shown schematically at approximate locations.
Large-scale brain connectivity and emotion
To date, for the most part, emotion circuits have been largely emphasized at a relatively small scale. Conceptual frameworks are therefore greatly needed to understand large-scale properties of the emotional brain. In this section, we describe three general principles of the organization of the emotional brain. In fact, because the emotional brain is not a distinct unit of the brain, we need to understand architectural features of the brain more generally.
Principle 1: High anatomical connectivity
Computational network analysis of anatomical connectivity demonstrates that both cortical and subcortical brain regions are highly interconnected (Markov and others 2013; Modha and others 2010). High connectivity is not limited to specific sectors of the brain but instead includes all of them: occipital, temporal, parietal, and frontal lobes, as well as cingulate, insula, thalamus, and basal brain regions (subcortical nuclei at the base of the forebrain, including the amygdala and basal ganglia).
We currently lack sufficiently detailed data on anatomical connections to arrive at a more definitive picture of the precise architecture of the brain. Whatever the final picture, we know that it will include at least two components: high connectivity and high global accessibility. The latter component indicates that two brain regions can communicate via multisynaptic pathways that are relatively short (often via two or three steps). Furthermore, some parts of the overall brain network likely function as highly connected “cores.” Two properties of anatomical connectivity cores are that (i) a core is a subnetwork that is more tightly connected than the overall brain network; and, relatedly,(ii) information likely spreads more swiftly within a core than through the overall brain network. Some analyses have highlighted a brain core that involves all brain sectors (Modha and others 2010), while others propose a core that is more anatomically circumscribed, though still quite spatially distributed, and involving frontal/prefrontal, temporal, and parietal cortex (Markov and others 2013).
Although the properties of high anatomical connectivity/accessibility apply to the entire brain, the organization of emotion in the brain must be understood from the standpoint of this general architectural property. Furthermore, it is noteworthy that many regions implicated in emotion are very highly connected (Modha and others 2010; Swanson 2000; Young and others 1994). This property of extensive anatomical connectivity has been discussed elsewhere for several structures, including the amygdala and hypothalamus (Pessoa 2013).
Principle 2: Anatomical connectivity to and from the body
Because emotion is closely linked to bodily states, brain circuits that involve signals to and from the body are important for emotion. It is not surprising, therefore, that the hypothalamus and the insula, for example, are often listed as part of the emotional brain.
To illustrate the to-the-body part, consider the hypothalamus. Classical studies showed that “decortication” (that is, removal of cortex) alone did not abolish emotional expression, but that decortication plus ablation of the hypothalamus had a much more substantial effect on this expression. Current understanding of hypothalamic function reveals that this structure is involved in important body-related operations. Indeed, hypothalamic mechanisms contribute to a wealth of processes, including circadian rhythms, wakefulness and sleep, stress responses, temperature regulation, food intake, thirst, sexual behaviors, and defensive behaviors. To carry out these functions, the hypothalamus works in concert with a multitude of other sites, several of which are located in the brainstem and spinal cord.
Cortical regions with substantial body-related signals include the medial orbitofrontal cortex, the cingulate gyrus, and the insula – illustrating the from-the-body part. Consider, for example, the insula. The physiological condition of the entire body is conveyed to the posterior insular cortex, including individually mapped and distinct feeling-related signals from the body (Craig 2009). These signals are also present in the mid-insula and the anterior insula, which integrate body-related signals with activity that is associated with emotionally salient stimuli, among others. Thus, the insula, especially its posterior part, can be considered interoceptive cortex, much like parts of parietal cortex are considered somatosensory cortex, for example.
The combination of principles 1 and 2 indicates that the impact of brain regions that influence the body and, conversely, brain regions that are influenced by the body, extends well beyond those with more direct anatomical pathways to and from the body.
Principle 3: High functional connectivity
Understanding how regions contribute to brain function requires characterizing how they are “functionally connected,” in addition, of course, to how they are anatomically connected. Functional connectivity is a concept that was devised to characterize how neurons interact and was defined as the “coherence” among the activity of different neurons. Functional connectivity thus answers the following question: how coordinated is the activity of two brain regions that may or may not be directly anatomically connected?
Whereas it is natural to anticipate a functional association between brain regions that are directly connected, the relationship between structural and functional connectivity is not always a simple one. A striking example of structure-function dissociation is illustrated by an unusual population of adults without the corpus callosum, a structure that provides the major communication pathway between the two hemispheres. Although starkly different structurally relative to controls, individuals without the callosum exhibited very similar patterns of functional connectivity (as measured during rest with functional MRI; Tyszka and others 2011). Thus, largely normal coordinated activity can emerge in brains with dramatically altered structural connectivity. In all, the functional organization of the brain is driven by factors that go beyond direct structural connectivity.
Therefore, to understand the organization of emotion in the brain, in addition to characterizing the brain's structural anatomy, it is necessary to characterize the functional relationships between brain regions. Importantly, anatomical architectural features support the efficient communication of information even when strong direct structural connections are not present, and support functional interactions that will vary based on context. This is illustrated, for example, by a “one-step” property of amygdala-prefrontal cortex connectivity (amygdala signals reach nearly all prefrontal regions via a single connectivity step within prefrontal cortex; Averbeck and Seo 2008). This anatomical property allows the amygdala to engage in functional interactions with, for instance, lateral prefrontal regions that are not supported by strong direct anatomical connections.
Large-scale functional brain networks
In the last decade, great progress has been made in understanding the organization of large-scale brain networks. Here, we briefly comment on developments derived from human functional MRI research.
Functional MRI data provide signal measurements across the entire brain. Accordingly, one can define the functional connectivity between all pairs of locations. The resulting functional connectivity matrix can then be analyzed with tools from network science (Box 1). The idea is to conceptualize the data as a graph, with vertices and edges that link them. The graph is an abstract structure that can be formally studied, but the vertices can represent arbitrary types of objects (people in a city, computers in a network, regions in the brain) and edges can represent arbitrary relationships between the objects (people who know one another, computers that are directly connected to one another, functional connectivity between two regions).
Box 1. Brain networks.
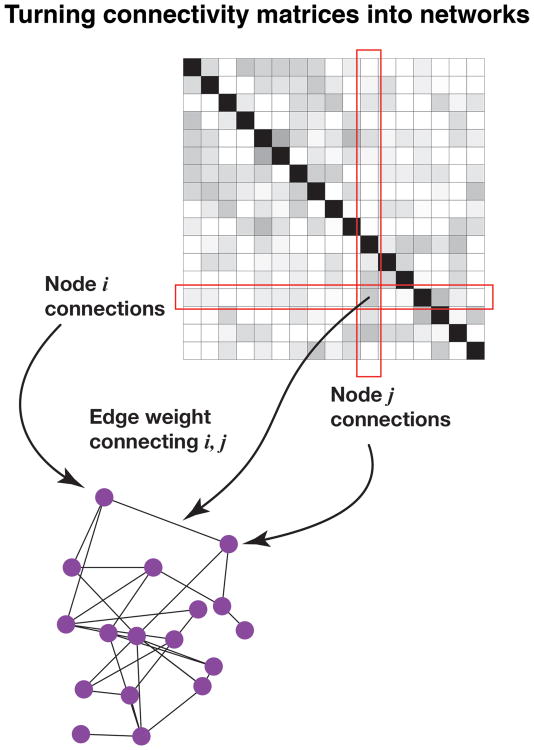
A common starting point in network science is to describe the data as a graph, with nodes (also called vertices) and edges that link them (Newman 2010). The graph is an abstract structure that can be formally studied; the nodes represent arbitrary types of objects and edges represent arbitrary relationships between the objects. In functional brain networks, nodes represent brain “regions” (at the desired level of spatial resolution) and edges represent the functional connectivity between them (Rubinov and Sporns 2010). The latter can be determined, for example, by computing the correlation between the time series associated with brain regions. In this manner, a functional connectivity matrix can be defined that summarizes the relationships between all pairs of nodes (Figure 1 of Box 1).
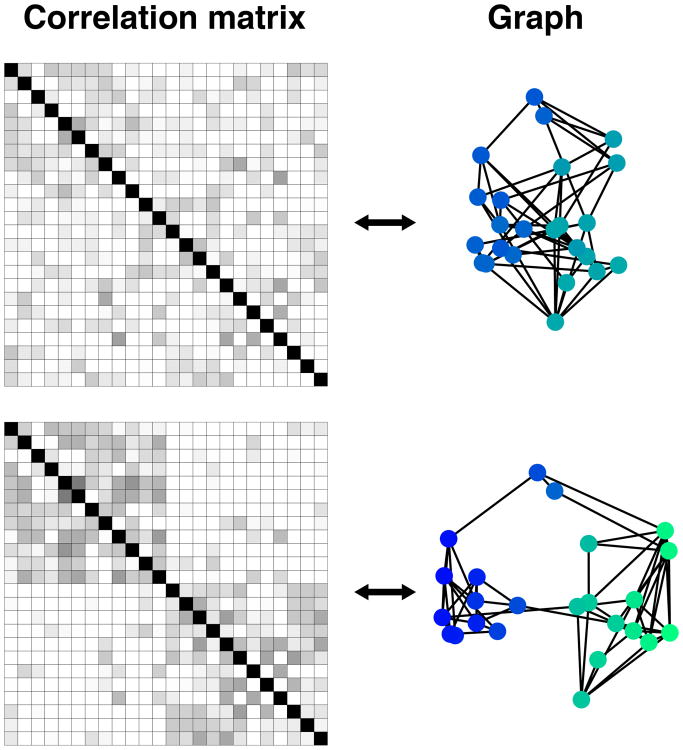
Two general types of measures can be computed. Node-level measures describe a property of a node, such as the total number of its connections (binary version of the measure called degree) or the sum of the weights of all edges of a node (continuous version of degree). Network- (or subnetwork) level measures describe a property that applies to a collection of nodes, such as modularity, namely the tendency of the set of nodes to be decomposable in relatively autonomous communities (or clusters) of nodes. Modularity measures the “quality” of different partitions (that is, clustering of nodes) of a network based on specific criteria. For example, modularity might be based on the proportion and/or strength of within- to between-community edges, on the intuition that good “modules” are densely clustered compared with their surroundings (Figure 2A of Box 1). From the perspective of connectivity matrices, different correlation structures will be associated with different modularity values and potential partitioning of the nodes (Figure 3 of Box 1).
Here, we describe an approach to modeling networks (that is, graphs) based on “random walks,” which has the advantage that it considers all possible paths of information transfer between nodes. The approach can be thought of as modeling a network as a lattice of resistors by transforming edge weights (that is, functional connectivity) into electrical conductances (that is, 1/resistance). The efficiency between nodes A and B is defined as the net conductance observed when a fixed current source is applied to A and a ground is set to B (Figure 2B, Box 1). The amount of current that passes through a third node C measures the extent to which node C is “between” A and B, and defines a measure called betweenness (Figure 2B, Box 1).
Increased efficiency of a network reflects increases in functional connectivity involving the edges of that network. Increased betweenness of a node reflects the extent to which signals potentially pass through the node for all of its connections, and can be used to capture the notion of “centrality.” At the network level, increased betweenness of a network suggests that the nodes in the network participate more heavily in the functional connections between other networks (that is, they become more “central”).
The measures of efficiency and betweenness can be used to compute several properties of an overall network, or specific subnetworks. For example: 1)within-network efficiency, defined as the average efficiency between all pairs of nodes within a network, 2) between-network efficiency, defined as a network's average efficiency with each of the other networks, 3) network-betweenness, defined as the average betweenness for all nodes in a network considering edges to other networks; and 4) global efficiency, defined as the average conductance between all the possible node pairs.
Figure 1, box 1.
Turning connectivity matrices into graphs.
Figure 2, box 1.
Network properties. (A) Modularity. (B) Efficiency and betweenness.
Figure 3, box 1.
Connectivity matrix and corresponding graph “force layout” (linked nodes attract each other as a function of edge weight and non-linked nodes are pushed apart). The top graph is poorly segregated, and the bottom graph has discernible community structure.
Network analysis of functional MRI data has been extensively applied to “resting” states, in which participants are asked to remain relaxed in the scanner without performing a specific effortful task (for example, they may be asked to stare at a fixation point for a few minutes). A central finding is that, at “rest,” brain regions can be grouped into a relatively small number of stable “communities,” also called clusters or subnetworks (or simply networks). For example, Yeo and colleagues (2011) described a seven-community parcellation of cortical areas based on a very large sample of participants. Based on anatomical and functional considerations, the communities were labelled with such names as “visual,” “frontoparietal,” “default,” etc. An example parcellation with six communities is shown in Figure 2.
Figure 2.
Large-scale brain networks. Functional MRI in the absence of an explicit task (“rest”) reveals multiple distributed networks, each of which is composed of regions whose signal fluctuations are correlated. Different colors indicate distinct networks.
Network analysis during rest, together with consideration of task data, has led to the proposal of the existence of several brain networks. One such network is called the salience network, which is thought to be important for orienting attention to conspicuous stimuli, including those linked to potential threats. It has been suggested that this network mediates attention to the external and internal worlds (Menon and others 2010); the salience network is also thought to be important in the taking of rapid, unpremeditated actions. Although specific proposals of the salience network differ in terms of the brain regions involved, key nodes include the anterior insula, the anterior cingulate cortex, and the thalamus. A second network is called the executive control network, which is thought to be important for the control of executive functions involving goal-oriented processing, deliberate attention, and working memory. Fronto-parietal regions, including the intraparietal sulcus, frontal eye fields, and dorsolateral prefrontal cortex are important nodes of this network. A third network is called the task-negative network (also called “default”), a name given because it is robustly observed in the absence of effortful tasks, typically during resting state scans. This network is associated with episodic memory retrieval, autobiographical memory, and semantic memory related to internal thought, among other functions. Important nodes of this network include the posterior cingulate cortex, and anterior medial prefrontal cortex.
At times, researchers have focused on a few regions (as few as two or three) of the networks described above, treating them almost as “minimal networks.” However, large-scale computational analysis of brain data can be used to identify large groups of regions that co-activate either during resting state scans or during specific tasks (for example, see Figure 2).
How does emotion influence large-scale brain networks?
Anatomically, the amygdala receives focal projections from anterior regions of visual cortex in the inferior temporal cortex. These regions are sensitive to elaborate visual properties, including object shape. In contrast, the outgoing connections of the amygdala to visual cortex are quite extensive and make contacts throughout a large extent of the ventral visual system (including both temporal and occipital cortices). Indeed, the connections extend as far posteriorly as the primary and secondary visual regions (V1 and V2, respectively). Thus, the amygdala is well situated to influence processing according to the emotional significance of a visual stimulus. Indeed, not only are visual responses to stimuli with affective significance enhanced in visual cortex (for example, a stimulus paired with mild shock evokes stronger responses than an unpaired one), but functional connections between the amygdala and visual cortex are enhanced, too (Pessoa and others 2002). In other words, when participants view emotional items, responses in the amygdala and visual cortex are more coordinated, indicating that they can be considered a stronger functional unit.
In one study (Damaraju and others 2009), the functional connectivity pattern between early visual areas was investigated during affective and neutral contexts (we considered signals in visual regions V1, V2, V3, and V4). During the affective context, participants viewed faces that were surrounded by a ring whose color signaled the possibility of mild shock. During the neutral context, faces appeared surrounded by a ring whose color signaled safety. A measure of functional connectivity was strengthened during the affective relative to the neutral context. Thus, the affective context not only changed the magnitude of evoked responses but also altered the pattern of responses across multiple regions in early visual cortex – they became more coherent across visual early visual cortex.
In a later study (Kinnison and others 2012), we focused on a larger group of regions to investigate network properties. In previous studies, graph-theoretical analysis of functional neuroimaging data had focused largely on characterizing the large-scale properties of resting state data. Instead, we sought to understand the network properties of a focused set of brain regions during task conditions engaging them. Data from two separate studies were investigated in which emotional or motivational cues preceded the execution of a “cognitive” task. Our central question was the following: how does emotional/motivational information reorganize brain networks?
In the emotion study (Choi and others 2012), participants viewed an initial cue that determined whether they were in a threat or safe trial. A variable delay period (2-6 seconds) separated this cue stimulus and the stimulus on which they performed a simple task. During threat trials, participants could receive a mild electrical shock to the finger during the delay period; participants were also informed that, during safe trials, shocks would not be administered. The motivation study(Padmala and others 2011) had the same overall structure but the initial cue indicated whether they were in a reward or a control trial; in reward trials, participants could earn actual money (if task performance was fast and correct) that they collected at the end of the experimental session.
In both emotion and motivation studies, we first identified the regions that were engaged by the cue. The set of active regions was then clustered into groups based on the responses to the cues. Clustering identified groups of regions (communities) whose responses were more alike. The question of interest was then to determine how emotion/motivation cues altered the network organization observed during the baseline conditions. The effects of emotional and motivational cues exhibited several similarities. At the overall network level, global efficiency (a measure of integration; Box 1) increased. In other words, the overall networks became less segregated with the context signaled by the cue (possible shock in one experiment, possible reward in the other), revealing that one way in which emotional and motivational processing affect brain responses is by increasing functional connections across disparate clusters of brain regions (Figure 3A).
Figure 3.
Brain networks and threat processing. (A) Top: Network configuration during the safe condition. The “force layout” illustrates the clustering of the regions into two communities (teal and red nodes). Bottom: During the threat condition, increased connectivity was observed between communities. (B) Changes in threat vs. safe functional connectivity. The square outlines enclose the regions for the two separate communities (C1 and C2). For abbreviations, see Kinnison and others (2012).
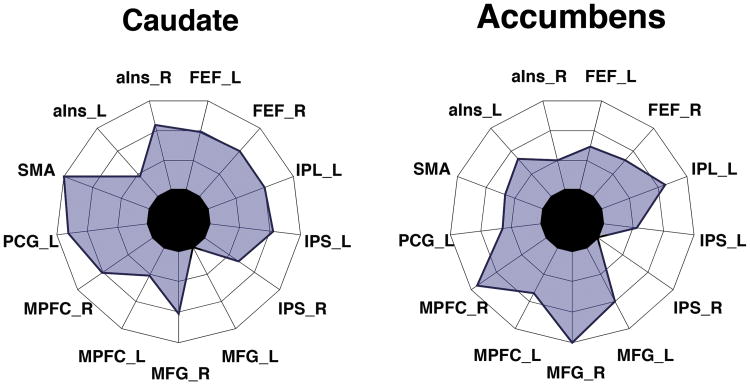
We interpreted our findings within the framework of the dual competition model (Pessoa 2009) which describes interactions between perception/cognition and emotion/motivation. The framework proposes that the effects of reward during perception and cognition depend in part on interactions between valuation regions, on the one hand, and fronto-parietal regions important for attention and executive control, on the other. Such interactions lead to the up-regulation of control and improve behavioral performance during challenging task conditions (and higher likelihood of reward). The increased functional connectivity between the two communities detected in the motivation dataset (not shown here) is consistent with these ideas, and they also reveal that the increases in connectivity can be spatially distributed and quite broad. For example, the caudate and the nucleus accumbens showed increases in functional connectivity to nearly all cortical regions that were systematically driven by reward (Figure 4).
Figure 4.
Distributed changes in functional connectivity. Changes in connectivity (threat minus safe) of the caudate (left) and accumbens (right) illustrating strengthening of connections between communities (all regions shown are from the “cortical” community; C1 in Figure 3). For abbreviations, see Kinnison and others (2012).
In the emotion study, we observed enhanced functional integration between subcortical regions (such as the bed nucleus of the stria terminalis and thalamus) and cortical regions (including the insula and medial PFC) (Figure 3A). Whereas in the case of reward, functional connectivity increased within cortex, in the case of threat, functional connectivity decreased within cortex for several pairs of regions (Figure 3B). How should we interpret the latter findings? Several proposals suggest that emotional processing diverts resources that also are needed for executive function, resulting in impaired cognitive performance. Therefore, reduced functional connectivity among some of the cortical areas may have reflected the interference that the threat of shock exerted on subsequent task performance.
Our findings revealed several ways in which both emotional and motivational processing alter network organization, including increased global efficiency. The results of our study indicate that the processing of emotional and motivational stimuli enhance vertical, cortical–subcortical functional integration in a manner that may be behaviorally appropriate. Potential reward may contribute to improved task performance (and reward attainment), and potential threat may redirect mental resources in the service of mobilizing the body toward safeguarding the organism against harm.
Hermans and colleagues (2011) studied how network organization is altered during emotional states. To do so, they scanned participants with functional MRI while they watched highly aversive movie segments. During such segments, several regions of the salience network were engaged more strongly than when watching neutral movie segments. The authors studied the pattern of co-activation (that is, functional connectivity) across the regions of the salience network. They found that a measure of network “strength” (related to the efficiency measure discussed here) correlated positively with the change in negative affect, namely, stronger signal correlations in the network were associated with stronger reports of negative affect upon seeing the aversive movies. Notably, pharmacological administration of the drug propranolol decreased the strength of functional connectivity within the salience network (relative to placebo). Propranolol is a so-called beta-blocker, which decreases stress-related peripheral measures. Indeed, with propranolol intake, the authors found reduced heart rate compared to the placebo condition. Given the action of propranolol on noradrenergic mechanisms, and the important role of the locus coeruleus (which sends noradrenergic projections throughout the brain) region of the brainstem in these mechanisms, the authors suggested that this region regulates the strength of the salience network. In all, the authors suggested that the early phase of the “stress response” triggers a sensory hypervigilant state that is linked to increased processing via the strengthening of functional connectivity within the salience network (in large part due to the action of the locus coeruleus).
How does emotion influence how network organization unfolds across time?
As illustrated by the study by Hermans and colleagues (2011), anxious states induced by acute, unpredictable stressors have widespread effects on brain function that are associated with changes in the organization of large-scale brain networks (see also Thomason and others 2011). But how do changes in network organization unfold across time?
To address this question, in a recent study (McMenamin and others 2014), we focused on three networks that have been extensively studied in the literature (and already discussed above) but whose changes during emotional manipulations is poorly understood: the salience network, the executive control network, and the task-negative network. From a previous study (Kinnison and others 2012), we knew that the anticipation of mild shock altered interactions within and between networks (Figure 3). However, the use of short-duration trials did not allow us to characterize temporally sustained changes to functional connectivity. In the more recent study (McMenamin and others 2014), the goal was to unravel changes to network organization as participants encountered a threat and continued in a “threat state” for a more prolonged duration.
Non-human research suggests that the amygdala plays a role in transient acute threat (“fear”) responses but the bed nucleus of the stria terminalis (BNST) is implicated in more sustained potential threat (“anxious”) processing (Shi and others 1999; Walker and others 2003). Correspondingly, human neuroimaging studies have found transient amygdala responses following cues of imminent threat and sustained responses during prolonged threat in locations consistent with the BNST (Alvarez and others 2011; Mobbs and others 2010; Somerville and others 2010). However, how the amygdala and BNST interact with other brain networks during the processing of extended threat is poorly understood. Thus, an important goal of our study was to characterize the contributions of the amygdala and BNST to network reorganization during potential threat.
In the experiment, we informed participants that a colored (say, yellow) circle on the screen indicated that they were in a threat block and mild electric shocks would be delivered randomly to their left hand, whereas a circle of another color (say, blue) indicated that they were in a safe block and no shocks would be delivered. Each block had an average duration of 60 seconds. Here, we discuss changes in network organization during an “early” period (transient response that peaked at 5 s after block onset) and an “intermediate” period (more sustained-response period from 7.5-17.5 s after block onset).
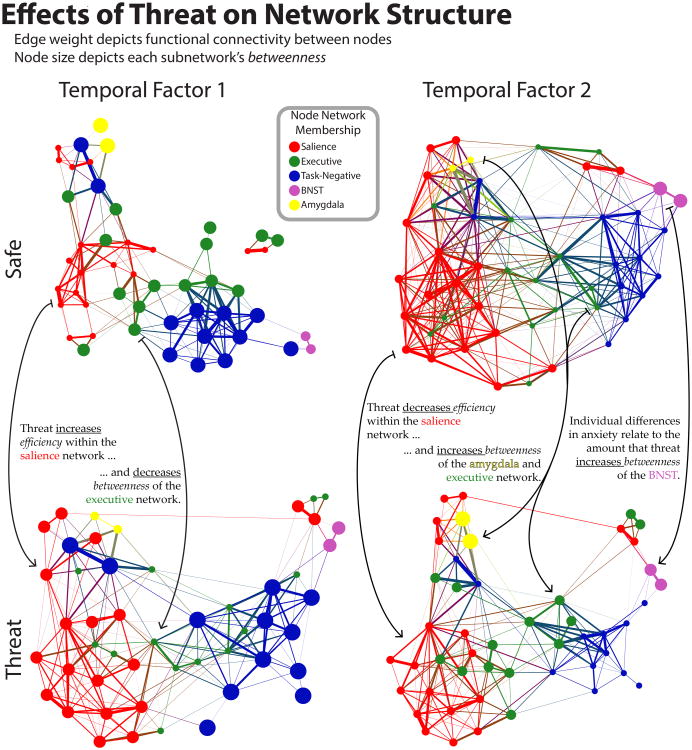
We first studied the effect of threat on network organization during the initial transient response. Two network properties were investigated, efficiency and betweenness (Box 1). The onset of a threat period increased efficiency within the salience network and decreased the betweenness of the executive control network (Figure 5). This suggests that threat possibly increased communication within the salience network, and decreased the extent to which the executive control network facilitated communication between other networks. Put another way, signaling within the salience network became more effective, as reflected in the tighter correlation between pairs of regions in this network. In addition, the executive network became more segregated from communication between other networks.
Figure 5.
Effects of threat on network organization. Force-layout depiction of the network organization in each condition (safe, threat) for the transient (“Temporal Factor 1”) and sustained (“Temporal Factor 2”) periods. Nodes are colored according to their network, and edge width corresponds to the magnitude of functional connectivity. Node size depicts the betweenness for that network/node. Reprinted with permission from McMenamin and others (2014).
Notably, although changes in network organization were detected at the onset of threat blocks, only minimal activation differences were observed between the threat and safe conditions. A potential reason for the lack of robust response differences is that both block onsets were motivationally salient; the onset of threat blocks because they signaled potential shock and the onset of safe blocks because they signaled safety. More generally, this example illustrates an important principle, namely, that differences in activation can be dissociated from differences in co-activation.
The main goal of the study was to characterize changes in network organization during sustained periods of threat monitoring (“anxious” periods). How were the networks organized after the initial transient processing of the threat cue? During the intermediate period, threat decreased efficiency in the salience network, opposite to the effect detected during the initial period. Thus, increases in functional connectivity in the salience network when participants viewed a threat cue were not maintained for the duration of the anxious state, highlighting the need to characterize how network organization unfolds with time.
Notably, changes in network organization during the intermediate period involved the amygdala and BNST. During the intermediate period, threat increased amygdala betweenness. This finding was notable given that in human studies the amygdala does not evoke robust responses when threat is more diffuse, distal, or unpredictable. Our results of changes in functional connectivity are thus consistent with the idea that, during prolonged aversive states, the amygdala influences the communication between brain networks more so than simply responding more strongly to threat stimuli – again highlighting the dissociation between activation and co-activation. In addition, during the same intermediate period of threat blocks, BNST betweenness was associated with individual differences in anxiety scores, with greater increases in betweenness observed for participants with higher anxiety. Because the BNST also exhibits responses that are more sustained during anxious states, it appears that the BNST not only becomes more central to signal communication during anxious states, but it also influences processing by generating stronger responses.
Dynamics of emotional networks
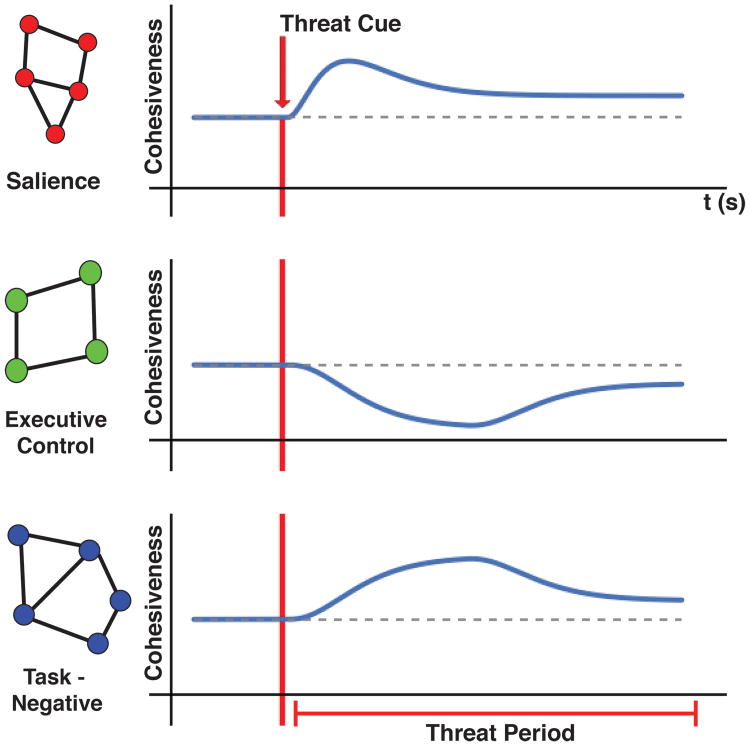
As the brain is highly dynamic, we need to understand the temporal dynamics of brain networks, too. The study reviewed in the previous section (McMenamin and others 2014) described a simple illustration of network organization unfolding across time. The studies discussed here, as well as a growing literature (see Hermans and others 2014), suggests the following scheme. Potential threat triggers a cascade of network-level events. A cue signaling a threat context initially engages a group of brain regions important for processing events of potential relevance – what can be called a salience network. At the same time, a group of regions important for executive control is transiently affected in a manner that renders it less effective at handling demanding control operations (such as inhibition, switching, and maintenance of information). This last change is accompanied by a transient strengthening of the task-negative network, which more or less parallels the effects of threat on the executive control network, but in the opposite direction (Figure 6).
Figure 6.
Network dynamics during threat-period processing. Entering a state of threat triggers changes in the cohesiveness of large-scale networks. Cohesiveness can be indexed via several graph measures, including efficiency.
These transient effects are followed by a series of more sustained events and indicate a partial recovery from threat. Salience-related processing decreases, while the executive-control network re-coheres. In parallel, parts of the task-negative network become less integrated (Figure 6). These effects are envisaged to be dependent on the strength and imminence of the threat manipulation. In cases where threat is not too powerful/imminent the scenario described would be expected to hold. However, as the strength/imminence increases, the above trend would decrease; in other words, less decrease in salience processing, and stronger (and opposite) changes to the executive-control and task-negative networks.
Two brain regions play an important role in the flow of information during sustained periods of threat: the amygdala and BNST. Overall brain states depend on signal communication within and between networks. During sustained threat, both the amygdala and BNST become more central to communication. In this manner, they play an important role in determining the strength of the anxious state. For example, if threat is stronger and more imminent, an apprehension state can result that focuses processing resources on the threat, leaving fewer resources for processing that is threat-unrelated.
The example of changes of network organization from a transient encounter with a threat cue to a more sustained state of threat monitoring (Figure 5) is, of course, an extremely rudimentary case of network dynamics. A more desirable description would be to track how a network property P changes with time. Thus, more generally, we would like to estimate PN (t), that is, the property P at time t for network N (if the property in question is at the network level) or node N (if the property in question is at the node level). Indeed, the past few years have witnessed the fast growth of techniques to study the dynamics of networks in general (for example, Kolar and others 2010), and brain networks in particular (for example, Braun and others 2015).
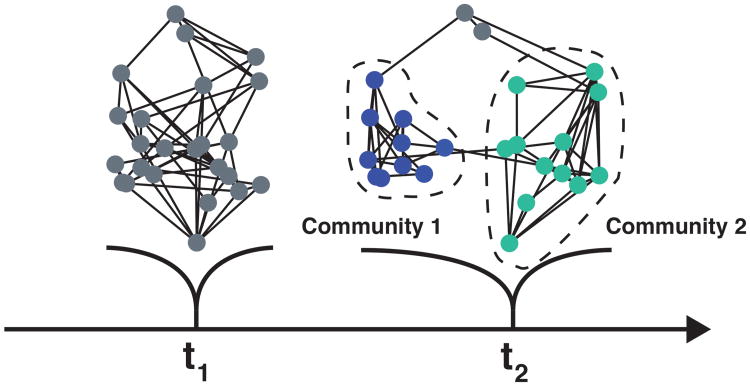
Thus far, the discussion has made the simplifying assumption that networks are stable units across time – their nodes remain fixed. More generally, networks are suggested to be dynamic coalitions of brain regions that form and dissolve to meet specific computational needs. Accordingly, network descriptions need to specify how groupings of regions evolve temporally (Figure 7). Of course, this poses several challenges, as the very notion of a network as a coherent unit is undermined. For instance, at what point does a coalition of regions become something other than, say, the salience network? An approach to modeling networks in general that partly mitigates this problem is to conceptualize networks as inherently overlapping. Instead of treating nodes as belonging to a single network, in overlapping networks, each node is a member of every network with a specific probability-like membership value, which can fluctuate across time (Figure 8).
Figure 7.
Dynamic community formation. At t1 network configuration is poorly segregated. At t2, the nodes can be clustered into two relatively independent clusters (communities 1 and 2). At t2, nodes depicted in gray could be deemed part of a third community, or separate “linkage” nodes.
Figure 8.
Overlapping networks and temporal dynamics. (A) Overlapping networks are interdigitated, such that brain regions belong to multiple communities (inset: community overlap indicated by intersection colors). (B) Nodes (brain region) can be viewed as having a membership value (from 0 to 1) to each network. Importantly, membership values evolve temporally, as the overall network reorganizes across time.
Conclusions
In practice, research on the emotional brain has often focused on a few structures thought to be central to this type of processing – hypothalamus, amygdala, insula, and so on. However, conceptual thinking about emotion has viewed this mental faculty as linked to broader brain circuits, too. This is the case of even the early investigators of the function of the hypothalamus, including the original studies by Karplus and Kreidl (from 1909 to 1928), and the subsequent studies by Cannon and Bard (starting in the 1920s). These investigators, although emphasizing the role of the hypothalamus during emotional expression (that is, overt behaviors linked to defensive and attack responses), at the same time favored the view that the cerebral cortex was necessary for conscious aspects of emotion, as well as emotional feelings.
Today, many researchers are embracing a more distributed view of emotion circuits, and efforts have started to unravel the impact of emotional manipulations on the processing of several large-scale brain networks that are chiefly important for mental operations traditionally labeled with terms such as “perception,” “action,” and “cognition.” With these efforts comes the realization that networks must be viewed as dynamic processes whose evolution is closely tied to the underlying mechanisms supporting behavior. We hypothesize that emotion-laden stimuli are not only important events that reorganize relatively stable networks, but they also trigger important regroupings of brain regions insofar as they are important for network formation and dissolution. Thus, both network formation (the initial aggregation of brain regions into a temporary cohesive unit) and organization (the properties that characterize the network) are dynamic events.
In this broader view, networks are not static and fixed collections of brain regions. Instead, network organization unfolds temporally, and specific brain regions affiliate with them in a time-varying fashion. Thus, at a specific moment, brain regions participate more strongly in some networks than others; as time progresses they may join other processes/networks. In this dynamic view of brain function, emotion has broad, distributed effects on processing in a manner that transcends traditional boundaries and inflexible labels, such as “emotion” and “cognition.” What matters is the coordinated neural action that supports behaviors. Boundaries may be convenient ways of describing what researchers have observed – they are not real entities in the brain.
Acknowledgments
The research of the authors is supported by the National Institute of Mental Health (MH071589). We thank Christian Meyer for assistance with manuscript preparation and Mahshid Najafi for providing Figure 2.
References
- Alvarez RP, Chen G, Bodurka J, Kaplan R, Grillon C. Phasic and sustained fear in humans elicits distinct patterns of brain activity. NeuroImage. 2011;55(1):389–400. doi: 10.1016/j.neuroimage.2010.11.057. [DOI] [PMC free article] [PubMed] [Google Scholar]
- Averbeck BB, Seo M. The statistical neuroanatomy of frontal networks in the macaque. PLoS Comput Biol. 2008;4(4) doi: 10.1371/journal.pcbi.1000050. [DOI] [PMC free article] [PubMed] [Google Scholar]
- Barbas H. Anatomic basis of cognitive-emotional interactions in the primate prefrontal cortex. Neurosci Biobehav R. 1995;19(3):449–510. doi: 10.1016/0149-7634(94)00053-4. [DOI] [PubMed] [Google Scholar]
- Braun U, Schäfera A, Walterb H, Erkb S, Romanczuk-Seiferthb N, Haddada L, et al. Dynamic reconfiguration of frontal brain networks during executive cognition in humans. Proc Natl Acad Sci U S A. 2015;112(37):11678–11683. doi: 10.1073/pnas.1422487112. [DOI] [PMC free article] [PubMed] [Google Scholar]
- Choi JM, Padmala S, Pessoa L. Impact of state anxiety on the interaction between threat monitoring and cognition. NeuroImage. 2012;59(2):1912–23. doi: 10.1016/j.neuroimage.2011.08.102. [DOI] [PMC free article] [PubMed] [Google Scholar]
- Craig AD. How do you feel--now? The anterior insula and human awareness. Nat Rev Neurosci. 2009;10(1):59–70. doi: 10.1038/nrn2555. [DOI] [PubMed] [Google Scholar]
- Damaraju E, Huang YM, Barrett LF, Pessoa L. Affective learning enhances activity and functional connectivity in early visual cortex. Neuropsychologia. 2009;47(12):2480–7. doi: 10.1016/j.neuropsychologia.2009.04.023. [DOI] [PMC free article] [PubMed] [Google Scholar]
- Finger S. Origins of neuroscience: a history of explorations into brain function. New York: Oxford University Press; 1994. [Google Scholar]
- Hermans EJ, Henckens MJ, Joëls M, Fernández G. Dynamic adaptation of large-scale brain networks in response to acute stressors. Trends Neurosci. 2014;37(6):304–314. doi: 10.1016/j.tins.2014.03.006. [DOI] [PubMed] [Google Scholar]
- Hermans EJ, van Marle HJ, Ossewaarde L, Henckens MJ, Qin S, van Kesteren MT, et al. Stress-related noradrenergic activity prompts large-scale neural network reconfiguration. Science. 2011;334(6059):1151–3. doi: 10.1126/science.1209603. [DOI] [PubMed] [Google Scholar]
- Kinnison J, Padmala S, Choi JM, Pessoa L. Network analysis reveals increased integration during emotional and motivational processing. J Neurosci. 2012;32(24):8361–72. doi: 10.1523/JNEUROSCI.0821-12.2012. [DOI] [PMC free article] [PubMed] [Google Scholar]
- Kolar M, Song L, Ahmed A, Xing EP. Estimating time-varying networks. Ann Appl Stat. 2010:94–123. [Google Scholar]
- Lindquist KA, Barrett LF. A functional architecture of the human brain: emerging insights from the science of emotion. Trends Cogn Sci. 2012;16(11):533–540. doi: 10.1016/j.tics.2012.09.005. [DOI] [PMC free article] [PubMed] [Google Scholar]
- MacLean PD. Psychosomatic disease and the ‘visceral brain’: recent developments bearing on the Papez theory of emotion. Psychosom Med. 1949;11:338–353. doi: 10.1097/00006842-194911000-00003. [DOI] [PubMed] [Google Scholar]
- Markov NT, Ercsey-Ravasz M, Van Essen DC, Knoblauch K, Toroczkai Z, Kennedy H. Cortical high-density counterstream architectures. Science. 2013;342(6158):1238406. doi: 10.1126/science.1238406. [DOI] [PMC free article] [PubMed] [Google Scholar]
- McMenamin BW, Langeslag SJ, Sirbu M, Padmala S, Pessoa L. Network Organization Unfolds over Time during Periods of Anxious Anticipation. J Neurosci. 2014;34(34):11261–11273. doi: 10.1523/JNEUROSCI.1579-14.2014. [DOI] [PMC free article] [PubMed] [Google Scholar]
- Menon V, Uddin LQ. Saliency, switching, attention and control: a network model of insula function. Brain Struct Funct. 2010;214(5-6):655–667. doi: 10.1007/s00429-010-0262-0. [DOI] [PMC free article] [PubMed] [Google Scholar]
- Mobbs D, Yu R, Rowe JB, Eich H, FeldmanHall O, Dalgleish T. Neural activity associated with monitoring the oscillating threat value of a tarantula. Proc Natl Acad Sci U S A. 2010;107(47):20582–6. doi: 10.1073/pnas.1009076107. [DOI] [PMC free article] [PubMed] [Google Scholar]
- Modha DS, Singh R. Network architecture of the long-distance pathways in the macaque brain. Proc Natl Acad Sci U S A. 2010;107(30):13485–90. doi: 10.1073/pnas.1008054107. [DOI] [PMC free article] [PubMed] [Google Scholar]
- Morgane PJ. Hypothalamic Organization and Function. Handbook of the Hypothalamus. 1979;1:1–64. [Google Scholar]
- Newman M. Networks: An Introduction. New York City: Oxford University Press; 2010. [Google Scholar]
- Padmala S, Pessoa L. Reward Reduces Conflict by Enhancing Attentional Control and Biasing Visual Cortical Processing. J Cogn Neurosci. 2011;23(11):3419–32. doi: 10.1162/jocn_a_00011. [DOI] [PMC free article] [PubMed] [Google Scholar]
- Papez JW. A proposed mechanism of emotion. Arch Neuro Psychiatr. 1937;38:725–743. [Google Scholar]
- Pessoa L. On the relationship between emotion and cognition. Nat Rev Neurosci. 2008;9(2):148–58. doi: 10.1038/nrn2317. [DOI] [PubMed] [Google Scholar]
- Pessoa L. How do emotion and motivation direct executive control? Trend Cogn Sci. 2009;13(4):160–166. doi: 10.1016/j.tics.2009.01.006. [DOI] [PMC free article] [PubMed] [Google Scholar]
- Pessoa L. The Cognitive-Emotional Brain: From Interactions to Integration. Cambridge: MIT Press; 2013. [Google Scholar]
- Pessoa L, Adolphs R. Emotion processing and the amygdala: from a ‘low road’ to ‘many roads’ of evaluating biological significance. Nat Rev Neurosci. 2010;11(11):773–83. doi: 10.1038/nrn2920. [DOI] [PMC free article] [PubMed] [Google Scholar]
- Pessoa L, McKenna M, Gutierrez E, Ungerleider LG. Neural processing of emotional faces requires attention. Proc Natl Acad Sci U S A. 2002;99(17):11458–11463. doi: 10.1073/pnas.172403899. [DOI] [PMC free article] [PubMed] [Google Scholar]
- Rubinov M, Sporns O. Complex network measures of brain connectivity: uses and interpretations. NeuroImage. 2010;52(3):1059–69. doi: 10.1016/j.neuroimage.2009.10.003. [DOI] [PubMed] [Google Scholar]
- Shi C, Davis M. Pain pathways involved in fear conditioning measured with fear-potentiated startle: lesion studies. J Neurosci. 1999;19(1):420–430. doi: 10.1523/JNEUROSCI.19-01-00420.1999. [DOI] [PMC free article] [PubMed] [Google Scholar]
- Somerville LH, Whalen PJ, Kelley WM. Human bed nucleus of the stria terminalis indexes hypervigilant threat monitoring. Biol Psychiatry. 2010;68(5):416–24. doi: 10.1016/j.biopsych.2010.04.002. [DOI] [PMC free article] [PubMed] [Google Scholar]
- Swanson LW. Cerebral hemisphere regulation of motivated behavior. Brain Res. 2000;886(1-2):113–164. doi: 10.1016/s0006-8993(00)02905-x. [DOI] [PubMed] [Google Scholar]
- Thomason ME, Hamilton JP, Gotlib IH. Stress-induced activation of the HPA axis predicts connectivity between subgenual cingulate and salience network during rest in adolescents. J Child Psychol Psychiatry. 2011;52(10):1026–34. doi: 10.1111/j.1469-7610.2011.02422.x. [DOI] [PMC free article] [PubMed] [Google Scholar]
- Tye KM, Prakash R, Kim SY, Fenno LE, Grosenick L, Zarabi H, et al. Amygdala circuitry mediating reversible and bidirectional control of anxiety. Nature. 2011;471(7338):358–362. doi: 10.1038/nature09820. [DOI] [PMC free article] [PubMed] [Google Scholar]
- Tyszka JM, Kennedy DP, Adolphs R, Paul LK. Intact bilateral resting-state networks in the absence of the corpus callosum. J Neurosci. 2011;31(42):15154–62. doi: 10.1523/JNEUROSCI.1453-11.2011. [DOI] [PMC free article] [PubMed] [Google Scholar]
- Walker DL, Toufexis DJ, Davis M. Role of the bed nucleus of the stria terminalis versus the amygdala in fear, stress, and anxiety. Eur J Pharmacol. 2003;463(1-3):199–216. doi: 10.1016/s0014-2999(03)01282-2. [DOI] [PubMed] [Google Scholar]
- Weiskrantz L. Behavioral changes associated with ablation of the amygdaloid complex in monkeys. J Comp Physiol Psychol. 1956;49(4):381–91. doi: 10.1037/h0088009. [DOI] [PubMed] [Google Scholar]
- Yeo BT, Krienen FM, Sepulcre J, Sabuncu MR, Lashkari D, Hollinshead M, et al. The organization of the human cerebral cortex estimated by intrinsic functional connectivity. J Neurophysiol. 2011;106(3):1125–65. doi: 10.1152/jn.00338.2011. [DOI] [PMC free article] [PubMed] [Google Scholar]
- Young MP, Scannell JW, Burns GAPC, Blakemore C. Analysis of connectivity: Neural systems in the cerebral cortex. Rev Neurosci. 1994;5:227–249. doi: 10.1515/revneuro.1994.5.3.227. [DOI] [PubMed] [Google Scholar]


