

Abstract
Plant 3R-MYB transcription factors are an important subgroup of the MYB super family in plants; however, their evolutionary history and functions remain poorly understood. We identified 225 3R-MYB proteins from 65 plant species, including algae and all major lineages of land plants. Two segmental duplication events preceding the common ancestor of angiosperms have given rise to three subgroups of the 3R-MYB proteins. Five conserved introns in the domain region of the 3R-MYB genes were identified, which arose through a step-wise pattern of intron gain during plant evolution. Alternative splicing (AS) analysis of selected species revealed that transcripts from more than 60% of 3R-MYB genes undergo AS. AS could regulate transcriptional activity for some of the plant 3R-MYBs by generating different regulatory motifs. The 3R-MYB genes of all subgroups appear to be enriched for Mitosis-Specific Activator element core sequences within their upstream promoter region, which suggests a functional involvement in cell cycle. Notably, expression of 3R-MYB genes from different species exhibits differential regulation under various abiotic stresses. These data suggest that the plant 3R-MYBs function in both cell cycle regulation and abiotic stress response, which may contribute to the adaptation of plants to a sessile lifestyle.
Keywords: 3R-MYB, gene family evolution, alternative splicing, intron evolution, cell cycle, abiotic stresses
Introduction
The MYB gene family is broadly distributed in eukaryotes (Lipsick 1996), with many homologs in plants (Dubos et al. 2010; Feller et al. 2011; Du et al. 2013). MYB proteins are defined by the presence of one or more MYB domains, typically denoted “R” (for repeat), which occur in the DNA-binding domain of MYB transcription factors (Lipsick 1996; Martin and Paz-Ares 1997; Rosinski and Atchley 1998). Each R repeat comprises ∼52 amino acids that contain three regularly spaced conserved hydrophobic residues (usually tryptophans) that are essential in forming the hydrophobic pocket (Ogata et al. 1992). MYB domains fold into three alpha helices, with the second and third helix forming a helix-turn-helix (HTH) structure (Ogata et al. 1992). MYB proteins are classified into four major types (1R-MYB/MYB-related, R2R3-MYB, 3R-MYB and 4R-MYB) based on their number of repeats (Dubos et al. 2010), although this classification is not necessarily consistent with the MYB phylogeny. There are three genes in most vertebrates and fewer than ten genes in angiosperms that encode 3R-MYB proteins (Feller et al. 2011), which include the product of the prototypical c-myb gene (the cellular homolog of v-myb; Klempnauer et al. 1982). However, the animal and plant 3R-MYB gene families appear to be separate clades, and the plant 3R-MYB genes likely gave rise to the diverse (∼100–200 genes per species) R2R3-MYB gene families of plants (Braun and Grotewold 1999; Dias et al. 2003). Thus, understanding the evolution of the 3R-MYB genes in plants is critical for understanding the evolution of the plant MYB gene family in general.
The primary function of many different MYB proteins appears to be recognition of specific DNA sequence motifs (Ording et al. 1994), although MYB domains also play a role in protein–protein interactions (Grotewold et al. 2000). Plant 3R-MYB proteins recognize Mitosis-Specific Activator (MSA) elements (Ito et al. 1998; Ma et al. 2009), and play a conserved role in cell cycle regulation. The 3R-MYB proteins in plants regulate the G2/M transition (Ito et al. 2001), whereas the animal proteins regulate the G1/S transition (Bergoltz et al. 2001). The DNA element (MSA) that plant 3R-MYBs recognize exists in the upstream promoter region of G2/M-phase specific genes, such as B-type cyclin genes, and it is both necessary and sufficient for driving G2/M-phase specific gene expression (Ito et al. 2001; Haga et al. 2007; Kato et al. 2009).
Plant 3R-MYBs often are divided into three groups (the A-, B- and C-group; Ito et al. 2001; Ito 2005). The tobacco NtMybA1 and NtMybA2 genes (A-group) have variable expression patterns during cell cycle, with a peak of expression at M-phase, and their products bind to the MSA element directly and activate B-type cyclin gene expression (Ito et al. 2001; Kato et al. 2009). The Arabidopsis orthologs (Myb3R1 and Myb3R4) of those tobacco genes bind to the MSA elements of B2-type cyclin, CDC20.1 and KNOLLE, and up-regulate their expression (Haga et al. 2007). Consistent with their putative role in the cell cycle, double mutants in these A-group genes exhibit incomplete cytokinesis, multinucleate cells, and defective cell walls in Arabidopsis (Haga et al. 2011). In contrast, tobacco NtMybB (B-group) is constantly expressed during the cell cycle, and it functions as a repressor (Ito et al. 2001). Finally, one of the C-group genes (OsMYB3R-2 in rice) is involved in both cell cycle and abiotic stresses (Dai et al. 2007; Ma et al. 2009). The OsMYB3R-2 is induced by stresses, such as freezing, drought, and salt; and, overexpression of it under stress conditions increases stress tolerance and maintains a high level of cell division (Dai et al. 2007). The pleiotropic effects of OsMYB3R-2 suggest it is possible involvement in the B-type cyclin pathway and the dehydration responsive element-binding factor/C-repeat-binding factor (DREB/CBF) pathway (Ma et al. 2009). It is unclear whether A- and B-group 3R-MYB proteins are also involved in abiotic stresses. Plants have sessile life styles and coping with abiotic stresses is a challenge for their survival. Placing these functions of 3R-MYB transcription factors in an evolutionary framework is important for understanding the ways that plants couple cell cycle and abiotic stress responses.
The genetic basis for functional divergence among the A-, B-, and C-groups of 3R-MYB proteins is also unclear. The carboxyl-terminal (C-terminal) regions of MYB proteins are highly divergent, and there is substantial length variation among the A-, B-, and C-groups (Ito et al. 2001). There is a negative regulatory domain located in C-terminal region that represses transactivation activity of NtMybA2 (A-group); specific cyclin/CDK complex(es) could phosphorylate specific sites in NtMybA2 protein and remove the inhibitory effects (Araki et al. 2004). Overexpression of the truncated protein without the negative regulation domain up-regulates many G2/M specific genes compared with overexpression of the full-length protein in tobacco (Kato et al. 2009). In addition to these C-terminal regions, there can be divergence within the MYB repeats themselves. If any such divergent sites exist, they might exhibit shifts in their evolutionary rate (Gaucher et al. 2002) that would render them detectable.
Alternative splicing (AS) is a process that results in multiple discrete mRNA products from a single gene. This is a post-transcriptional modification of mRNA that may offer a quick response to stimuli in eukaryotes. More than 95% of animal multi-exon genes (Pan et al. 2008) and >60% of plant multi-exon genes (Marquez et al. 2012) undergo AS. However, the extent and regulation of AS in the plant 3R-MYBs is largely unknown. Moreover, the evolutionary forces that shape current intron/exon gene structures (e.g., intron gain or intron loss) are unknown.
In this study, we explore the patterns of molecular evolution in the plant 3R-MYB transcription factor gene family and examine its motif and domain organization, gene structure, AS, and expression patterns under abiotic stresses. Specifically, we address the phylogenetic relationships among plant 3R-MYBs, seek to identify candidate sites and motifs in the 3R-MYB proteins that contribute to their functional divergence, determine the pattern of intron and AS evolution within the plant 3R-MYBs, and look for evidence that the A-, B- or C-group 3R-MYBs are involved in abiotic stress responses. Answering these questions will enhance our understanding of the evolution and function of the 3R-MYBs in plants and help illuminate the evolution and functional divergence of gene families encoding plant transcription factors.
Materials and Methods
Identification of the 3R-MYB Proteins
We used HMMER v3.1b2 (Eddy 2011) to conduct profile hidden Markov model (HMM) searches using the Pfam MYB DNA-binding-domain (PF00249) as a query to search annotated proteins from 65 plant species (supplementary table S1, Supplementary Material online). For gene loci with multiple isoforms predicted, the primary isoform was used if primary isoform annotation is available; otherwise the longest protein was used. We considered sequences with three MYB domains identified by HMMER with an E-value of ≤ 1.0E-15 to be candidate 3R-MYB proteins. Those candidate 3R-MYB proteins from the HMMER search were then examined to confirm that three R repeats are adjacent to one another using the SMART (Letunic et al. 2015), CDD (Marchler-Bauer et al. 2015), and Pfam (Finn et al. 2014) databases. Proteins with nonadjacent R repeats or proteins containing other domains besides MYB domains were removed.
Multiple Sequence Alignments and Phylogenetic Analysis
We generated an amino acid multiple sequence alignment for 3R-MYB using Muscle v3.8.31 with default parameters (Edgar 2004) followed by manual improvements (supplementary data S1, Supplementary Material online), and used these as input to generate a maximum likelihood (ML) phylogenetic tree based on the entire protein lengths with RAxML v8.1.12 (Stamatakis 2014) using the LG4X model (Le et al. 2012). Eight tree searches were performed to identify the ML tree. Then we attempted to improve the ML gene tree topologies using TreeFix (Wu et al. 2013), which takes the ML gene tree topology, the sequence alignment, and a species tree topology (fig. 1) and tries to find an alternate gene tree topology that implies fewer duplications and losses than the original ML topology while not significantly increasing the likelihood. About 500 nonparametric bootstrap replicates were run for the data set with ML under the LG4X model using RAxML (v8.1.12) (Stamatakis 2014) and MEGA6 Beta2 software (Tamura et al. 2013) was used to generate the tree figures.
Fig. 1.—

Species phylogeny and numbers of 3R-MYB genes in each species. The species tree in the study was inferred from Ruhfel et al. (2014), Zeng et al. (2014), Vanneste et al. (2014), and Huang et al. (2016). The divergence time was estimated by molecular clock dating from TimeTree (Hedges et al. 2015). Stars on the branches indicate WGD events; the five WGD events Arabidopsis thaliana went through were α, β, γ, ɛ and ζ. In the species tree dark green, yellow, purple, blue, green, and red indicate algae, moss, gymnosperms, Amborella trichopoda, monocots, and eudicots respectively. Following the species names are the number of 3R-MYBs identified in each group as well as in total. Ma, million years ago.
Domain and Motif Identification
We identified group-specific evolutionary rate shifts in the MYB domain region using a method described by Gaucher et al. (2001). Briefly, we estimated the amino acid substitution rates of each site in the alignments of the MYB-domains of six groups: 1) A-group; 2) B-group; 3) C-group; 4) A- and B-groups; 5) B- and C-groups; and 6) A- and C-groups with PAML (version 4.8a) (Yang 2007) using the LG model (Le and Gascuel 2008) with Γ-distributed rate variation among sites. We conducted three comparisons: 1) A-group versus B- and C-groups; 2) B-group versus A- and C-groups; and 3) C-group versus A- and B-groups. The expected evolutionary rate difference for any comparison of two groups is zero; large positive or negative values indicate shifts in rates. Sites with amino acid substitution rate differences >2.57 SD from the mean were chosen as significantly conserved or dynamic sites.
The branch-site model in PAML v. 4.8a (Yang 2007) was used to examine the MYB domain of A-, B- or C-groups for positive selection following their divergence and, if present, to determine the sites of positive selection. In these tests, we compared the alternative model (branch-site model A) with its corresponding null model (model A with ω2=1 fixed). Additionally, we tested for positive selection in monocots within A- and C-groups using the same method to detect whether monocot A- and C-groups have picked up B-group gene function and thus have accelerated evolutionary rates. In the positive selection tests, the nucleotide alignments of the DNA-binding-domain region were generated from back translation from the amino acid alignments with in-house perl scripts.
Motifs in the carboxyl-terminus were identified using MEME (Multiple EM for Motif Elicitation) v. 4.10.2 (Bailey et al. 2006). Sequence logos of the C-terminal motifs were generated with Weblogo Berkeley (http://weblogo.berkeley.edu/logo.cgi; last accessed March 31, 2017).
Synonymous Divergence among Paralogs
PAML v. 4.8a (Yang 2007) was used on the nucleotide alignments described in the positive selection test (above) to calculate pairwise synonymous distances (dS, synonymous substitutions per synonymous site) with one ratio model (M0) (Goldman and Yang 1994) for nucleotide alignments of the MYB-domains of paralogous genes from each of 40 different angiosperm species (supplementary table S1, Supplementary Material online). Pairwise dS values were placed into six subsets depending on the group membership of the genes being compared (A versus A, B versus B, C versus C, A versus B, B versus C, and A versus C). Normal distributions were fit to the dS distributions of the six groups.
Syntenic Block Identification
In order to investigate whether the origin of the three 3R-MYB genes in Amborella were due to single gene duplication or segmental duplication events, we analyzed the synteny blocks in Amborella trichopoda and Ostreococcus lucimarinus. Syntenic blocks in Ostreococcus lucimarinus and Amborella trichopoda were identified with DAGchainer (Haas et al. 2004). Ostreococcus and Amborella proteins were aligned to each another by the all-to-all BLASTp (version 2.2.28) method (Altschul et al. 1990). The combined file of genome annotation (gff3) and BLASTp results were supplied to DAGchainer with default parameters. Syntenic blocks that contain the algal and Amborella 3R-MYB proteins were plotted in R (R Development Core Team 2014).
Identification of Intron Positions and AS Analysis
We extracted gene structure information from gff3 annotation files for 42 species (indicated in supplementary table S1, Supplementary Material online). The evolutionary history of introns in the DNA-binding-domain was reconstructed using maximum parsimony with the phylogenetic trees constructed in this study (fig. 2a and supplementary fig. S1, Supplementary Material online). We also examined the 3R-MYB genes from six species for evidence of AS. Arabidopsis thaliana, Populus trichocarpa, Vitis vinifera, Oryza sativa, and Amborella trichopoda AS data was acquired from Chamala et al. (2015), while AS in Sorghum bicolor was identified using the available reference genome sequence and annotation (Paterson et al. 2009) and publicly available sorghum RNA-Seq data (GSE30249 and GSE50464 from Gene Expression Omnibus) (Dugas et al. 2011; Olson et al. 2014) using the methodology described in Chamala et al. (2015). Among the 25 3R-MYB genes identified within these species, 16 genes have evidence of alternatively spliced transcripts. The gene structure of the 16 3R-MYB genes were displayed with Gene Structure Display Server 2.0 (http://gsds.cbi.pku.edu.cn; last accessed March 31, 2017) (Hu et al. 2015), and the AS patterns were added with manual editing.
Fig. 2.—

Subgroup classification of the plant 3R-MYBs. (A) ML tree of the whole length plant 3R-MYB proteins. In the ML tree, dark green, yellow, purple, blue, green, and red indicate proteins from algae, moss, gymnosperms, Amborella trichopoda, monocots, and eudicots respectively. (B) Domain and motif structures of the plant 3R-MYBs in each group. Boxes on the right show the protein structure of the 3R-MYB in each group. N, amino-terminus; C, carboxyl-terminus. (C) Sequence logos of the four motifs identified in (B). Orange stars below amino acids indicate highly conserved amino acid sites. Blue box indicates the lost fragment in motif 4 in grasses.
Analysis of Motifs in Promoter Regions
We examined sequences from the start codon to a point 2,000 base pairs upstream for 160 3R-MYB genes from 41 species (indicated in supplementary table S1, Supplementary Material online). These putative promoter regions were searched on both strands for exact matches to the sequence 5′-AACGG-3′, which is the core consensus sequence of the MSA element (T/C)C(T/C)AACGG(T/C)(T/C)A. We compared the number of exact matches to 5′-AACGG-3′ in 3R-MYB gene promoters to 400 randomly sampled genes. We conducted a one-way analysis of variance (ANOVA) and Tukey’s HSD (Honestly Significant Difference) test in R (R Development Core Team 2014) to examine the hypothesis that 3R-MYB genes have more potential MSA elements than randomly chosen genes. The number of potential MSA elements for each gene was transformed by square root to normalize residuals and equalize variances before statistical tests.
Gene Expression Analysis
We examined 3R-MYB gene expression under various abiotic stresses (heat, cold, drought and salt) with microarry data available from the AtGenExpress (Arabidopsis thaliana genome transcript expression study) project (Kilian et al. 2007) for Arabidopsis; and the Plant Expression Database (PLEXdb) (Dash et al. 2012) for barley, rice, wheat, maize, grape, soybean, Medicago, poplar, and cotton. For data with multiple time points, we performed a one-way ANOVA test to determine the statistical significance of expression changes. For data with control and stress conditions, we performed a two-sample t-test to identify significant expression changes.
Results
Global Identification of 3R-MYB Proteins from 65 Plant Species
We identified 225 3R-MYB genes from 65 plant species using profile HMM searches (see Materials and Methods; fig. 1). There was a single 3R-MYB gene in each of the algal outgroups, whereas the moss (Physcomitrella patens) has two 3R-MYB genes, possibly resulting from a genome duplication in that lineage (Rensing et al. 2007). Both gymnosperm species that were analyzed have two 3R-MYB genes. Amborella has three 3R-MYB genes that fall into the A-, B- and C-group, respectively, indicating gene duplications preceding the origin of angiosperms. All other angiosperm 3R-MYB genes also fall into the A-, B- and C-groups; the number of 3R-MYB genes found in angiosperm genomes ranges from one (e.g., Citrus sinensis) to nine (e.g., Triticum aestivum). The absence of gene members from a certain group of 3R-MYB in a given species might represent bona fide gene loss but it could also result from an incomplete or locally misassembled genome, improper annotation, or failure to meet our screening criteria. However, the absence of B-group 3R-MYBs in many monocots [with the exception of duckweed (Spirodela polyrhiza), banana (Musa acuminate), and wild banana (Musa balbisiana)] suggests the loss of B-group 3R-MYBs during monocot evolution. Based on the distribution of B-group 3R-MYB genes in monocots, there were probably two independent losses: one in the grasses and one in orchid and palms. In addition, orchid and palms probably also lost A-group 3R-MYBs.
Phylogenetic Analysis of the Plant 3R-MYB Proteins
The 3R-MYB proteins were clearly divided among three groups (the previously defined A-, B- and C-groups) (fig. 2a). The A-, B- and C-group proteins were present only in angiosperm species, the single Amborella 3R-MYB gene in each group was sister to all other species. Within A- and C-groups, genes from monocots formed one branch while genes from eudicots formed another branch (fig. 2a and supplementary fig. S1, Supplementary Material online). This indicates no gene duplication event before the divergence of monocots and eudicots and the expansion of 3R-MYBs in angiosperms are mainly due to lineage specific duplication events during the evolution of monocots and eudicots.
Synteny
A total of 1,911 synteny blocks were identified between algae (Ostreococcus lucimarinus) and Amborella, with an average of 9.5 (SD = 2.8) genes per synteny block. Examination of these blocks indicates that the region of Ostreococcus lucimarinus chr9 surrounding a 3R-MYB gene is present in triplicate in Amborella—with each block in the Amborella genome containing one of the three 3R-MYBs (supplementary fig. S2, Supplementary Material online). This suggests that the origin of the three 3R-MYB genes in Amborella resulted from segmental duplications rather than tandem duplications of single gene.
Synonymous Divergence Analysis of the Three Group 3R-MYBs in Angiosperms
We analyzed the pairwise dS values of paralogous 3R-MYB genes within the same species of angiosperms (fig. 3a and b). Inter-group comparisons (A–B, B–C, A–C) were used to estimate the timing of gene duplication events leading to the divergence of the three groups. The peaks of dS distribution of the three inter-group comparisons are at 1.9, 2.2, and 2.4 for B–C, A–C, and A–B respectively. This suggests that the A-group diverged before the divergence of B- and C-groups, in agreement with the phylogenetic tree (fig. 2a and supplementary fig. S1, Supplementary Material online). Intra-group comparisons (A–A, B–B, C–C) were used to estimate the timing of gene duplication events after the divergence of A-, B- and C-group. We observed the peak of dS distribution of A–A, B–B, C–C to be at 0.7, 0.9, and 0.5, respectively.
Fig. 3.—

Tests for origin of the three groups of the plant 3R-MYB genes. (A) Distribution of the pairwise synonymous distances (dS) for paralogous 3R-MYBs in each angiosperm species. The pairwise dS value distribution of A–A, B–B, C–C, A–B, A–C and B–C are shown as histograms with a normal distribution fitted. (B) Normal distributions fit to pairwise dS values for the six groups.
The Evolutionary History of the Plant 3R-MYBs Motifs
Four conserved motifs were identified in the C-terminal region of plant 3R-MYBs (fig. 2b and c). Motif 2 arose early in land plant evolution and was conserved across moss, gymnosperm, and angiosperm proteins. The other three motifs appear to have been present within the common ancestor of seed plants (gymnosperms and angiosperms). Different motifs then appear to have been lost in each group. Specifically, motif 3 was lost from the A-group proteins, motifs 1 and 4 were lost from the common ancestor of B- and C-group proteins, and motif 3 was independently lost from C-group proteins (fig. 2b). We also observed a 12–14 amino acids deletion in motif 4 within the grasses (fig. 2c and supplementary fig. S3, Supplementary Material online). It is unclear whether the lost fragment in motif 4 affects 3R-MYB function in grasses.
Several amino acid sites in the MYB DNA-binding-domain appear to have undergone rate shifts (fig. 4). Most of the candidate rate-shift sites are located in the first helix of each R repeat, so they are unlikely to directly impact the DNA-binding activity since the second and third helix form a HTH structure responsible for DNA binding (Ogata et al. 1992). Our rate shift analyses are consistent with the results of functional characterization of the three MYB repeats in animal c-MYB (Ogata et al. 1992; Ording et al. 1994). Specifically, there are the fewest (3) rate divergent sites in R3, which plays the dominant role in DNA-binding, whereas R1 and R2 have more (6 and 7, respectively). Site 85 in R2, showing divergence among A-, B- and C-groups, is the only site located within the HTH structure.
Fig. 4.—

Analysis of DNA binding domain of the plant 3R-MYBs proteins. (A) Alignments of DNA binding domain of representative plant 3R-MYB proteins. Protein groups (A-, B-, or C-) are indicated before of gene names and species are indicated inside brackets. The five conserved introns in the DNA-binding domain are indicated using black arrows, black lines, uppercase bold letters A, B, C, D and E; the other intron is indicated using gray arrow, gray line and lowercase letters b. The numbers in parentheses after the letter indicate intron position, with “0” indicates the introns between the two codons of the indicated two amino acids; “1” indicates the introns between the first and second nucleotide of the codon of the indicated amino acid; “2” indicates the introns between the second and third nucleotide of the codon of the indicated amino acid. Thick black lines at the bottom indicate the three helices in each R repeat (Ogata et al. 1992, 1994) and blue asterisks indicate the conserved tryptophans. (B) Distribution of the amino acid substitution rate differences comparing each group with the other two groups. Dashed lines indicate our threshold (2.57 SD) for the identification of rate shift sites. (C) The site in each group that has an unusually low (Slow in the Group) or high (Fast in the Group) amino acid substitution rate compared relative to the other two groups. (D) Amino acid alignment logos of the DNA-binding-domain of A-, B- and C-group 3R-MYBs with the slow (green) and fast (orange) sites highlighted. Blue boxes above the sequence logos indicate helices, blue lines between them indicate turns, and blue asterisks indicate the conserved tryptophans.
In order to test whether any of the three groups experienced accelerated evolutionary rates after divergence, we tested positive selection of A-, B- and C-groups using a branch-site model (see Materials and Methods). However, none of these three tests support the hypothesis of positive selection (supplementary table S2, Supplementary Material online). Moreover, positive selection in monocots within the A- and C-groups was also not detected (supplementary table S2, Supplementary Material online).
Gene Structure Evolution
We identified six introns in the DNA-binding-domain region from 160 3R-MYB genes (fig. 4a). Five introns (A, B, C, D and E) are conserved among multiple species, while the other intron (b) was found only in one sequence. The distribution of the five conserved introns reveals their evolutionary history (fig. 5). Introns A and B were present in the common ancestor of all land plants and green algae; indeed, intron A is broadly distributed in eukaryotes (Braun and Grotewold 1999). Two additional introns (D and E) were gained before the divergence of mosses and seed plants. Finally, intron C was inserted after the divergence of seed plants from mosses. The unconserved intron b is found in only one case [Gorai008G117400 (B-group) in Gossypium raimondii]. Gorai008G117400 has conserved introns A, C, D, and E, and unconserved intron b in a position close to intron B. The amino acid alignment of the corresponding region around intron b of Gorai008G117400 is different compared with other proteins. It is possible that nucleotide substitutions around intron B may have altered splicing signals; alternately, it could be a sequencing/assembly error.
Fig. 5.—

Intron evolution pattern of the DNA-binding-domain region of the plant 3R-MYBs. For each gene depicted boxes indicate exons, lines indicate introns, UTRs are not included in the gene structure. The hash lines indicate possible introns. Gray, pink and green thick bars indicate the five conserved introns, with the name of each intron on the top. The four conserved motifs are shown in corresponding position in the gene structure.
Notably, we observed four conserved exons at the 3′ end in angiosperm A-group and gymnosperm 3R-MYB genes. The middle two of the four conserved exons contain the motif 4 in angiosperm A-group and gymnosperm 3R-MYB proteins (fig. 5).
Alternative Splicing of the Plant 3R-MYBs
The proportions of 3R-MYB genes with evidence of AS in Arabidopsis, poplar, grapevine, rice, sorghum, and Amborella are 100% (5/5), 50% (2/4), 67% (4/6), 25% (1/4), 33% (1/3), and 100% (3/3), respectively. Thus, 16 of the 25 3R-MYB genes represented within the six species have evidence of undergoing AS, and these 16 genes produce a total of 30 AS events. Among the 30 AS events, 1 is exon skipping, 15 are intron retention, 7 are alternative acceptor, 1 is alternative donor, and 6 are alternative polyadenylation. About 8 of the 30 events occur within untranslated regions (UTR), while 22 events impact the coding region (fig. 6). About 8 of the 22 AS events that impact the coding region lead to premature stop codons. These transcripts may succumb to nonsense mediated decay (Chang et al. 2007) and may represent unproductive splicing that may regulate 3R-MYB protein levels (Lareau et al. 2007). Furthermore, 13 of the 22 events that impact the coding region affect the DNA binding domain. Of all the AS events identified, we observe two shared AS patterns in 3R-MYB genes among different species: Amborella Amtr00109.47, Arabidopsis At5g11510 and At3g09370 shared a conserved alternative acceptor event in their second exons; Grape GSVIVT01027493001 and Arabidopsis At4g00540 shared a conserved alternative acceptor event in their second exons (fig. 6). Moreover, we observed a shared alternative polyadenylation event between the two A-group Arabidopsis genes (At4g32730 and At5g11510).
Fig. 6.—

AS of 3R-MYB proteins in Amborella, Arabidopsis, grape, popular, rice and sorghum. The group (A-, B-, or C-) membership for each gene is indicated in brackets. Boxes indicate exons (blue for constitutively spliced; orange for alternatively spliced) and lines indicate introns. Gene structures are drawn to scale and connecting bars indicate homologous exons (green for the six exons encoding the DNA binding domain; pink for the four exons specific to the A-group; gray for all others). The two black flags in each gene indicate the start and stop codon in the primary transcript and red hexagons indicate stop codons generated by AS. The green circles at the end of the exons indicate alternative polyadenylation events.
MSA Cis-Regulatory Element Prediction (Cell Cycle Regulation)
The cis-regulatory elements necessary and sufficient to drive G2/M-phase specific gene expression (MSA) are specific targets of the trans-acting 3R-MYB proteins. Thus, MSAs provide a way to identify candidate genes that might be involved in the regulation of the G2/M transition during the cell cycle. The plant 3R-MYB genes have been shown to be self-regulated by MSA elements in their promoter (Kato et al. 2009). We used evidence of enrichment of the MSA element core sequence within regions upstream of 3R-MYB genes from plant species that have not been functionally characterized as indication of potential involvement in cell cycle. We searched for the MSA element core sequence (5′-AACGG-3′) within either of the sense or antisense strands in the region up to 2-kb upstream of the start codon of the 3R-MYB genes. There were no significant differences in the number of MSA core sequences on the sense or antisense strand (supplementary fig. S4, Supplementary Material online). The average number of MSA element core sequences in the upstream 2-kp region of each gene of the A-, B-, C-group, and the outgroup species (algae, moss, and gymnosperms) were 3.3, 3.2, 6.7 and 4.4, respectively. In contrast, the average number of MSA element core sequence in the upstream sequences for randomly selected genes was only 1.7. The numbers of MSA element core sequences in plant 3R-MYB genes are significantly higher than randomly selected genes based on ANOVA and Tukey’s HSD test (fig. 7). While this suggests the possibility that plant 3R-MYBs are widely involved in the cell-cycle, this relationship remains to be experimentally verified.
Fig. 7.—
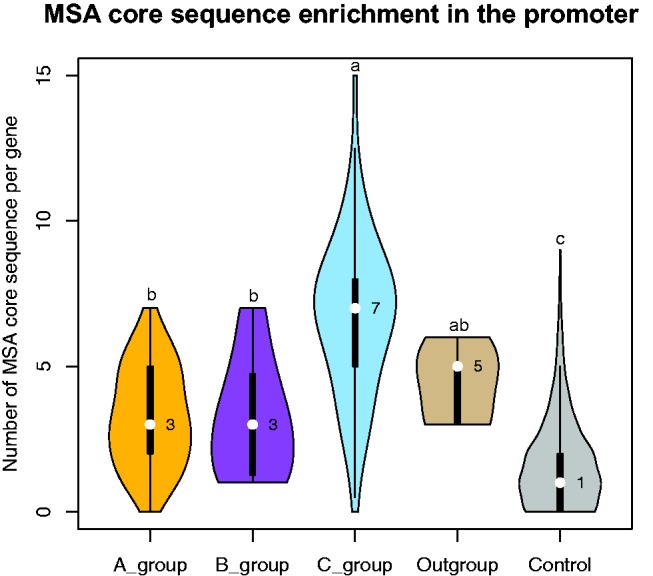
Violin plots of the number of MSA core sequences in the upstream regions for each group of genes. The median number of MSA core sequences in each group is shown by the white dot (the median is on the right side). Kernel width indicates the fitted data density under kernel distribution. a, b and c above each violin plot indicate difference significance by ANOVA and Tukey’s HSD test under 0.05 significance.
The number of MSA element core sequence in C-group genes is significantly higher than that in A- and B-groups, suggesting that the C-group may have different regulatory mechanisms.
Expression Pattern of the Plant 3R-MYBs under Abiotic Stresses
We analyzed available gene expression profiles of three Arabidopsis 3R-MYB genes, At4g32730 (A-group), At5g11510 (A-group) and At3g09370 (C-group), under various abiotic stresses. mRNA accumulation of At5g11510 under favorable growth conditions was 2-fold higher in the root than in the shoot, whereas the other two genes have similar expression levels in the root and shoot (fig. 8). The C-group gene At3g09370 was induced under two different stress conditions: 1) heat treatment (both shoot and root); 2) salt stress (only in root). At3g09370 returns to its original expression level when heat stress is released. The A-group genes At5g11510 and At4g32730 showed reduced expression under heat treatment in shoot and root tissue, although change in expression was less dramatic for At4g32730 (fig. 8). Overall, there were several cases where A- and C-group 3R-MYB genes exhibited opposite patterns of regulation. The Arabidopsis C-group gene At3g09370 shows an upregulated expression pattern similar to the rice C-group gene OsMYB3R-2 under stress conditions, implying At3g09370 also plays a role in stress response. The opposite expression patterns of the A- and C-group genes described earlier implies a possible antagonistic regulation of these two groups under abiotic stresses in Arabidopsis.
Fig. 8.—

Expression profiles of the Arabidopsis 3R-MYB genes under abiotic stresses. The expression level of three Arabidopsis genes At4g32730 (A-group), At5g11510 (A-group), At3g09370 (C-group) in root and shoot under heat (38 °C), cold (4 °C), salt (150 mM NaCl), and drought (dry air stream). In heat stress, the seedlings were returned to room temperature after a 3-h treatment (indicated by red arrow). For each gene, the expression level in root at 0 time point was normalized to 1. The expression levels of that gene under other conditions were normalized accordingly. Error bars indicate SE. Asterisk(s) indicate significant level from one-way ANOVA test (significance level: *, 0.05; **, 0.01; ***, 0.001).
We analyzed available microarray gene expression profiles of 3R-MYBs in barley, rice, wheat, maize, grape, soybean, Medicago, poplar, and cotton. Among the available gene expression profiles, five A-group genes, one B-group genes and six C-group genes showed significant expression changes in response to one or more stress treatments (fig. 9). Among the 15 instances of differential expression, six cases involved upregulated expression: A-group gene MLOC10556 (barley) in response to cold; B-group gene GSVIVT01019834001 (grape) in response to heat; and four C-group genes Glyma18G18110 (soybean) in response to heat, LOC_Os01g62410 (OsMYB3R-2) (rice), GRMZM2G081919 (maize) and Potri006G085600 (poplar) in response to drought (fig. 9). The remaining nine instances of differential expression indicated downregulation in response to abiotic stresses.
Fig. 9.—

Expression profiles of the 3R-MYB genes from nine angiosperm species under abiotic stresses. Labels in the upper left corner of each bar plot indicate microarray project accession number in PLEXdb (Dash et al. 2012). Please see detailed description of each experiment in PLEXdb (http://www.plexdb.org/index.php; last accessed March 31, 2017) under corresponding microarray project accession number. Error bars indicate SE. Asterisk(s) indicate significant level from two-sample t-test (significance level: *, 0.05; **, 0.01; ***, 0.001). a, b and c above each bar plot indicate difference significance by ANOVA and Tukey’s HSD test under 0.05 significance.
Discussion
Patterns of Duplication and Loss in Plant 3R-MYB Genes
Plant and animal 3R-MYBs share a 3R-MYB common ancestor, which is supported by the conservation of an intron in R1 (Braun and Grotewold 1999) and phylogenetic analyses (Dias et al. 2003). Interestingly, there are similarities in the evolution of 3R-MYBs in plants and animals. Most invertebrates have a single 3R-MYB gene whereas vertebrates have three (A-MYB, B-MYB, and c-MYB) (Davidson et al. 2012). All three vertebrate 3R-MYB genes are involved in cell-cycle regulation, although they have distinct expression patterns and exhibit some degree of functional differentiation, such as the ability of B-MYB to complement Drosophila MYB mutants when neither A- or c-MYB can do so (Davidson et al. 2005). The three vertebrate MYB genes have originated from two rounds of segmental duplication (Davidson et al. 2012). They may also be a result of two rounds of WGD in vertebrates (Gibson and Spring 2000), although more recent phylogenetic analyses raise questions about this hypothesis (Abbasi and Hanif 2012). Analysis of synteny between Amborella trichopoda and Ostreococcus lucimarinus suggest that the duplication events giving rise to the three members in Amborella were regional or possibly even WGD events. There are two putative WGD events, ζ and ε, shared by all angiosperm species (Jiao et al. 2011). Our phylogenetic analyses suggest that event ε along with a second segmental duplication could have produced the three angiosperm 3R-MYB groups (fig. 10a), and it is conceivable that they were formed from both ζ and ε events combined with a gene loss (fig. 10b).
Fig. 10.—

Model of plant 3R-MYB evolution.
Subsequent lineage specific duplication and loss events account for the variation in the number of 3R-MYB members observed in modern angiosperm species. For example, the grass lineage probably lost B-group 3R-MYBs (figs. 1 and 10); and the orchid and palms possibly lost A- and B-group 3R-MYBs (fig. 1). The B-group 3R-MYB gene in tobacco is constitutively expressed during the cell cycle and functions as a repressor (Ito et al. 2001), whereas A-group 3R-MYB genes in tobacco and Arabidopsis exhibit circadian expression patterns that peak during M-phase and act as activators (Ito et al. 2001; Araki et al. 2004; Haga et al. 2007). It was proposed that the repressors (B-group 3R-MYBs) and activators (A-group 3R-MYBs) collaborate to manipulate the cell progress through the G2/M transition in tobacco (Ito et al. 2001; Araki et al. 2004). Thus, it is not clear what effect the absence of the B-group 3R-MYBs has on cell cycle regulation in grasses. One possibility is that the monocot A- or C-groups have picked up B-group gene function after its loss. In that case, we would expect to see accelerated evolutionary rates in monocots within the A- or C-group. However, no positive selection in monocot lineages was detected with the method used (supplementary table S2, Supplementary Material online). Taken into consideration that orchid and palm might have lost both A- and B-group 3R-MYBs, the mechanism of monocot 3R-MYB regulation in cell cycle might be more complex.
DNA-Binding Domain and Regulatory Motifs
As R1 does not directly interact with DNA in animal c-MYB, we expected it to be less conserved compared with R3 and R2. However, we found the R1 domains of plant 3R-MYBs to be highly conserved (fig. 4d), suggesting R1 has functional significance. In animals, R1 of c-MYB participates in intra-molecular interaction with the carboxyl-terminus of itself (Dash et al. 1996). It is unclear whether that is the case in plant 3R-MYBs. In addition, R1 of c-MYB influences transactivation of target genes, and it may play a role in protein–protein interactions (Oelgeschläger et al. 2001). Further functional characterization of the candidate rate shift sites are likely to establish whether these lessons from animal c-MYB can provide insights into plant 3R-MYBs and illuminate the ways that the three different subgroups of the plant 3R-MYB proteins differ functionally. We did not detect any sites in the MYB domain region in A-, B- or C-groups under positive selection, suggesting positive selection may not have played a role in the divergence of these paralogs. However, the power of branch-site dN/dS test for positive selection decreases as the dS value increases (Gharib and Robinson-Rechavi 2013). As the MYB genes in this study came from distantly related species, dS saturation was expected and it could affect the test results.
The diversity of motifs in the plant 3R-MYBs is a result of both motif gain and loss during evolution. Motif 4, which originated in a common ancestor to seed plants, remains in gymnosperm and angiosperm A-group genes but has been lost in B- and C-groups genes. This motif is a repression domain that inhibits the ability of 3R-MYB proteins to activate downstream genes during the cell cycle in tobacco (Araki et al. 2004) and Arabidopsis (Chandran et al. 2010). Moreover, specific Serine/Threonine sites in motif 1 and 4 contribute to the removal of this inhibitory effect by cyclin-mediated phosphorylation (Araki et al. 2004; Chandran et al. 2010). The gain of motif 4 has added another level of regulation of the 3R-MYB proteins and increased the complexity of the 3R-MYB regulation network. Moreover, grass A-group 3R-MYBs have lost ∼12 amino acids in the middle of the repression motif, motif 4 (fig. 2c and supplementary fig. S3, Supplementary Material online), which may lead to differential function. Thus, in addition to the lack of B-group genes, divergent motif 4 is another factor that may contribute to the different cell cycle regulatory mechanism in grasses compared with the other flowering plants.
Intron Gain and Gene Structure Evolution
The origin of spliceosome-processed introns is a topic of debate (Koonin 2006; Rogozin et al. 2012) that has focused on two contrasting models: the introns-early and the introns-late hypothesis (Darnel 1978; Cavalier-Smith 1985). The introns-early hypothesis argues that gene intron–exon structure evolution is driven by intron loss, whereas the introns-late hypothesis argues that intron gain is the driver (Tarrío et al. 2008). Braun and Grotewold (1999) found only a single conserved intron position in eukaryotic 3R-MYBs, suggesting a major role for intron gain in this gene family. Our results expand on this, providing evidence that plant 3R-MYB genes underwent step-wise intron gain (fig. 5), consistent with the introns-late hypothesis.
AS Regulation of the Plant 3R-MYBs
Although >60% of plant multi-exon genes were suggested to undergo AS (Marquez et al. 2012), very little has been reported regarding alternatively spliced transcript isoforms from the MYB gene family. Previously, there were two reports of AS associated with plant R2R3-MYB genes. Arabidopsis AtMYB59 and AtMYB48, and their rice homologs AK111626 and AK107214, shared a conserved AS pattern, and the expression level of their splice variants are regulated during treatment with hormones and stresses (Li et al. 2006). A genome scale analysis of Cucumis sativus identified 55 R2R3-MYBs, among which eight exhibit AS regulation (Li et al. 2012). Our analysis suggests that >60% (16 out of 25 genes) of the 3R-MYB genes undergo AS, which is similar to the number of genes within plant genomes that are observed to undergo AS (Marquez et al. 2012), but higher than the extent of the R2R3-MYBs. Among the 30 AS events observed, there are two cases (Amborella Amtr00109.47, Arabidopsis At5g11510 and At3g09370; Grape GSVIVT01027493001 and Arabidopsis At4g00540) where the same AS pattern was shared between different species, indicating a possible ancestral AS event. However, the majority of the AS patterns were species-specific in our analysis. In a study that identified conserved AS events among nine angiosperm species, Chamala et al. (2015) observed that 18% of AS events identified in Amborella were shared with at least one other species, while 10% were shared with at least two other species. Plant 3R-MYB AS events seems to be less conserved relative to AS events among other genes.
Interestingly, we observed a conserved alternative polyadenylation event between Arabidopsis At4g32730 and At5g11510, both of which belong to the A-group. This AS event would lead to a truncated protein lacking motif 4, which is the important C-terminal repression motif (fig. 6). Transgenic study of the tobacco A-group gene NtmybA2 indicated that the C-terminal truncated protein is hyperactive compared with the whole length protein in upregulating downstream genes (Kato et al. 2009). Our results indicate that the Arabidopsis A-group 3R-MYB genes could generate both the primary protein products and the hyperactive protein products via AS.
Plant 3R-MYBs: Link between Cell Cycle and Abiotic Stresses
There are trade-offs between growth and stress resistance in plants. Increased abiotic stress resistance is usually associated with decreased plant growth (Bechtold et al. 2010), and arresting the cell cycle could lead to slow plant growth (Inzé and De Veylder 2006). Molecular evidence for connections between abiotic stress and cell cycle is emerging, but the mechanisms remain poorly defined. Phytohormones provide one piece of evidence that cell cycle and abiotic stress response are linked (del Pozo et al. 2005). For example, the key stress hormone abscisic acid (ABA) accumulates under osmotic stress and regulates various stress responsive genes, leading to increased stress resistance and growth inhibition (Yoshida et al. 2014). ABA also increases the expression of cell cycle inhibitors and down regulates factors related with DNA replication (Wang et al. 1998; Mudgil et al. 2002; Yang et al. 2002; del Pozo et al. 2005). Since it is likely that various abiotic stresses induce ABA, they are expected to change the rate of cell division. Reactive oxygen species (ROS) provide another potential link between cell cycle and abiotic stresses. ROS are often produced in reaction to various abiotic stresses (Mittler et al. 2004), and these can damage DNA and affect DNA replication, which may affect the progression through cell division (Gill and Tuteja 2010). A tobacco MAPKKK protein, NPK1, was observed to be involved in cell cycle, ROS signaling and plant growth (Hirt 2000; Jonak et al. 2002; Nakagami et al. 2005). In tobacco cells, NPK1 is expressed during M-phase and its protein product localizes to the phragmoplast and central region of the mitotic spindle, suggesting its role in cell cycle regulation (Hirt 2000). It has also been proposed that NPK1 senses H2O2 and activates stress MAPKs in response to increased levels of H2O2 (Hirt 2000; Nakagami et al. 2005). In addition, the Arabidopsis ANP1, an ortholog of the tobacco NPK1, downregulates auxin-induced gene expression (Hirt 2000). Although the NPK1 protein is involved in multiple signaling pathways, it is not clear if it mediates interaction between different signaling pathways.
Since there are often trade-offs between growth and stress resistance, genes that are positively related with plant growth and cell cycle are expected to be downregulated under stress conditions. However, up-regulation under stress conditions implies a possible stress-related regulatory function of the gene. 3R-MYB genes in tobacco (Ito et al. 2001; Araki et al. 2004, 2012, 2013; Ito 2005; Kato et al. 2009), Arabidopsis (Haga et al. 2007, 2011) and rice (Ma et al. 2009) are involved in regulating the cell cycle. Recently, rice OsMYB3R-2, a C-group 3R-MYB, has been shown to play a role in responses to cold stress as well (Dai et al. 2007; Ma et al. 2009); the expression of OsMYB3R-2 is upregulated under various stress conditions and overexpression of OsMYB3R-2 under cold stress increases tolerance and maintains a high level of cell division (Ma et al. 2009). Our analysis identified seven 3R-MYB genes from seven species that were significantly upregulated under abiotic stresses: barley MLOC10556 in response to cold; grape GSVIVT01019834001, Arabidopsis At3g09370 and soybean Glyma18G181100 in response to heat; and rice LOC_Os01g62410 (OsMYB3R-2), maize GRMZM2G081919 and poplar Potri006G085600 in response to drought (figs. 8 and 9). Among these seven genes, MLOC10556 is from the A-group, GSVIVT01019834001 is from B-group, while the remaining five genes were from C-group. The observation that C-group genes from multiple monocot and eudicot species show upregulation under various stresses suggests that the C-group 3R-MYB genes may be involved in both cell cycle and stress resistance, and the involvement in abiotic stresses may be an ancestral condition that is conserved across angiosperms. Identification of the upstream regulatory genes as well as other downstream target genes will contribute to the understanding of how plant C-group 3R-MYBs integrate in both cell cycle and abiotic stress response. The animal orthologs of the 3R-MYB genes are solely involved in the cell cycle. The coupling of abiotic stress response and cell cycle through the 3R-MYB gene products may play a role in the ability of plants to adapt to their sessile life style.
Supplementary Material
Supplementary data are available at Genome Biology and Evolution online.
Supplementary Material
Acknowledgments
Lucas Boatwright and George Tiley provided technical assistance and participated in discussions regarding WGD. This work was supported by awards from the Natural Science Foundation's Plant Genome Program (DBI-0922742 & IOS-1547787) to W.B.B., the China Scholarship Council (G.F), the University of Florida Plant Molecular and Cellular Biology graduate program (G.F.), the University of Florida (W.B.B and W.M.) and the UF Genetics Institute (W.B.B.).
Literature Cited
- Abbasi AA, Hanif H. 2012. Phylogenetic history of paralogous gene quartets on human chromosomes 1, 2, 8 and 20 provides no evidence in favor of the vertebrate octoploidy hypothesis. Mol Phylogenet Evol. 63:922–927. [DOI] [PubMed] [Google Scholar]
- Altschul SF, Gish W, Miller W, Myers EW, Lipman DJ. 1990. Basic local alignment search tool. J Mol Biol. 215:403–410. [DOI] [PubMed] [Google Scholar]
- Araki S, Ito M, Soyano T, Nishihama R, Machida Y. 2004. Mitotic cyclins simulate the activity of c-Myb-like factors for transactivation of G2/M phase-specific genes in tobacco. J Biol Chem. 279:32979–32988. [DOI] [PubMed] [Google Scholar]
- Araki S, Machida Y, Ito M. 2012. Virus-induced silencing of NtmybA1 and NtmybA2 causes incomplete cytokinesis and reduced shoot elongation in Nicotiana benthamiana. Plant Biotechnol. 29:483–487. [Google Scholar]
- Araki S, et al. 2013. Cosuppression of NtmybA1 and NtmybA2 causes downregulation of G2/M phase-expressed genes and negatively affects both cell division and expansion in tobacco. Plant Signal Behav. 8:e26780. [DOI] [PMC free article] [PubMed] [Google Scholar]
- Bailey TL, Williams N, Misleh C, Li WW. 2006. MEME: discovering and analyzing DNA and protein sequence motifs. Nucleic Acids Res. 34:W369–W373. [DOI] [PMC free article] [PubMed] [Google Scholar]
- Bechtold U, et al. 2010. Constitutive salicylic acid defences do not compromise seed yield, drought tolerance and water productivity in the Arabidopsis accession C24. Plant Cell Environ. 33:1959–1973. [DOI] [PubMed] [Google Scholar]
- Bergoltz S, et al. 2001. The highly conserved DNA-binding domains of A-, B, and c-Myb differ with respect to DNA-binding phosphorylation and redox properties. Nucleic Acids Res. 29:3546–3556. [DOI] [PMC free article] [PubMed] [Google Scholar]
- Braun EL, Grotewold E. 1999. Newly discovered plant c-myb-like genes rewrite the evolution of the plant myb gene family. Plant Physiol. 121:21–24. [DOI] [PMC free article] [PubMed] [Google Scholar]
- Cavalier-Smith T. 1985. Selfish DNA and the origin of introns. Nature 315:283–284. [DOI] [PubMed] [Google Scholar]
- Chamala S, Feng G, Chavarro C, Barbazuk WB. 2015. Genome-wide identification of evolutionarily conserved alternative splicing events in flowering plants. Front Bioeng Biotechnol. 3:33.. [DOI] [PMC free article] [PubMed] [Google Scholar]
- Chandran D, Inada N, Hather G, Kleindt CK, Wildermuth MC. 2010. Laser microdissection of Arabidopsis cells at the powdery mildew infection site reveals site-specific processes and regulators. Proc Natl Acad Sci U S A. 107:460–465. [DOI] [PMC free article] [PubMed] [Google Scholar]
- Chang YF, Iman JS, Wilkinson MF. 2007. The nonsense-mediated decay RNA surveillance pathway. Annu Rev Biochem. 76:51–74. [DOI] [PubMed] [Google Scholar]
- Dai X, et al. 2007. Overexpression of an R1R2R3 MYB gene, OsMYB3R-2, increases tolerance to freezing, drought, and salt stress in transgenic Arabidopsis. Plant Physiol. 143:1739–1751. [DOI] [PMC free article] [PubMed] [Google Scholar]
- Darnel JE. 1978. Implications of RNA-RNA splicing in evolution of eukaryotic cells. Science 202:1257–1260. [DOI] [PubMed] [Google Scholar]
- Dash AB, Orrico FC, Ness SA. 1996. The EVES motif mediates both intermolecular and intramolecular regulation of c-Myb. Gene Dev. 10:1858–1869. [DOI] [PubMed] [Google Scholar]
- Dash S, Van Hemert J, Hong L, Wise RP, Dickerson JA. 2012. PLEXdb: gene expression resources for plants and plant pathogens. Nucleic Acids Res. 40:D1194–D1201. [DOI] [PMC free article] [PubMed] [Google Scholar]
- Davidson CJ, Guthrie EE, Lipsick JS. 2012. Duplication and maintenance of the Myb genes of vertebrate animals. Biol Open 2:101–110. [DOI] [PMC free article] [PubMed] [Google Scholar]
- Davidson CJ, Tirouvanziam R, Herzenberg LA, Lipsick JS. 2005. Functional evolution of the vertebrate Myb gene family B-Myb, but neither A-Myb nor c-Myb, complements Drosophila Myb in hemocytes. Genetics 169:215–229. [DOI] [PMC free article] [PubMed] [Google Scholar]
- del Pozo JC, Lopez-Matas MA, Ramriez-Parra E, Gutierrez C. 2005. Hormonal control of the plant cell cycle. Physiol Plantarum 123:173–183. [Google Scholar]
- Dias AP, Braun EL, McMullen MD, Grotewold E. 2003. Recently duplicated maize R2R3 Myb genes provide evidence for distinct mechanisms of evolutionary divergence after duplication. Plant Physiol. 131:610–620. [DOI] [PMC free article] [PubMed] [Google Scholar]
- Du H, et al. 2013. Genome-wide identification and evolutionary and expression analyses of MYB-related genes in land plants. DNA Res. 20:437–448. [DOI] [PMC free article] [PubMed] [Google Scholar]
- Dubos C, et al. 2010. MYB transcription factor in Arabidopsis. Trends Plant Sci. 15:573–581. [DOI] [PubMed] [Google Scholar]
- Dugas DV, et al. 2011. Functional annotation of the transcriptome of Sorghum bicolor in response to osmotic stress and abscisic acid. BMC Genomics 12:514. [DOI] [PMC free article] [PubMed] [Google Scholar]
- Eddy SR. 2011. Accelerated profile HMM searches. PLoS Comput Biol. 7:e1002195.. [DOI] [PMC free article] [PubMed] [Google Scholar]
- Edgar RC. 2004. MUSCLE: multiple sequence alignment with high accuracy and high throughput. Nucleic Acids Res. 32:1792–1797. [DOI] [PMC free article] [PubMed] [Google Scholar]
- Feller A, Machemer K, Braun EL, Grotewold E. 2011. Evolutionary and comparative analysis of MYB and bHLH plant transcription factors. Plant J. 66:94–116. [DOI] [PubMed] [Google Scholar]
- Finn RD, et al. 2014. Pfam: the protein families database. Nucleic Acids Res. 42:D222–D230. [DOI] [PMC free article] [PubMed] [Google Scholar]
- Gaucher EA, Gu X, Miyamoto MM, Benner SA. 2002. Predicting functional divergence in protein evolution by site-specific rate shifts. Trends Biochem Sci. 27:315–321. [DOI] [PubMed] [Google Scholar]
- Gaucher EA, Miyamoto MM, Benner SA. 2001. Function-structure analysis of proteins using covarion-based evolutionary approaches: elongation factors. Proc Natl Acad Sci U S A. 98:548–552. [DOI] [PMC free article] [PubMed] [Google Scholar]
- Gharib WH, Robinson-Rechavi M. 2013. The branch-site test of positive selection is surprisingly robust but lacks power under synonymous substitution saturation and variation in GC. Mol Biol Evol. 30:1675–1686. [DOI] [PMC free article] [PubMed] [Google Scholar]
- Gibson TJ, Spring J. 2000. Evidence in favour of ancient octaploidy in the vertebrate genome. Biochem Soc Trans. 28:259–264. [DOI] [PubMed] [Google Scholar]
- Gill SS, Tuteja N. 2010. Reactive oxygen species and antioxidant machinery in abiotic stress tolerance in crop plants. Plant Physiol BioChem. 48:909–930. [DOI] [PubMed] [Google Scholar]
- Goldman N, Yang Z. 1994. A codon-based model of nucleotide substitution for protein-coding DNA sequences. Mol Biol Evol. 11:725–736. [DOI] [PubMed] [Google Scholar]
- Grotewold E, et al. 2000. Identification of the residues in the Myb domain of maize C1 that specify the interaction with the bHLH cofactor R. Proc Natl Acad Sci U S A. 97:13579–13584. [DOI] [PMC free article] [PubMed] [Google Scholar]
- Haas BJ, Delcher AL, Wortman JR, Salzberg SL. 2004. DAGchainer: a tool for mining segmental genome duplications and synteny. Bioinformatics 20:3643–3646. [DOI] [PubMed] [Google Scholar]
- Haga N, et al. 2007. R1R2R3-Myb proteins positively regulate cytokinesis through activation of KNOLLE transcription in Arabidopsis thaliana. Development 134:1101–1110. [DOI] [PubMed] [Google Scholar]
- Haga N, et al. 2011. Mutations in MYB3R1 and MYB3R4 cause pleiotropic developmental defects and preferential down-regulation of multiple G2/M-specific genes in Arabidopsis. Plant Physiol. 157:706–717. [DOI] [PMC free article] [PubMed] [Google Scholar]
- Hedges SB, Martin J, Suleski M, Paymer M, Kumar S. 2015. Tree of life reveals clock-like speciation and diversification. Mol Biol Evol. 32:835–845. [DOI] [PMC free article] [PubMed] [Google Scholar]
- Hirt H. 2000. Connecting oxidative stress, auxin, and cell cycle regulation through a plant mitogen-activated protein kinase pathway. Proc Natl Acad Sci U S A. 97:2405–2407. [DOI] [PMC free article] [PubMed] [Google Scholar]
- Hu B, et al. 2015. GSDS 2.0: an upgraded gene feature visualization server. Bioinformatics 31:1296–1297. [DOI] [PMC free article] [PubMed] [Google Scholar]
- Huang CH, et al. 2016. Resolution of Brassicaceae phylogeny using nuclear genes uncovers nested radiations and supports convergent morphological evolution. Mol Biol Evol. 33:394–412. [DOI] [PMC free article] [PubMed] [Google Scholar]
- Inzé D, De Veylder L. 2006. Cell cycle regulation in plant development. Annu Rev Genet. 40:77–105. [DOI] [PubMed] [Google Scholar]
- Ito M, et al. 1998. A novel cis-acting element in promoters of plant B-type cyclin genes activates M phase-specific transcription. Plant Cell 10:331–341. [DOI] [PMC free article] [PubMed] [Google Scholar]
- Ito M, et al. 2001. G2/M-phase-specific transcription during the plant cell cycle is mediated by c-Myb-like transcription factors. Plant Cell 13:1891–1905. [DOI] [PMC free article] [PubMed] [Google Scholar]
- Ito M. 2005. Conservation and diversification of the three-repeat Myb transcription factors in plants. J Plant Res. 118:61–69. [DOI] [PubMed] [Google Scholar]
- Jiao Y, et al. 2011. Ancestral polyploidy in seed plants and angiosperms. Nature 473:97–100. [DOI] [PubMed] [Google Scholar]
- Jonak C, Ökrész L, Bögre L, Hirt H. 2002. Complexity, cross talk and integration of plant MAP kinase signalling. Curr Opin Plant Biol. 5:415–424. [DOI] [PubMed] [Google Scholar]
- Kato K, et al. 2009. Preferential up-regulation of G2/M phase-specific genes by overexpression of the hyperactive form of NtmybA2 lacking its negative regulation domain in tobacco BY-2 cells. Plant Physiol. 149:1945–1957. [DOI] [PMC free article] [PubMed] [Google Scholar]
- Kilian J, et al. 2007. The AtGenExpress global stress expression data set: protocols, evaluation and model data analysis of UV-B light, drought and cold stress responses. Plant J. 50:347–363. [DOI] [PubMed] [Google Scholar]
- Klempnauer KH, Gonda TJ, Bishop JM. 1982. Nucleotide sequence of the retroviral leukemia gene v-myb and its cellular progenitor c-myb: the architecture of a transduced oncogene. Cell 31:453–463. [DOI] [PubMed] [Google Scholar]
- Koonin EV. 2006. The origin of introns and their role in eukaryogenesis: a compromise solution to the introns-early versus introns-late debate?. Biol Direct. 1:22.. [DOI] [PMC free article] [PubMed] [Google Scholar]
- Lareau LF, Inada M, Green RE, Wengrod JC, Brenner SE. 2007. Unproductive splicing of SR genes associated with highly conserved and ultraconserved DNA elements. Nature 446:926–929. [DOI] [PubMed] [Google Scholar]
- Le SQ, Dang CC, Gascuel O. 2012. Modeling protein evolution with several amino acid replacement matrices depending on site rates. Mol Biol Evol. 29:2921–2936. [DOI] [PubMed] [Google Scholar]
- Le SQ, Gascuel O. 2008. An improved general amino acid replacement matrix. Mol Biol Evol. 25:1307–1320. [DOI] [PubMed] [Google Scholar]
- Letunic I, Doerks T, Bork P. 2015. SMART: recent updates, new developments and status in 2015. Nucleic Acids Res. 43:D257–D260. [DOI] [PMC free article] [PubMed] [Google Scholar]
- Li J, et al. 2006. A subgroup of MYB transcription factor genes undergoes highly conserved alternative splicing in Arabidopsis and rice. J Exp Bot. 57:1263–1273. [DOI] [PubMed] [Google Scholar]
- Li Q, Zhang C, Li J, Wang L, Ren Z. 2012. Genome-wide identification and characterization of R2R3MYB gene family in Cucumis sativus. PLoS One 7:e47576.. [DOI] [PMC free article] [PubMed] [Google Scholar]
- Lipsick JS. 1996. One billion years of Myb. Oncogene 13:223–235. [PubMed] [Google Scholar]
- Ma Q, et al. 2009. Enhanced tolerance to chilling stress in OsMYB3R-2 transgenic rice is mediated by alteration in cell cycle and ectopic expression of stress genes. Plant Physiol. 150:244–256. [DOI] [PMC free article] [PubMed] [Google Scholar]
- Marchler-Bauer A, et al. 2015. CDD: NCBI’s conserved domain database. Nucleic Acids Res. 43:D222–D226. [DOI] [PMC free article] [PubMed] [Google Scholar]
- Marquez Y, Brown JWS, Simpson C, Barta A, Kalyna M. 2012. Transcriptome survey reveals increased complexity of the alternative splicing landscape in Arabidopsis. Genome Res. 22:1184–1195. [DOI] [PMC free article] [PubMed] [Google Scholar]
- Martin C, Paz-Ares J. 1997. MYB transcription factors in plants. Trends Genet. 13:67–73. [DOI] [PubMed] [Google Scholar]
- Mittler R, Vanderauwera S, Gollery M, Van Breusegem F. 2004. Reactive oxygen gene network of plants. Trends Plant Sci. 9:490–498. [DOI] [PubMed] [Google Scholar]
- Mudgil Y, Singh BN, Upadhyaya KC, Sopory SK, Reddy MK. 2002. Cloning and characterization of a cell cycle-regulated gene encoding topoisomerase I from Nicotiana tabacum that is inducible by light, low temperature and abscisic acid. Mol Genet Genomics 267:380–390. [DOI] [PubMed] [Google Scholar]
- Nakagami H, Pitzschke A, Hirt H. 2005. Emerging MAP kinase pathways in plant stress signalling. Trends Plant Sci. 10:339–346. [DOI] [PubMed] [Google Scholar]
- Oelgeschläger M, Kowenz-Leutz E, Schreek S, Leutz A, Lüscher B. 2001. Tumorigenic N-terminal deletions of c-Myb modulate DNA binding, transactivation, and cooperativity with C/EBP. Oncogene 20:7420–7424. [DOI] [PubMed] [Google Scholar]
- Ogata K, et al. 1992. Solution structure of a DNA-binding unit of Myb: a helix-turn-helix-related motif with conserved tryptophans forming a hydrophobic core. Proc Natl Acad Sci U S A. 89:6428–6432. [DOI] [PMC free article] [PubMed] [Google Scholar]
- Ogata K, et al. 1994. Solution structure of a specific DNA complex of the Myb DNA-binding domain with cooperative recognition helices. Cell 79:639–648. [DOI] [PubMed] [Google Scholar]
- Olson A, et al. 2014. Expanding and vetting Sorghum bicolor gene annotations through transcriptome and methylome sequencing. Plant Genome 7:2. [Google Scholar]
- Ording E, Kvavik W, Bostad A, Gabrielsen OS. 1994. Two functionally distinct half sites in the DNA-recognition sequence of the Myb oncoprotein. Eur J BioChem. 222:113–120. [DOI] [PubMed] [Google Scholar]
- Pan Q, Shai O, Lee LJ, Frey BJ, Blencowe BJ. 2008. Deep surveying of alternative splicing complexity in the human transcriptome by high-throughput sequencing. Nat Genet. 40:1413–1415. [DOI] [PubMed] [Google Scholar]
- Paterson AH, et al. 2009. The Sorghum bicolor genome and the diversification of grasses. Nature 457:551–556. [DOI] [PubMed] [Google Scholar]
- R Development Core Team. 2014. R: a language and environment for statistical computing. Vienna (Austria: ): R Foundation for Statistical Computing. [Google Scholar]
- Rensing SA, et al. 2007. An ancient genome duplication contributed to the abundance of metabolic genes in the moss Phycomitrella patens. BMC Evol Biol. 7:130. [DOI] [PMC free article] [PubMed] [Google Scholar]
- Rogozin IB, Carmel L, Csuros M, Koonin EV. 2012. Origin and evolution of spliceosomal introns. Biol Direct. 7:11.. [DOI] [PMC free article] [PubMed] [Google Scholar]
- Rosinski JA, Atchley WR. 1998. Molecular evolution of the Myb family of transcription factors: evidence for polyphyletic origin. J Mol Evol. 46:74–83. [DOI] [PubMed] [Google Scholar]
- Ruhfel BR, Gitzendanner MA, Soltis PS, Soltis DE, Burleigh JG. 2014. From algae to angiosperms – inferring the phylogeny of green plants (Viridiplantae) from 360 plastid genomes. BMC Evol Biol. 14:23.. [DOI] [PMC free article] [PubMed] [Google Scholar]
- Stamatakis A. 2014. RAxML version 8: a tool for phylogenetic analysis and post-analysis of large phylogenies. Bioinformatics 30:1312–1313. [DOI] [PMC free article] [PubMed] [Google Scholar]
- Tamura K, Stecher G, Peterson D, Filipski A, Kumar S. 2013. MEGA6: molecular evolutionary genetics analysis version 6.0. Mol Biol Evol. 30:2725–2729. [DOI] [PMC free article] [PubMed] [Google Scholar]
- Tarrío R, Ayala FJ, Rodríguez-Trelles F. 2008. Alternative splicing: a missing piece in the puzzle of intron gain. Proc Natl Acad Sci U S A. 105:7223–7228. [DOI] [PMC free article] [PubMed] [Google Scholar]
- Vanneste K, Maere S, Van de Peer Y. 2014. Tangled up in two: a burst of genome duplications at the end of the Cretaceous and the consequences for plant evolution. Philos Trans R Soc B. 369:20130353.. [DOI] [PMC free article] [PubMed] [Google Scholar]
- Wang H, et al. 1998. ICK1, a cyclin-dependent protein kinase inhibitor from Arabidopsis thaliana interacts with both Cdc2a and CycD3, and its expression is induced by abscisic acid. Plant J. 15:501–510. [DOI] [PubMed] [Google Scholar]
- Wu YC, Rasmussen MD, Bansal MS, Kellis M. 2013. TreeFix: statistically informed gene tree error correction using species trees. Syst Biol. 62:110–120. [DOI] [PMC free article] [PubMed] [Google Scholar]
- Yang SW, Jin E, Chung IK, Kim WT. 2002. Cell cycle-dependent regulation of telomerase activity by auxin, abscisic acid and protein phosphorylation in tobacco BY-2 suspension culture cells. Plant J. 29:617–626. [DOI] [PubMed] [Google Scholar]
- Yang Z. 2007. PAML4: phylogenetic analysis by maximum likelihood. Mol Biol Evol. 24:1586–1591. [DOI] [PubMed] [Google Scholar]
- Yoshida T, Mogami J, Yamaguchi-Shinozaki K. 2014. ABA-dependent and ABA-independent signaling in response to osmotic stress in plans. Curr Opin Plant Biol. 21:133–139. [DOI] [PubMed] [Google Scholar]
- Zeng L, et al. 2014. Resolution of deep angiosperm phylogeny using conserved nuclear genes and estimates of early divergence times. Nat Commun. 5:4956.. [DOI] [PMC free article] [PubMed] [Google Scholar]
Associated Data
This section collects any data citations, data availability statements, or supplementary materials included in this article.