Abstract
Objectives
1) To identify the association of positive lymph node metastases (pN+), number of positive nodes, and pN subclassification with cancer, treatment, patient, geographic, and institutional variables, and 2) to recommend extent of lymphadenectomy needed to accurately detect pN+ for esophageal cancer.
Summary Background Data
Limited data and traditional analytic techniques have precluded identifying intricate associations of pN+ with other cancer, treatment, and patient characteristics.
Methods
Data on 5,806 esophagectomy patients from the Worldwide Esophageal Cancer Collaboration (WECC) were analyzed by Random Forest machine learning techniques.
Results
pN+, number of positive nodes, and pN subclassification were associated with increasing depth of cancer invasion (pT), increasing cancer length, decreasing cancer differentiation (G), and more regional lymph nodes resected. Lymphadenectomy necessary to accurately detect pN+ is 60 for shorter, well-differentiated cancers (<2.5 cm) and 20 for longer, poorly differentiated ones.
Conclusions
In esophageal cancer, pN+, increasing number of positive nodes, and increasing pN classification are associated with deeper invading, longer, and poorly differentiated cancers. Consequently, if the goal of lymphadenectomy is to accurately define pN+ status of such cancers, few nodes need to be removed. Conversely, superficial, shorter, and well-differentiated cancers require a more extensive lymphadenectomy to accurately define pN+ status.
Regional lymph node metastases (pN+) in esophageal cancer patients negatively affect outcome. However, the extent of lymphadenectomy necessary to maximize survival may be different from the extent necessary to accurately detect pN+. Understanding the associations of pN+ with extent of lymphadenectomy and other cancer, treatment, and patient characteristics may aid in treatment decisions and prognostication; however, their intricate associations have been difficult to identify because of limited data and traditional analytic techniques.1
To overcome prior data limitations, the Worldwide Esophageal Cancer Collaboration (WECC) uniquely provides, in a single database, cancer, treatment, patient, geographic, and institutional variables for a large cohort of esophagectomy patients.2 To overcome prior analytic limitations, Random Forest analysis,3 a modern machine-learning technique,4, 5 permits exploration of such nonlinear, complex interrelationships.3, 6 Thus, the purpose of this study was to use this worldwide data set and machine-learning technique to identify WECC variables associated with pN+, number of positive nodes, and pN subclassification in order to develop recommendations for the number of regional lymph nodes that must be resected to accurately detect pN+.
PATIENTS AND METHODS
Patients
A total of 5,806 patients in WECC, a worldwide consortium of institutions that have contributed deidentified patient data on esophagectomy for cancer, underwent esophagectomy alone (no preoperative or postoperative adjuvant therapy).2 All data sets were approved for research by each site’s Institutional Review Board, and data use agreements were executed when required. WECC variables included patient demographics (age, sex, race), region of the world (East, West), institution, cancer characteristics (location in esophagus, histopathologic cell type, histopathologic grade, cancer length, pT, pN, pM, and number of regional lymph nodes containing metastatic cancer (herein termed positive nodes), and esophagectomy variables (number of regional lymph nodes resected, residual cancer, and year of surgery), 31 variables in all (Table 1).
Table 1.
Patient and Esophageal Cancer Characteristics
| Characteristic | na | No. (%) or Mean ± SD |
|---|---|---|
| Age (y) | 5,664 | 63 ± 11 |
| Male | 5,672 | 4,392 (77) |
| Race | 4,063 | |
| White | 2,834 (70) | |
| Asian | 1,171 (28) | |
| Other | 58 (2.0) | |
| East (part of world) | 5,673 | 1,171 (21) |
| Location of cancer | 4,602 | |
| Upper third | 209 (5.0) | |
| Middle third | 1,209 (26) | |
| Lower third | 3,184 (69) | |
| Cancer length (cm) | 3,150 | 3.5 ± 2.6 |
| pT | 5,673 | |
| is | 370 (7.0) | |
| 1 | 1,393 (25) | |
| 2 | 932 (16) | |
| 3 | 2,787 (49) | |
| 4 | 191 (3.0) | |
| pN | 5,639 | |
| 0 | 3,199 (57) | |
| + | 2,440 (43) | |
| Number of regional lymph nodes | 5,238 | |
| N0 | 3,199 (61) | |
| N1 | 952 (18) | |
| N2 | 634 (12) | |
| N3 | 453 (9.0) | |
| Number of regional lymph nodes resected | 4,250 | |
| 0 | 438 (10) | |
| 1–5 | 1,019 (24) | |
| 6–10 | 625 (15) | |
| 11–15 | 492 (12) | |
| 16–25 | 774 (18) | |
| ≥26 | 902 (21) | |
| pM | 5,673 | |
| 0 | 5,258 (93) | |
| 1 | 415 (7.0) | |
| G (histologic grade) | 4,202 | |
| G1 (well differentiated) | 1,422 (34) | |
| G2 (moderately differentiated) | 1,349 (32) | |
| G3 (poorly differentiated) | 1,425 (34) | |
| G4 (undifferentiated) | 6 (<1) | |
| Histopathologic cell type | 5,673 | |
| Squamous cell carcinoma | 2,154 (38) | |
| Adenocarcinoma | 3,519 (62) | |
| Resection margins | 5,194 | |
| R0 | 4,605 (89) | |
| R1 | 464 (9.0) | |
| R2 | 1,256 (2.0) | |
| Year of esophagectomy | 5,806 | |
| 1970s | 78 (1.3) | |
| 1980s | 1,265 (22) | |
| 1990s | 2,303 (40) | |
| 2000s | 2,160 (37) |
Patients with data available.
Key: SD, standard deviation.
Endpoints
The primary endpoint was pN+ disease. Secondary endpoints were number of positive nodes and pN classification: N0, no positive nodes; N1, 1 to 2 positive nodes; N2, 3 to 6 positive nodes; and N3, 7 or more positive nodes, based on the 7th edition of the American Joint Committee on Cancer (AJCC) staging manual.7
Data Analysis
Overview
Random Forest technology was chosen as the analytic strategy because of the known complex interactions among esophageal cancer characteristics identified in the 7th edition of the AJCC cancer staging endeavor.4, 7 The method is related to classification and decision-tree analyses, wherein the variable most related to an outcome of interest is first optimally split to improve prediction, then followed by more and more splits of it and other variables to create a tree (recursive partitioning, classification and regression trees). An individual tree “grown” by this method is inherently unstable, and this can be demonstrated by creating trees from bootstrap samples of the original data set that split much differently (the bootstrap data set is formed by random sampling with replacement until a data set of equal size is generated; there will be some duplicated patients, and an average of 37% will not be sampled). To overcome this instability, a forest of trees is grown from such bootstrap samples, permitting an ensemble average to be formulated across the individual trees.3 Because the method is completely nonparametric, with no restrictive underlying model assumptions, complex interactions among variables can be robustly accounted for. Validity of the forest is evaluated by assessing outcome among patients who were not selected by the bootstrap process.
Because some values were missing for some of the 31 variables, Random Forest imputation was employed to maximize use of the available data.8
Rather than P-values, two metrics of prediction accuracy are generated based on the patients not selected (called the “out-of-bag” samples). The first ranks the importance of each variable in predicting the outcome of interest (variable importance, or VIMP).3 The second quantifies the average number of branches before a variable is split (called “minimal depth”): The closer to the trunk of the tree a variable is split, the more important that variable is to prediction accuracy.9
In summary, predictors of outcome using Random Forest technology are identified in two steps: 1) building the forest based on cancer and other characteristics and the outcome of interest, and 2) using the resulting forest to discover the importance of variables to the prediction of the outcome and their interrelationships with respect to outcome.
Details of how this method was used for this study are given in SDC Appendix E1 and briefly summarized as follows.
Predictors of N+
Predictors of N+ were identified using the randomForestSRC R package.10 All 31 variables described in Table 1 plus surgical site were used to generate 1,000 random bootstrap classification trees. The average 37% of patients not included in building a given tree were used to estimate the cross-validated probability of a patient being N+.
Predictors of Number of Positive Nodes
Predictors of number of positive nodes were identified using Random Forest nonparametric regression analysis.10 A forest of 1,000 trees was grown.
Predictors of pN Classification
A Random Forest strategy similar to that for identifying predictors of N+ was used for the ordinal outcome pN classification (N0, N1, N2, and N3) according to criteria in the 7th edition of the AJCC Cancer Staging Manual.7
Lymphadenectomy Needed to Accurately Detect pN+
To ascertain extent of lymph node resection needed to accurately detect pN+ for each combination of pT and length of cancer (dichotomized as <2.5 or ≥2.5 cm), the number of lymph nodes resected was replaced by a fixed cutoff value, and the predicted value of being pN+ was calculated using the previously constructed pN+ classification forest and the out-of-bag patients. The cutoff value was varied from 0 to the maximum number of resected nodes observed within the pT and cancer length categories. The average over all such predicted values yielded the adjusted predicted probability of pN+ for the given cutoff. The point at which these curves flattened was interpreted as the lymphadenectomy needed to accurately detect pN+.
RESULTS
Predictors of pN+
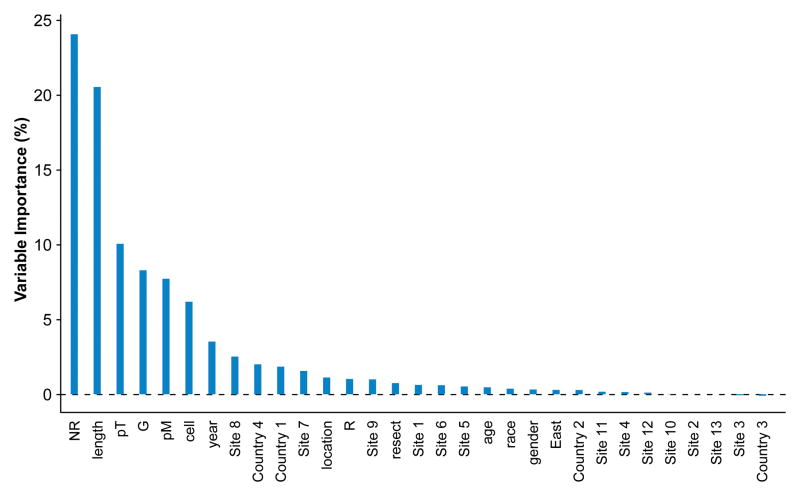
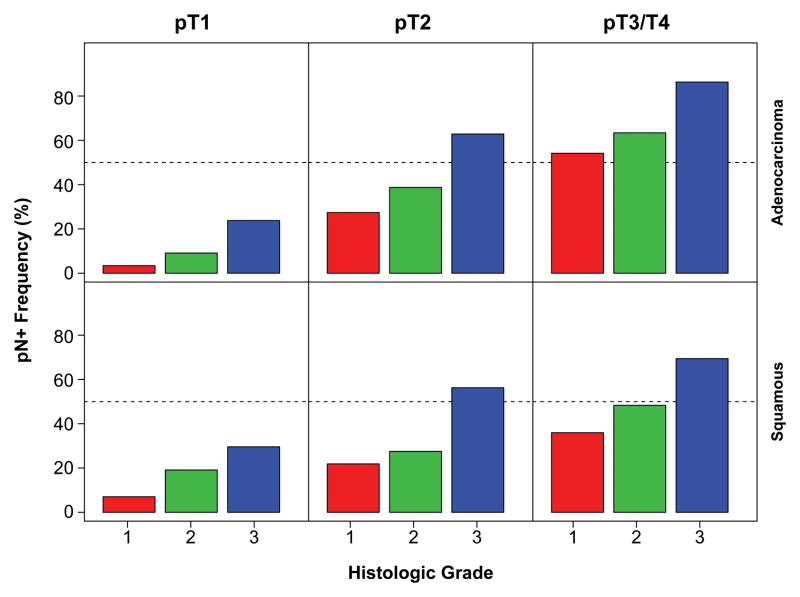
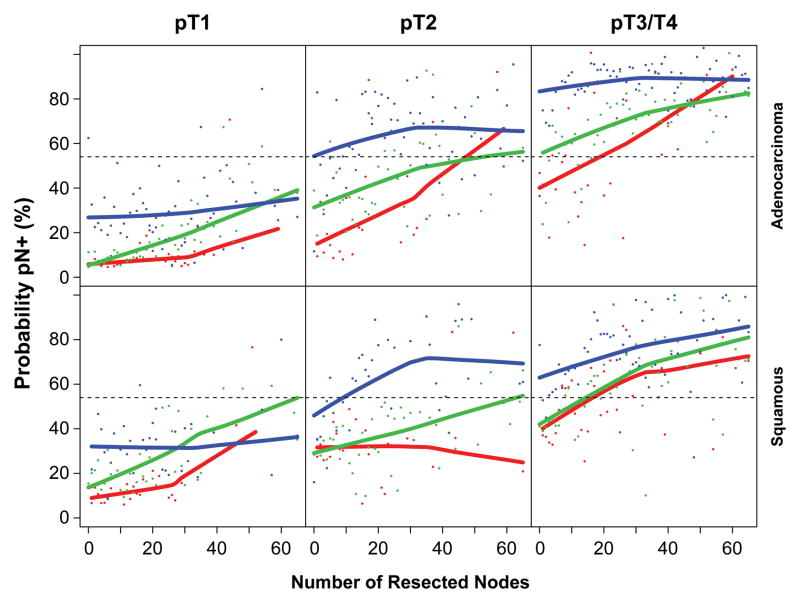
More advanced cancer characteristics—longer cancer length, higher pT, and higher G—were the strongest predictors of pN+ (Figure 1, Figure 2, and SDC Figure E1). Presence of pM1 (SDC Figure E2) and squamous cell cancer were predictive, but less so. The certainty of pN0 was improved with increasing number of negative lymph nodes resected, because the likelihood of resecting a positive node increased with increasing number of nodes resected (Figure 3 and SDC Figure E3).
Figure 1.
Variable importance for each of the 31 variables from Random Forest analysis of pN status.
Figure 2.
Frequency of pN+ according to G, pT, and histopathologic cell type (red=G1, green=G2, blue=G3). Key: adeno, adenocarcinoma; squam, squamous cell cancer.
Figure 3.
Out-of-bootstrap predicted probability of pN+ cancer as a function of number of nodes resected, stratified by G, pT, and histopathologic cell type (red=G1, green=G2, blue=G3). Individual dots represent predicted probabilities and solid lines are LOESS (locally weighted scatterplot smoothing) values of predicted probabilities. Key: adeno, adenocarcinoma; squam, squamous cell cancer.
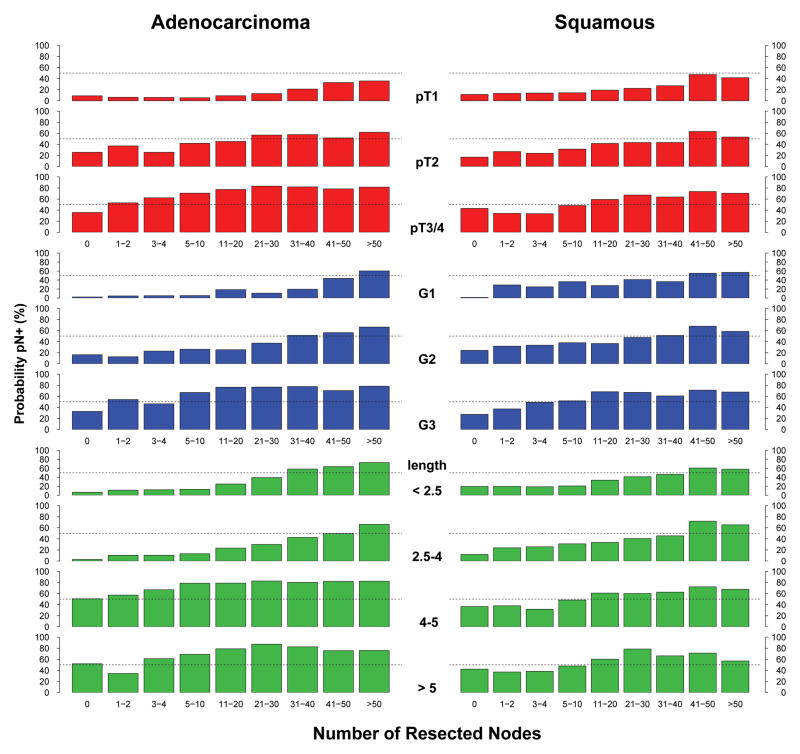
The complex interplay of cancer characteristics, number of resected nodes, and pN+ is illuminated in Figure 4. The relationships were more striking for adenocarcinoma than for squamous cell carcinoma. Identifying pN+ required fewer resected lymph nodes for deeply invasive, poorly differentiated, or long cancers than for superficial invasion, well-differentiated, or short cancers. pT3, G3, or cancers longer than 4 cm were highly likely to be pN+ at all levels of nodes resected. Note that when no nodes were resected, the likelihood of pN+ became an average that increased as depth of invasion, grade, and length increased.
Figure 4.
Probability of pN+ according to number of resected nodes and various esophageal cancer characteristics.
Predictors of Number of Positive Nodes
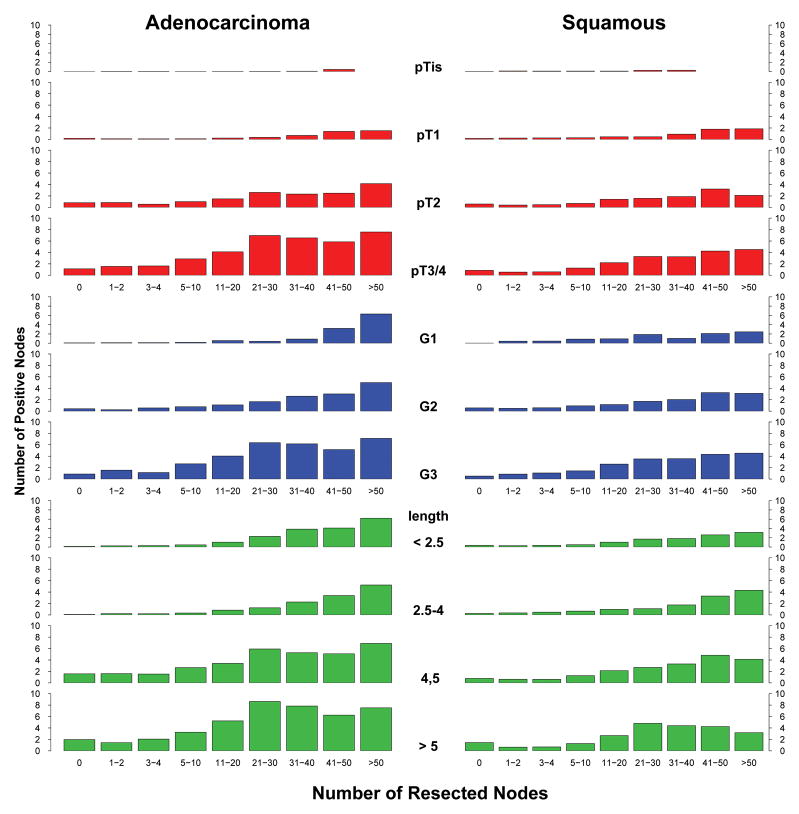
The same cancer characteristics that predicted presence of pN+ also predicted higher number of positive nodes (Figure 5). However, because number of positive nodes cannot exceed number of resected nodes, the relationship shifted to the right until about 11–20 nodes were resected. pT1 cancers that were node positive were predicted to have few positive nodes, but pT3/pT4 cancers that were node positive had a large number of positive nodes. Cancers longer than 4 cm were likely to have more than 5 positive nodes. G1 and G2 had a similar number of positive nodes, but fewer than G3.
Figure 5.
Predicted number of positive nodes according to number of resected nodes and various esophageal cancer characteristics.
Predictors of pN Classification
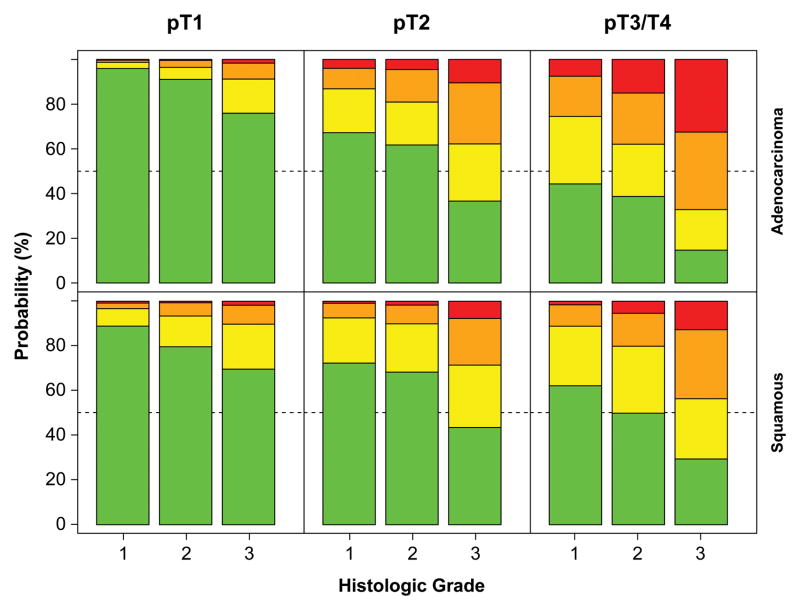
The association of cancer characteristics with higher classification of pN+ was more striking in adenocarcinoma than in squamous cell carcinoma (Figure 6). Superficial cancers were likely to be pN0, and if they were not, they were likely to be pN1 rather than pN2 or, rarely, pN3. In contrast, deeply invasive cancers were more likely to be pN2 or pN3 than pN1, and if they were poorly differentiated, they were unlikely to be pN0.
Figure 6.
Out-of-bootstrap predicted probability of pN0, pN1 (1–2 positive nodes), pN2 (3–6 positive nodes), and pN3 (7 or more positive nodes) cancers, stratified by G, pT, and histopathologic cell type (red=pN0, green=pN1, blue=pN2, turquoise=pN3). Key: adeno, adenocarcinoma; squam, squamous cell cancer.
Lymphadenectomy Needed to Accurately Detect pN+
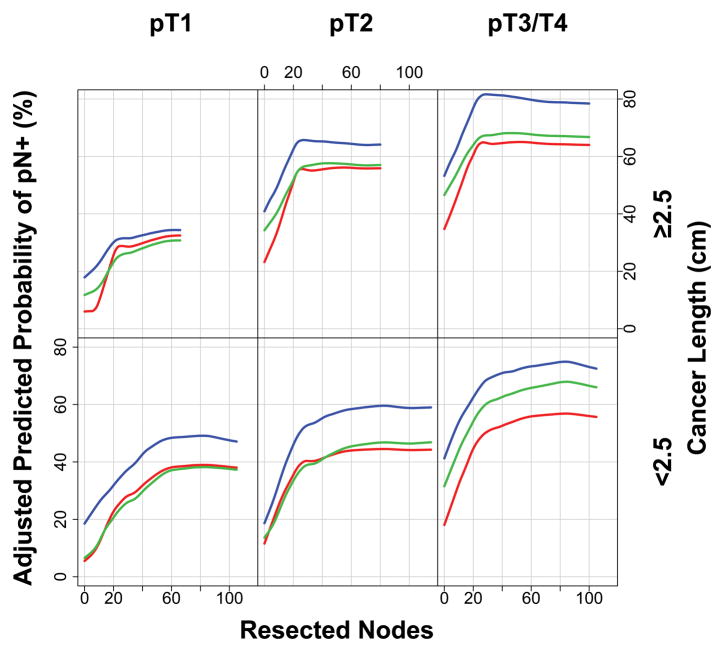
Extent of lymphadenectomy needed to accurately detect pN+ decreased with increasing cancer length (Figure 7). Thus, for short cancers (<2.5 cm), the curves flatten at approximately 60 resected nodes. For cancers ≥2.5 cm, the curves clearly flatten at 20 nodes resected.
Figure 7.
Adjusted predicted probability of pN+ for various cutoff values of number of resected nodes, according to pT and cancer length. Where curves plateau is interpreted as the lymphadenectomy necessary to accurately detect pN+.
DISCUSSION
Principal Findings
The strongest associations with pN+ cancers reflect cancer growth, biology, and histology. Cancer growth, represented by two dimensions—depth of invasion and length—is strongly related to pN+. Adenocarcinoma invading beyond the muscularis propria (pT3) and cancers longer than 4 cm had a 60% to 80% prevalence of pN+. Cancer biology reflected by differentiation was strongly associated with pN+: G3 cancers had a 30% to 80% prevalence of pN+, depending on pT. However, we discovered a difference in prevalence of pN+ associated with histopathologic cell type; for the “same cancer,” pN+ was more likely in adenocarcinoma than squamous cell cancer. The process of metastases resulting in spread to regional lymph nodes (pN+) and distant sites (pM1) not surprisingly links these two anatomic cancer characteristics. Rarely was a pM1 patient pN0. No cancer location was associated with a higher prevalence of pN+.
Intuitively, the more one looks, the more one finds. Thus, the only non-cancer characteristic associated with pN+ was number of regional lymph nodes resected—the extent of surgical lymphadenectomy. Proportionately, this was most important in short well-differentiated squamous cell cancers. Thus, extent of lymphadenectomy necessary to accurately detect pN+ must be greater for short, less invasive, well-differentiated cancers than for longer, more invasive, poorly differentiated ones.
We recommend that number of positive nodes and number of resected nodes be reported separately and not confounded by conversion to the continuous variable “lymph node ratio.”11 Its use should be discouraged because it is a puzzling blend of cancer biology and surgical technique and offers no further information than revealed by its numerator and denominator.
The Literature
The associations of other cancer characteristics with pN+ are rarely investigated; most publications focus instead on associations with survival. Traditional statistical analysis has demonstrated the associations of T and N.1 Staging of esophageal cancer in the 7th edition of the AJCC manual added three non-anatomic cancer characteristics—cancer location, histologic grade, and histopathologic cell type—providing potentially new associations to examine.7 It was this effort and the statistical methods behind stage groupings4 that led us to reexamine associations with pN+.
The overall prevalence of positive lymph nodes in esophageal cancer patients was similar for both histopathologic cell types in 1,059 esophagectomy patients at a single institution.12 Cancer length correlated with pT/ypT, but its association with positive lymph nodes was not evaluated.13 In a study of 240 patients with esophageal squamous cell carcinoma, histologic grade was one of five variables univariably associated with positive lymph nodes; however, in multivariable analysis it did not add additional information.14 In a multi-institutional study, a larger number of positive lymph nodes predicted a higher likelihood of distant metastatic cancer15: The probability of systemic disease exceeded 50% when 3 or more positive nodes were present, and approached 100% when 8 or more were present. Only one study has examined the relationship of pN+ and number of lymph nodes resected.16 Sensitivity of classifying pN+ continued to improve up to 100 nodes resected; however, maximum increase of sensitivity occurred from 0 to 6 nodes, and over 90% sensitivity was reached at 12. Because no further associations were examined, composition of this study group could have influenced the resulting lymphadenectomy recommendations.
Strengths and Limitations
Strengths and limitations of the WECC database have previously been outlined in detail,2, 5 the most notable being that it represents advanced cancers and to a much lesser extent superficial cancers with their detailed subclassifications. This study is based on pathologic staging data rather than clinical staging data, which is necessary to establish the relationships described. However, adding length, cell type, and differentiation to depth of invasion1 improves transferability to clinical staging.
An inherent limitation of a data set such as WECC is lack of detailed information about the location of lymph nodes and variability of not only the surgical lymphadenectomy, but also the pathologic processing of the specimen. This could lead to both over- and underestimation of cancer characteristics. Extreme values may also be influential; inherent in Random Forest methodology is resampling, which mitigates against sampling extreme values, as does averaging over many trees (in this case, over 1,000) and multivariable modeling. Institutional and region-of-the-world clustering effects were generally small, but were taken into account by incorporating sites and region of the world into risk-adjusted estimates. Nonlinearities in the data and complex interactions among cancer variables that have been identified for esophageal cancer, a challenge for traditional statistical methods, are inherently accounted for by Random Forest methods. These are the primary reasons for choosing this methodology for WECC.
A strength of this study is that it is a large surgery-alone series that spans the spectrum of esophageal cancer characteristics, and this will likely never be repeated in the age of neoadjuvant therapy.
Therapeutic Implications
Treatment That Assumes pN Status
Accurate N classification is extremely important for therapeutic decisions and prognostication in esophageal cancer. Currently, the only accurate method is lymphadenectomy (pN). Although technology (cN) continues to improve, it is still less accurate than histologic examination of excised lymph nodes. Failure to accurately classify N not only has implications for therapy, but also for clinical trials that use cN for allocation of patients to different trial arms. This may lead to erroneous conclusions.
Endoscopic therapies are recommended when it is reasonable to assume pN0. Absence of lymph node metastases is most likely to be true for well-differentiated short cancers with minimal invasion, and also more likely for squamous cell carcinoma than adenocarcinoma. Strictly adhering to these observations will rarely result in endoscopic mucosal therapy of a pN+ cancer.
Conversely, neoadjuvant therapy typically is recommended when it is reasonable to assume pN+. Realizing the inaccuracies of clinical staging, a deeply invasive long, poorly differentiated cancer reported to be cN0 is likely to be pN+. The high likelihood of a clinical staging error in this patient should prompt the use of neoadjuvant therapy. Improvements in clinical staging of cN are necessary, as illustrated by these examples at the extremes of early and advanced esophageal cancers.
Clinical Implications
The aims of lymphadenectomy are twofold: 1) to achieve accurate staging and 2) to provide a possible therapeutic (survival) benefit with respect to extent of lymphadenectomy. These goals are conflicting. This study found that extent of lymphadenectomy required to accurately detect pN+ is greatest for early-stage cancers; in our previous study, extent of lymphadenectomy required to maximize survival benefit is greatest for advanced-stage cancers.17 Esophagectomy for deeply invasive, long, poorly differentiated (advanced-stage) cancers that are reported as pN0, but fewer than 20 nodes have been resected, are unlikely to actually be pN0 because the extent of lymphadenectomy is inadequate for both staging and a possible survival benefit. For superficial, short, well-differentiated (early-stage) cancers, one must balance the risk of extensive lymphadenectomy to accurately detect pN+ (60 nodes) and the benefit of lesser lymphadenectomy (10 nodes for pT1) to maximize 5-year survival.17 Although “the more one looks, the more one finds,” this must be tempered by high-risk associations with pN+.
Supplementary Material
Relative frequency that cancer is pN+ as a function of number of resected lymph nodes, stratified by histopathologic cell type, pT, and G (red=G1, green=G2, blue=G3). Dots represent raw frequency data. Key: adeno=adenocarcinoma; squam=squamous cell carcinoma.
Out-of-bag (OOB) predicted probability of pN+ cancer stratified by G, pT, pM, and histopathologic cell type (red=G1, green=G2, blue=G3). Key: adeno=adenocarcinoma; squam=squamous cell carcinoma.
Relative frequency of number of resected lymph nodes, presented as histograms of 5-node groups. These groups are stratified by histopathologic cell type, pT, and G (red=G1, green=G2, blue=G3). Key: adeno=adenocarcinoma; squam=squamous cell carcinoma.
Supplemental Appendix E1: Random Forest Methodology Details
Acknowledgments
NIH grant acknowledgment: This publication was made possible in part by the Clinical and Translational Science Collaborative of Cleveland, UL1TR000439 from the National Center for Advancing Translational Sciences (NCATS) component of the National Institutes of Health and NIH Roadmap for Medical Research. Its contents are solely the responsibility of the authors and do not necessarily represent the official views of the NIH.
Other sources of funding: The Gus P. Karos Registry Fund, the Daniel and Karen Lee Endowed Chair in Thoracic Surgery, held by Dr. Rice, and the Kenneth Gee and Paula Shaw, PhD, Chair in Heart Research, held by Dr. Blackstone.
The authors thank Tess Parry for editorial assistance and Brian Kohlbacher for graphic design help. Both are Cleveland Clinic employees.
Footnotes
Conflicts of interest: None declared
Contributor Information
Thomas W. Rice, Cleveland Clinic, Cleveland, Ohio, USA.
Hemant Ishwaran, University of Miami, Miami, Florida, USA.
Wayne L. Hofstetter, University of Texas MD Anderson Cancer Center, Houston, Texas, USA.
Paul H. Schipper, Oregon Health and Science Center, Portland, Oregon, USA.
Kenneth A. Kesler, Indiana University, Indianapolis, Indiana, USA.
Simon Law, Queen Mary Hospital, The University of Hong Kong.
Toni E.M.R. Lerut, University Hospital Leuven, Leuven, Belgium.
Chadrick E. Denlinger, Medical University of South Carolina, Charleston, South Carolina, USA.
Jarmo A. Salo, Helsinki University Hospital, Helsinki, Finland.
Walter J. Scott, Fox Chase Cancer Center, Philadelphia, Pennsylvania, USA.
Thomas J. Watson, University of Rochester, Rochester, New York, USA.
Mark S. Allen, Mayo Clinic, Rochester, Minnesota, USA.
Long-Qi Chen, West China Hospital of Sichuan University, Chengdu, Sichuan, China.
Valerie W. Rusch, Memorial Sloan-Kettering Cancer Center, USA, New York, New York, USA.
Robert J. Cerfolio, University of Alabama at Birmingham, Birmingham, Alabama, USA.
James D. Luketich, University of Pittsburgh School of Medicine, Pittsburgh, Pennsylvania, USA.
Andre Duranceau, University of Montreal, Montreal, Canada.
Gail E. Darling, Toronto General Hospital, Toronto, Canada.
Manuel Pera, Hospital Universitario del Mar, Institut Hospital del Mar d’Investigacions Mèdiques, Universitat Autònoma de Barcelona, Barcelona, Spain.
Carolyn Apperson-Hansen, Cleveland Clinic, Cleveland, Ohio, USA.
Eugene H. Blackstone, Cleveland Clinic, Cleveland, Ohio, USA.
References
- 1.Rice TW, Zuccaro G, Jr, Adelstein DJ, et al. Esophageal carcinoma: depth of tumor invasion is predictive of regional lymph node status. Ann Thorac Surg. 1998;65:787–92. doi: 10.1016/s0003-4975(97)01387-8. [DOI] [PubMed] [Google Scholar]
- 2.Rice TW, Rusch VW, Apperson-Hansen C, et al. Worldwide Esophageal Cancer Collaboration. Dis Esophagus. 2009;22:1–8. doi: 10.1111/j.1442-2050.2008.00901.x. [DOI] [PubMed] [Google Scholar]
- 3.Breiman L. Random forests. Machine Learning. 2001;45:5–32. [Google Scholar]
- 4.Ishwaran H, Blackstone EH, Apperson-Hansen C, et al. A novel approach to cancer staging: application to esophageal cancer. Biostatistics. 2009;10:603–20. doi: 10.1093/biostatistics/kxp016. [DOI] [PMC free article] [PubMed] [Google Scholar]
- 5.Rice TW, Rusch VW, Ishwaran H, et al. Cancer of the esophagus and esophagogastric junction: data-driven staging for the 7th edition of the American Joint Committee on Cancer/International Union Against Cancer Staging Manuals. Cancer. 2010;116:3763–73. doi: 10.1002/cncr.25146. [DOI] [PubMed] [Google Scholar]
- 6.Breiman L. Bagging predictors. Machine Learning. 1996;24:123–40. [Google Scholar]
- 7.Edge SB, Byrd DR, Compton CC, et al. American Joint Committee on Cancer Staging Manual. New York: Springer-Verlag; 2010. [Google Scholar]
- 8.Ishwaran H, Kogalur UB, Blackstone EH, et al. Random survival forests. Ann Appl Stat. 2008;2:841–60. [Google Scholar]
- 9.Ishwaran H, Kogalur UB, Gorodeski EZ, et al. High-dimensional variable selection for survival data. J Am Stat Assoc. 2010;105:205–17. [Google Scholar]
- 10.Ishwaran H, Kogalur UB. Random forests for survival, regression, and classification (RF-SRC) R package version 1.6.0. 2015 http://cran.r-project.org/web/packages/randomForestSRC/index.html.
- 11.Rice TW, Blackstone EH. Lymph node ratio: a confounded quotient. Ann Thorac Surg. 2013;96:744. doi: 10.1016/j.athoracsur.2013.03.102. [DOI] [PubMed] [Google Scholar]
- 12.Siewert JR, Stein HJ, Feith M, et al. Histologic tumor type is an independent prognostic parameter in esophageal cancer: lessons from more than 1,000 consecutive resections at a single center in the Western world. Ann Surg. 2001;234:360–7. doi: 10.1097/00000658-200109000-00010. discussion 68–9. [DOI] [PMC free article] [PubMed] [Google Scholar]
- 13.Bollschweiler E, Baldus SE, Schroder W, et al. Staging of esophageal carcinoma: length of tumor and number of involved regional lymph nodes. Are these independent prognostic factors? J Surg Oncol. 2006;94:355–63. doi: 10.1002/jso.20569. [DOI] [PubMed] [Google Scholar]
- 14.Tajima Y, Nakanishi Y, Ochiai A, et al. Histopathologic findings predicting lymph node metastasis and prognosis of patients with superficial esophageal carcinoma: analysis of 240 surgically resected tumors. Cancer. 2000;88:1285–93. [PubMed] [Google Scholar]
- 15.Peyre CG, Hagen JA, DeMeester SR, et al. Predicting systemic disease in patients with esophageal cancer after esophagectomy: a multinational study on the significance of the number of involved lymph nodes. Ann Surg. 2008;248:979–85. doi: 10.1097/SLA.0b013e3181904f3c. [DOI] [PubMed] [Google Scholar]
- 16.Dutkowski P, Hommel G, Bottger T, et al. How many lymph nodes are needed for an accurate pN classification in esophageal cancer? Evidence for a new threshold value. Hepatogastroenterology. 2002;49:176–80. [PubMed] [Google Scholar]
- 17.Rizk NP, Ishwaran H, Rice TW, et al. Optimum lymphadenectomy for esophageal cancer. Ann Surg. 2010;251:46–50. doi: 10.1097/SLA.0b013e3181b2f6ee. [DOI] [PubMed] [Google Scholar]
Associated Data
This section collects any data citations, data availability statements, or supplementary materials included in this article.
Supplementary Materials
Relative frequency that cancer is pN+ as a function of number of resected lymph nodes, stratified by histopathologic cell type, pT, and G (red=G1, green=G2, blue=G3). Dots represent raw frequency data. Key: adeno=adenocarcinoma; squam=squamous cell carcinoma.
Out-of-bag (OOB) predicted probability of pN+ cancer stratified by G, pT, pM, and histopathologic cell type (red=G1, green=G2, blue=G3). Key: adeno=adenocarcinoma; squam=squamous cell carcinoma.
Relative frequency of number of resected lymph nodes, presented as histograms of 5-node groups. These groups are stratified by histopathologic cell type, pT, and G (red=G1, green=G2, blue=G3). Key: adeno=adenocarcinoma; squam=squamous cell carcinoma.
Supplemental Appendix E1: Random Forest Methodology Details


