

Abstract
Background
HPV vaccination rates in the U.S. remain low and lag behind other recommended adolescent vaccines. Studies evaluating the association of geographic and area-level characteristics with HPV vaccination rates provide a valuable resource for public health planning
Method
We used the Rochester Epidemiology Project data linkage system to ascertain HPV vaccination rates between 2010 and 2015 in a 7-county region of southern MN. Geocoded individual patient data was spatially linked to socioeconomic data from the American Community Survey at the census block group level. Bayesian hierarchical logistic regression was used to model incident vaccination rates, adjusting for individual- and area-level sociodemographic characteristics, and geolocation. Geolocation was modelled as an approximated Gaussian field using a Stochastic Partial Differential Equations approach. All models were estimated using Integrated Nested Laplace Approximations.
Results
In adjusted models, increasing age and female sex were associated with increased HPV vaccination. Lower socioeconomic status was associated with decreased rates of initiation (adjusted odds ratio (AOR) (95% credible interval) = 0.90 (0.86, 0.95)), completion of the 2nd dose (AOR=0.88 (0.83, 0.93) and completion of the 3rd dose (AOR =0.85 (0.80, 0.92)). Geographic spatial analysis demonstrated increased odds of vaccination for the eastern regionand in the greater Rochester metropolitan area, showing significant spatial variation not explained by individual level characteristics and ACS block group level data.
Conclusion
HPV vaccination rates varied geographically, and by individual- and geographically-indexed sociodemographic characteristics.
Impact
Identifying geographic regions with low HPV vaccination rates can help target clinical and community efforts to improve vaccination rates.
Introduction
Despite the availability of safe and effective vaccines to prevent HPV-related cancers, a significant proportion of the eligible population remains unvaccinated. National rates of HPV vaccination remain low and lag behind other vaccinations recommended for adolescents (1). Data from the 2015 US National Immunization Survey (NIS-Teen) indicate only small gains in population coverage over prior years with 62.8% of females 13–17 years having received the 1st dose in the 3-dose series, and 41.9% having received 3 or more doses(1). In that same year, among males the same age, only 49.8 % had received the 1st dose and only 28.1% had received 3 or more doses (1).
A growing body of research has identified patient, parental, and health care provider characteristics that are associated with HPV vaccination(2). For example, differences in HPV vaccination initiation and completion rates have been noted by race and socioeconomic status (3–7). Data from the 2014 NIS-Teen reveal higher rates of the HPV vaccination among Hispanic adolescents compared with non-Hispanic white adolescents, and among adolescents living below the poverty level compared to adolescents living at or above the poverty level (1). NIS-Teen data also indicate higher HPV vaccine rates among non-Hispanic Black and American Indian/Alaska Native adolescents compared with non-Hispanic white adolescents (1). Health care provider recommendation, vaccination reminder/recall systems, and clinician knowledge of HPV vaccination are also associated with higher rates of vaccination (2).
The concept of place has always been considered an important factor in the study of epidemiology dating as far back as the 1800s with the discovery of the transmission of cholera by John Snow(8). The study of place effects on health has recently reemerged in the literature, with significant evidence of the impact that geographic variation has on disease and health related behavior(9). Social epidemiologists in particular have routinely used place for studies of socioeconomic status (SES) and health outcomes(10). With the use of more sophisticated geographic methods and multilevel modeling, researchers have elucidated important associations between SES, and the context of neighborhoods, leading to a deeper understanding of the causes of social stratification and health disparities(11). As more healthcare systems move toward population health management models, health services researchers have an opportunity to systematically link area-level data to electronic health records (EHR). Prior studies have used this approach to evaluate the impact of geographic or area-level characteristics on HPV vaccination rates (3–7,12,13). Identification of geographic variation in HPV vaccination and associated variation in SES can inform health systems and public health practitioners of disparities in health care delivery.
To inform local clinical and public health efforts, we examined the association of both individual and area-level characteristics measured at the census block group level with HPV vaccination rates derived from a population-based medical records data linkage system. Thus, the primary aim of our study was to identify whether individual- and carea-level sociodemographic and geographic variation in HPV vaccination rates exists and, if so, ascertain whether geographic variability in rates persists after controlling for sociodemographic characteristics.
Methods
We used the Rochester Epidemiology Project (REP) data linkage system to ascertain rates of HPV vaccination between 2010 and 2015 in a 7-county region of southern MN. The REP infrastructure, a data linkage system that captures virtually all healthcare utilization in Olmsted County MN since 1966, has recently expanded to a 27-county region of southern MN and western WI(14–16). The dates of healthcare visits are linked to address information, and this information has been used to define residency at any given point in time (REP Census)(16). We have compared the population counts obtained by the REP Census to the counts obtained by the US Census and found variability across the 27-county region. Specifically, population coverage in the REP compared to the U.S. Census counts varies from 21.4% in Brown County to 99.9% in Olmsted County. The following 7 Minnesota counties have sufficient coverage to ascertain population based estimates: Wabasha, Olmsted, Waseca, Steele, Freeborn, Dodge, and Mower (Figure 1); the lowest coverage rate in this 7-county region is 92.0% with an average coverage rate of 98.5 %.
Figure 1.
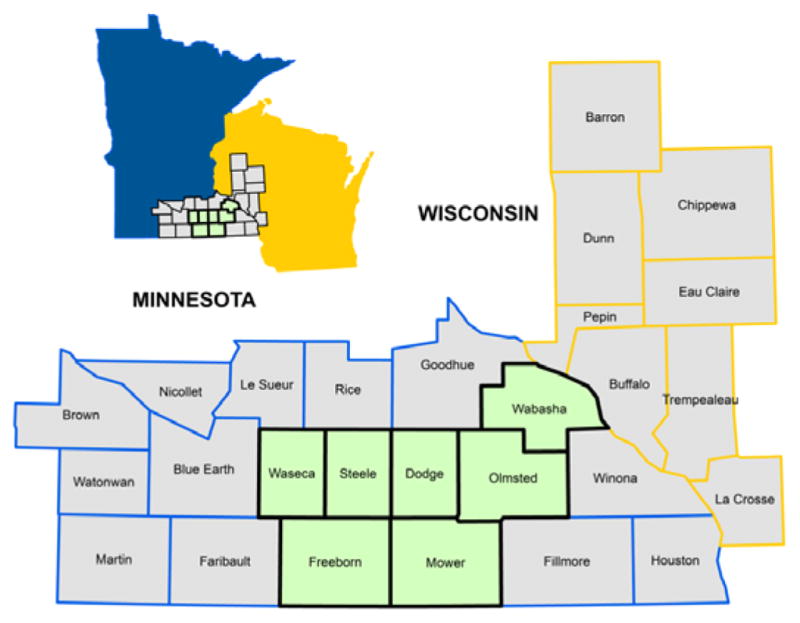
represents a visual display of the Minnesota and Wisconsin counties represented in the 27-county expanded REP region. The seven counties included in this study are shaded in green.
HPV vaccination data
We used REP computer programs to pull all current procedure terminology (CPT) codes corresponding to HPV vaccination (90649, 90650, and 90651) delivered prior to July 1, 2015 to children and adolescents ages 9 to 14 living in the 7-county region on January 1, 2015 (resident at any time in 2014). Data on HPV vaccinations at all sites was available from 2010–2015, therefore we limited our analysis to those who would have been ages 9–14 to ensure we were able to fully capture their vaccination history since teens older than 14 years may have initiated the vaccine prior to 2010. Vaccine series initiation was defined as having received at least one dose of the HPV vaccine by June 30, 2015. We also assessed receipt of two, three, or more doses of the HPV vaccine with appropriate spacing by June 30, 2015. Appropriate vaccine spacing was defined according to the ACIP recommendations that were in place during our study period wherein the second dose must be administered at least 24 days after the first dose and the third at least 12 weeks after the second dose, and at least 24 weeks after the first dose, using the ACIP approved minimal intervals allowing a 4-day grace period for each dose (17–19). Additional individual level data were also collected on age, sex, and race/ethnicity.
American Community Survey data
Each patient’s geolocation (latitude and longitude) was calculated by taking administrative address records and linking them to the TIGER/Line address range shapefile provided by the U.S Census(20). Geocoded patient data were then spatially joined to census block group allowing the linkage of individual patient records with publically-available data at the census block group level from the American Community Survey (ACS) (18). Using 5-year estimates from the 2014 ACS (2010–2014), we created geographic factors for each census block group in our region to capture area-level estimates of the following: (1) median household income in the past 12 months (in 2014 inflation-adjusted dollars), (2) proportion of population aged 25 and older with less than or equal to a high school degree (or equivalent), (3) proportion of population unemployed 16 years and over in the labor force (4) proportion of population on Medicaid/medical assistance, (5) proportion of population living below the poverty level in the past 12 months, (6) racial composition (proportion of non-white), and (7) block group population density.
Analysis
Descriptive results on individual level data were summarized with univariate statistics (mean and standard deviation for continuous variables; n and % for categorical variables). Census block group data (ACS) were summarized by presenting n and % of binary cutoffs based on national/state benchmarks. Rates for HPV vaccination were summarized at the individual and the area level. Area-level vaccination rates were estimated by dividing the number of individuals in each block group who received 1, 2, or 3 or more doses of the vaccination series by the study population residing in that block group. Completion rate was calculated as a percentage of total eligible population, not as a percentage of those who initiated, which is often reported. Area-level rates were aggregated by ACS data with benchmark cutoffs.
To assess the spatial variation, the association between neighborhood/area-level effects (block group ACS public data) and individual characteristics, we implemented a multilevel spatial logistic regression model consisting of fixed and random effects with Bayesian inference using Integrated Nested Laplace Approximation (INLA) (21–23). The outcome (1, 2 or 3 or more doses of the HPV vaccination series) was modelled as a binomial response (See Appendix for model and computational details). All geographic factors were transformed into census block group ranks and, for purposes of interpretation, modeled to assess the change in initiation and completion of the HPV vaccine series for each quartile increase in the measure. Median income was modeled on a decreasing scale (higher ranks correspond to lower median income) and population density was modeled on a decreasing scale (higher ranks correspond to lower population density). Exploratory factor analysis was used to summarize the six geographic factors. Principal component analysis, with promax rotation, identified two composite factors from the rank-based measures. The first factor corresponded to a set of variables associated with low SES: Low median income, high percent unemployment and high percent non-college education, high Medicaid insurance and high poverty. The second factor, which was marginally significant, was associated with low population density and high white race, and weakly associated with high non-college education. However, we found population density exhibited non-linear behavior; to account for this we categorized block-level population density as a binary variable according to the U.S. Census Bureau definition of urban as population density greater than 1000 people per square mile (urban) vs. the alternative (rural). We included this rural/urban variable and percent non-white individually in our final model rather than the second composite factor. To give a consistent interpretation the first factor was transformed and modeled into block group ranks and, modeled for each quartile increase in the measure. Point estimates of the marginal posterior distributions are presented as Odds Ratios (OR) with 95% Credible Intervals (CI)(24).
To visualize the residual spatial variation, the posterior means of the random effects of vaccination (1st, 2nd, or 3rd dose) were mapped. The random effects were transformed from the log-odds scale to the odds ratio scale and the maps are interpreted as estimates of the residual spatial variation in the odds of vaccination relative to the overall average odds of vaccination after adjusting for the individual level and block group level covariates. All analyses were performed using ArcGIS 10.1 (geocoding and geographic linkage), SAS 9.4 (data cleaning and management), and R version 3.2 (statistical analysis and figure creation). All INLA analyses were performed with the R-INLA package in R (version 0.0-1455098891). The analysis of existing clinical data through the REP and integration with ACS data was approved by the Mayo Clinic and Olmsted Medical Center IRBs.
Results
Geocoding yielded a 90.8% match rate resulting in a study population of 15,003 residents. Table 1 characterizes the population of children and adolescents ages 9–14 in our region using individual level data (n=15,003) derived from their linked electronic medical records, and Table 2 characterizes the public data at the block group level (n=251) from the ACS. The mean age of our population was 11.7 years; nearly half of the population (48.8%) was female; and the majority of the population (71.1%) was white. Nearly half (48.2%) of the block groups in our region were rural; and 22.7% of block groups had 15% or greater households with incomes below the federal poverty level (FPL).
Table 1.
Baseline data for individual-level characteristics
| Individual factors | Total | 1st Dose (Initiation) | 2nd Dose | 3rd Dose |
|---|---|---|---|---|
| Total N (%) | 15,003 | 4,066 (27.1%) | 2544 (17.0%) | 1524 (10.1%) |
| Age (Mean, SD) | 11.7 (1.3%) | 12.4 (1.12%) | 12.5 (1.08%) | 12.6 (1.04%) |
| Sex | ||||
| Female | 7315 (48.8%) | 2207 (54.3%) | 1452 (57.1%) | 895 (58.7%) |
| Males | 7688 (51.2%) | 1859 (45.7%) | 1092 (42.9%) | 629 (41.3%) |
| Race/ethnicity | ||||
| White | 10662 (71.1%) | 2925 (71.9%) | 1867 (73.4%) | 1140 (74.8%) |
| Black | 1046 (7.0%) | 319 (7.85%) | 176 (6.92%) | 93 (6.1%) |
| Asian | 632 (4.2%) | 199 (4.89%) | 127 (4.99%) | 88 (5.77%) |
| Hispanic | 1427 (9.5%) | 350 (8.61%) | 217 (8.53%) | 120 (7.87%) |
| Other/Unknown1 | 1236 (8.2%) | 273 (6.71%) | 157 (6.17%) | 83 (5.45%) |
Of the 1236 patients with other/unknown race 541 were missing race data
Table 2.
Baseline data for area-level characteristics (n=251 block groups)
| Block group level data | Total N (%) | 1st 3 (Initiation)1 Mean (SD) |
2nd Dose1 Mean (SD) |
3rd Dose1 Mean (SD) |
|---|---|---|---|---|
| Total | 251 | 24% (12%) | 15% (9%) | 9% (7%) |
| Median Income ≥ $57,210 | 126 (50.1%) | 27% (11%) | 17% (9%) | 11% (7%) |
| <$57,210 | 125 (49.9%) | 21% (12%) | 13% (8%) | 7% (6%) |
| Unemployed > 5% | 105 (41.8%) | 23% (12%) | 14% (9%) | 8% (7%) |
| ≤ 5% | 146 (58.2) | 25% (12%) | 15% (8%) | 9% (6%) |
| ≤ High school ≥ 30% | 181 (72.1%) | 21% (11%) | 12% (8%) | 7% (6%) |
| <30% | 70 (27.9%) | 34% (9%) | 22% (7%) | 14% (6%) |
| Uninsured ≥ 10% | 64 (25.5%) | 22% (12%) | 14% (9%) | 8% (7%) |
| <10% | 187 (74.5%) | 25% (12%) | 15% (9%) | 9% (7%) |
| Medicaid Insured ≥ 15% | 77 (37%) | 22% (12%) | 13% (9%) | 7% (7%) |
| <15% | 174 (63%) | 25% (12%) | 16% (9%) | 9% (7%) |
| Rural3Rural2 | 121 (48.2%) | 23% (12%) | 14% (9%) | 8% (7%) |
| Not rural | 130 (51.8%) | 25% (12%) | 15% (9%) | 9% (7%) |
| Household income below FPL ≥ 15% | 57 (22.7%) | 23% (13%) | 13% (9%) | 7% (7%) |
| <15% | 194 (77.3%) | 25% (12%) | 15% (9%) | 9% (7%) |
| Non-white > 20% | 36 (14.3%) | 28% (12%) | 17% (8%) | 9% (6%) |
| ≤ 20% | 215 (85.7%) | 24% (12%) | 14% (9%) | 9% (7%) |
Mean block group rate of HPV vaccination and its standard deviation
Population density < 1000 people per square mile
Overall, 4,066 (27.1%) of children and adolescents initiated the vaccine series, 2544 (17.0%) completed the 2nd dose, and 1,524 (10.1%) completed the 3rd dose (calculated as a percentage of the total population, not just those who initiated). There was variation at the block group level in vaccination rates across entire region (Figure 2). The strongest difference in block group vaccination rates across ACS data was found between groups with differences in education levels. Block groups with high levels of less than high school education had lower levels of initiation and completion of the vaccine compared to block groups with lower levels of less than high school education (initiation: 21% vs 34%; completion 7% vs. 14%) Across the 7 counties, the rate of 1 dose ranged from 11.7% to 33.8%, the rate of completion of the 2nd dose ranged from 6.3% to 22.0%, and the rate of completion of the 3rd dose ranged from 2.5% to 13.7%. Additionally, of the 2544 children who received a 2nd dose under the ACIP guidelines that were in place during the time of our study, 821 would have met the newly released criteria of being age 9–14 years and having at least 5 months between the first and second vaccination.
Figure 2.

displays the block group level rates of HPV vaccination across the 27-county expanded REP region. Rates for HPV vaccine initiation and completion represent the number of individuals in each block group who initiated or completed the vaccination series, divided by the corresponding population residing in each block group.
Results of the multilevel spatial logistic regression model to evaluate factors associated with HPV vaccine initiation are summarized in Table 3. In adjusted models, all of the individual level characteristics were associated with the vaccination rates. Specifically, increasing age and female sex were associated with increased vaccination rates, while Black race was associated with decreased rates of receiving the second and third dose. At the geographic level, many of the variables that indicate low SES were also associated with decreased rates of initiation and completion (Table 3). These variables were combined into a low SES composite score for use in the adjusted models. The lower SES composite score was associated with decreased odds of HPV initiation (adjusted OR (95% credible interval)) = 0.90 (0.86, 0.95), completion of the 2nd dose (AOR=0.88 (0.83, 0.93)) and completion of the 3rd dose (AOR = 0.85 (0.80, 0.92)). Finally, we found that living in a rural block group was associated with increased odds of initiation even after adjustment and that increasing % non-white population was associated with increased odds of vaccination (Table 3).
Table 3.
Multilevel spatial logistic regression models1 for HPV vaccination.
| 1st Dose (Initiation) | 2nd Dose | 3rd Dose | ||||
|---|---|---|---|---|---|---|
| Variable (reference level) | Unadjusted OR (95% CI) |
Adjusted OR (95% CI)2, 3 |
Unadjusted OR (95% CI) |
Adjusted OR (95% CI)2, 3 |
Unadjusted OR (95% CI) |
Adjusted OR (95% CI)2, 3 |
| Age | 1.89 (1.83, 1.96) | 1.89 (1.83, 1.96) | 1.90 (1.83, 1.98) | 1.91 (1.83, 1.98) | 2.00 (1.91, 2.11) | 2.00 (1.90, 2.11) |
| Sex (Male) | ||||||
| Female | 1.37 (1.27, 1.48) | 1.41 (1.30, 1.53) | 1.51 (1.39, 1.65) | 1.55 (1.42, 1.71) | 1.59 (1.42, 1.77) | 1.62 (1.44, 1.81) |
| Race/ethnicity (White) | ||||||
| Black | 0.99 (0.86, 1.15) | 1.01 (0.86, 1.19) | 0.81 (0.68, 0.96) | 0.82 (0.68, 0.99) | 0.70 (0.55, 0.88) | 0.71 (0.54, 0.90) |
| Asian | 0.93 (0.78, 1.12) | 0.94 (0.77, 1.13) | 0.91 (0.74, 1.12) | 0.91(0.73, 1.13) | 1.01 (0.79, 1.29) | 1.03 (0.78, 1.32) |
| Hispanic | 0.91 (0.79, 1.04) | 0.99 (0.86, 1.15) | 0.89 (0.76, 1.04) | 0.99 (0.83, 1.17) | 0.82 (0.67, 1.00) | 0.90 (0.73, 1.11) |
| Other/Unknown | 0.78 (0.67, 0.90) | 0.77 (0.66, 0.90) | 0.71 (0.59, 0.85) | 0.70 (0.58, 0.85) | 0.64 (0.50, 0.81) | 0.64 (0.50, 0.82) |
| Block level variables | ||||||
| Decreasing Median Income4 | 0.91 (0.88, 0.95) | - | 0.88 (0.84, 0.92) | - | 0.83 (0.79, 0.88) | - |
| % Unemployed4 | 0.99 (0.96, 1.03) | - | 1.00 (0.96, 0.92) | - | 1.00 (0.94, 1.06) | - |
| % with ≤ High school education4 | 0.89 (0.84, 0.93) | - | 0.86 (0.81, 0.90) | - | 0.81 (0.75,0.87) | - |
| % Uninsured4 | 0.93 (0.90, 0.97) | - | 0.93 (0.89, 0.97) | - | 0.92 (0.87, 0.98) | - |
| % Medicaid Insured4 | 0.95 (0.92, 0.99) | - | 0.92 (0.88, 0.96) | - | 0.90 (0.86, 0.95) | - |
| % with Household income in poverty4 | 0.96 (0.92, .99) | - | 0.93 (0.89, 0.97) | - | 0.90 (0.86, 0.95) | - |
| Low SES composite factor4 | 0.92 (0.89, 0.95) | 0.90 (0.86, 0.95) | 0.90 (0.86, 0.93) | 0.88 (0.83, 0.93) | 0.86 (0.81, 0.91) | 0.85 (0.80, 0.92) |
| Rural status (Urban) 5 | 1.15 (1.04, 1.27) | 1.12 (1.01, 1.24) | 1.17 (1.05, 1.30) | 1.11 (0.99, 1.24) | 1.21 (1.03, 1.40) | 1.14 (0.98, 1.32) |
| % Non-white4 | 1.01 (0.97, 1.06) | 1.09 (1.03, 1.15) | 1.02 (0.97, 1.08) | 1.13 (1.06, 1.20) | 1.02 (0.95, 1.10) | 1.14 (1.05, 1.24) |
Baysian spatial logistic model modeling log-odds of initiating the HPV vaccination series
Point estimates of the marginal posterior distribution, presented as odds ratios and 95% credible intervals
Adjusted for age, sex, race, low SES, rural status, and % non-white
Odds ratios represent the change in HPV vaccine initiation/completion for each quartile increase in the measure unless otherwise specified as a decreasing measure
Population density < 1000 people per square mile
Figure 3 displays the spatial variation of vaccination rates across the 7-county region, representing the odds of vaccination relative to the overall average odds of vaccination after adjustment for the individual level and block group level covariates. Residual spatial variation, beyond what was explained by the individual factors and ACS block group level factors, was observed. The increased odds of vaccination were observed for the eastern counties and clustered around larger cities, showing large spatial variation not explained by individual level characteristics and ACS block group level data.
Figure 3.

displays estimates from the posterior means of the random effects (ξi) of initiation and completion of the 2nd and 3rd dose of the HPV vaccine series. The random effects were transformed from the log-odds scale to the odds ratio scale and can be interpreted as an estimate of the spatial variation in the odds of initiation or completion relative to the overall average odds of initiation or completion even after adjusting for the individual level and block group level covariates.
Discussion
Using patient-level data geocode-matched to publically available data from the American Community Survey, we characterized HPV vaccination initiation and completion rates following a fixed cohort of adolescents eligible for the HPV vaccination and identified sociodemographic and geographic variation in incident vaccination rates. As expected, observed rates of incident vaccination among this eligible cohort were lower than national prevalence rates reported from NIS-Teen data (1). Additionally, the lower rates of vaccination observed in our cohort are likely a result of our focus on a slightly younger age group (9 to 14 years) compared to NIS-Teen (13 to 17 years).
Consistent with national estimates, we observed a greater likelihood of vaccination among females compared to males (1). The higher rates observed among females is not surprising, given that the HPV vaccine was initially recommended in 2007 for females with subsequent marketing to females. (25) The vaccine was not recommended to boys until the end of 2011. (25) Poor uptake among females and evolving science supporting the recommendation for males led to more recent marketing efforts emphasizing the cancer risks for males and promoting vaccination for males which may have an impact on uptake. (25) Research is encouraged to track trends in HPV vaccination by sex and to evaluate efforts to promote adoption of the vaccine by males.
We also observed a greater likelihood of vaccination among older compared to younger adolescents. This finding may be driven, at least in part, by our inclusion of 9 and 10 year olds in our analyses. Recommendations from the Advisory Committee on Immunization Practices for HPV vaccination include permissive language for offering the vaccine to children as young as 9 years of age (25). In prior research, we identified initiation and completion of the HPV vaccine among patients as young as 9 years of age in our region as well as a greater likelihood of on-time (by 13.5 years) and timely (by 15 years of age) HPV vaccine series completion among patients who initiated the series at a younger age (26). This research, coupled with evidence of superior immune response to the HPV vaccine in younger children (27–29), led to a clinical practice change in 2014 for much of the region; specifically, a recommendation was put forth within the clinical practices in our catchment region to offer the HPV vaccine starting at age 9. The Rochester region had been practicing routine initiation of the 3 dose series at 9 years of age since 2006. Thus, 9 and 10 year olds were included in analyses to ensure complete capture of the relevant population.
Lower vaccination rates were found in urban areas but we found that this was attenuated when other factors were taken into account. Although seemingly counterintuitive given the residual spatial variation and block group rates showing greater vaccination in the greater Rochester metropolitan area, two considerations are important to note: First, we found that in Olmsted county the highest rates of vaccination tended to be in the areas, although technically labeled as rural, were near city central whereas lower rates were observed in the city center. Second, areas of urban crowding were associated with lower SES as well. Given the population distribution of our region we were not able to effectively model a suburban type model based on population density alone, indicating that our rural variable contains elements of suburban and rural residents.
Contrary to recently published NIS-Teen data (1), we did not observe higher rates of vaccination among Hispanics and blacks in our population. In fact, we observed significantly lower rates of completion among blacks, compared to whites. Surprisingly, however, after adjusting for all individual and block level characteristics, block areas with higher percentages of non-white residents had higher HPV vaccination rates than areas with lower levels of non-white residents. This seeming contradiction in our area-level association was explained largely by the greater Rochester Metropolitan area. Adjusted for all other factors this area tended to have block groups with higher levels of non-white residents.
Examination of the block group level rates of vaccination and the modeled residual spatial random effect conveys large scale differences by geographic location in HPV vaccination. With the model, there was up to 3 times greater likelihood of vaccination in the Rochester metropolitan region radiating out to the more suburban and rural areas within the eastern half of the region. The western region however, which tended to have smaller and less racially and ethnically diverse populations, had lower initiation and completion rates.
In our geographic region we were able to uncover substantial regional variation in HPV vaccination that was not completely explained by data routinely collected in the electronic health record (EHR). In a recent report, the Institute of Medicine (IOM) stressed the importance of integrating social and behavioral information with data available through the EHR as a means to inform population health management efforts, identify more effective treatments for individuals, and link social factors to disease processes, access, utilization, and quality of life(30). Given the relative paucity of high quality self-reported data in the EHR, publically available geocoded data from the ACS could provide benefits to health care delivery systems through identification of populations at risk.
A unique contribution of our analysis to the existing literature is in our linkage and simultaneous examination of the impact of individual level variables collected through administrative data and area-level socioeconomic variables collected through large scale publically available survey data in a well-defined fixed cohort representative of the source population. This approach further underscores the importance of place in determining health outcomes. We found our composite, area-level measure of socioeconomic status to be significantly associated with vaccination, even after controlling for individual level variables known to be associated with vaccination. We observed that children and adolescents who lived in areas of low SES were less likely to get vaccinated. This finding is counter to recently published data from NIS-Teen data that revealed higher rates of HPV vaccine series completion among adolescents living below poverty compared to those living above poverty(13). Considerable variation in the association between HPV vaccination rates and socioeconomic status has been observed in prior research (3–7).
Several factors may influence observed associations between socioeconomic status and HPV vaccination, in particular, we found key differences centered on the measurement of SES and the geographic unit of analysis. There is also variation in how socioeconomic status is defined and measured across studies. In our study, we used a composite measure that included median income, percent unemployment, education, Medicaid insurance status and poverty metrics to capture overall socioeconomic status. Prior studies have examined some of these variables individually, but not as a composite measure, which may account for observed differences in our study and prior studies. Furthermore, while several prior studies use survey sampling methods to estimate the association between SES and prevalent HPV vaccination, we estimated HPV vaccination incidence in a well-defined fixed cohort representative of the source population using administrative data. In a recent analysis Boakye et al. found good concordance between parent self-report and provider records for HPV vaccination(7). However the effects of non-response bias, recall bias, length of time from vaccination until survey administration, survey mode and social desirability bias may still play a role in estimating HPV vaccination where the usage of administrative data minimizes this bias (7). Chao and colleagues conducted a study similar to our own in a Health Maintenance Organization population of females 9–26 and found a positive association between neighborhood income levels and rates of HPV vaccination(3).
Another factor that may influence the observed association between socioeconomic status and HPV vaccination is the unit of analysis or geographic area of analysis. A dramatic example of this comes from Pruitt and Schootman’s assessment of HPV vaccination prevalence at the county and state level using data from the Behavioral Risk Factor Surveillance System and the U.S. Census; this analysis simultaneously revealed a negative association between poverty and vaccination rates at the state level and a positive association between poverty and vaccination rates at the county level. The authors suggest that greater allocation of resources at the county-level through the vaccine for children program may have led to the association between greater poverty and higher vaccination rates observed at the county level. This phenomena for differences observed when conducting analyses at varying geographic levels is referred to as the modifiable area unit problem (MAUP) wherein inferences drawn from data aggregated to a particular geographic region may change when the same data is aggregated to different geographic parameters (31). Krieger and colleagues have demonstrated MAUP by comparing data of SES and mortality aggregated at the block group, tract and the zip code(32). Specifically, they demonstrated that SES gradients were detected at the block group and tract where zip code measures for several outcomes detected no association or associations counter to what was found at the lower levels of geography.
Identification of area-level factors associated with lower levels of HPV vaccination can inform efforts to target community and clinical interventions to improve access in areas characterized by greater need. Furthermore by using spatial models we were able to find areas of relatively lower odds of HPV vaccination not explained by demographics or measured area-level factors. Understanding the spatial distribution of vaccination patterns can inform efforts to target clinical sites within the geographic regions with lower than average odds of HPV vaccination to better understand current practices and opportunities for clinical and community interventions.
Potential limitations of our study include lack of self-reported data on education, employment status, and insurance status, which tend not to be easily accessible in administrative data of primary care clinics. However, we were able to pull census block group level data to capture additional measures of socioeconomic status as measures of “place” to ascertain the impact of place on health-related behavior. This conceptualization guards against the risk of ecological fallacy. We were not able to capture access to primary care at either the area-level or individual level. However, public data available from the Behavioral Risk Factor Surveillance System suggest that at least among adults, there is limited variability in access to primary care across the 7 counties. Furthermore, to be included in the REP each person must have a medical record in at least one of the participating clinical entities, ensuring some basic level of access across our cohort.
Data on HPV vaccinations at all sites was only available from 2010–2015; therefore we limited our analysis to those ages 9 to 14 years to ensure adequate capture of their vaccination history. Furthermore, the majority of clinical practices contributing data to our analyses began offering the HPV vaccine to boys in May 2010; however, consistent recommendations for routine vaccination for eligible males across all participating sites did not occur until after the publication of the ACIP recommendation in December of 2011. However, we adjust for sex in our analysis and follow a fixed cohort of eligible patients over time so the impact of differences in recommendations for males and females on our results is likely minimal.
Patients whose addresses could not be geocoded but whose county was known (n=1529, 9.25%) were more likely to not to reside in the most populous county of Olmsted and the greater Rochester Metropolitan area. However, as a sensitivity analysis we modeled whether a patient was more likely to get vaccinated given they were geocoded adjusting for their county of residence; we found no differences in HPV vaccination indicating that geocoded patients were representative of other patients residing in the same county. Lastly, estimates from the ACS have sampling error and therefore our quartile measures are subject to measurement error. However we ran a Monte Carlo simulation (results not shown) on the ACS variables assessing the association with HPV (initiation or completion). We found very little variation (typically 3–5%) across the simulations with no differences in statistical significance, making our method of ranking and factor analysis robust to measurement error.
Despite these limitations, this work will inform our efforts to improve HPV vaccination rates by identifying populations and geographic areas in our health system’s catchment region that may benefit most from implementation of evidence based strategies to increase acceptance of HPV vaccine by parents and adolescents, improve access to the HPV vaccine, and reduce missed clinical opportunities to vaccinate. This work also serves as model for other health systems to evaluate delivery of preventive services, such as HPV vaccination, within the geographic regions that they serve. By assessing geographic variation, identifying disparities, and considering the neighborhood context in which patients develop disease and utilize healthcare, health systems can conceptualize and implement interventions with a multilevel approach for better individual and population health.
Supplementary Material
Footnotes
The authors declare no potential conflicts of interest.
References
- 1.Reagan-Steiner S, Yankey D, Jeyarajah J, Elam-Evans LD, Curtis CR, MacNeil J, et al. National, regional, state, and selected local area vaccination coverage among adolescents Aged 13–17 Years - United States, 2015. MMWR Morb Mortal Wkly Rep. 2016;65(33):850–8. doi: 10.15585/mmwr.mm6533a4. [DOI] [PubMed] [Google Scholar]
- 2.Holman DM, Benard V, Roland KB, Watson M, Liddon N, Stokley S. Barriers to human papillomavirus vaccination among US adolescents: a systematic review of the literature. JAMA pediatrics. 2014;168(1):76–82. doi: 10.1001/jamapediatrics.2013.2752. [DOI] [PMC free article] [PubMed] [Google Scholar]
- 3.Chao C, Velicer C, Slezak JM, Jacobsen SJ. Correlates for human papillomavirus vaccination of adolescent girls and young women in a managed care organization. Am J Epidemiol. 2010;171(3):357–67. doi: 10.1093/aje/kwp365. [DOI] [PMC free article] [PubMed] [Google Scholar]
- 4.Tsui J, Gee GC, Rodriguez HP, Kominski GF, Glenn BA, Singhal R, et al. Exploring the role of neighborhood socio-demographic factors on HPV vaccine initiation among low-income, ethnic minority girls. J Immigr Minor Health. 2013;15(4):732–40. doi: 10.1007/s10903-012-9736-x. [DOI] [PMC free article] [PubMed] [Google Scholar]
- 5.Pruitt SL, Schootman M. Geographic disparity, area poverty, and human papillomavirus vaccination. Am J Prev Med. 2010;38(5):525–33. doi: 10.1016/j.amepre.2010.01.018. [DOI] [PMC free article] [PubMed] [Google Scholar]
- 6.Trogdon JG, Ahn T. Geospatial patterns in human papillomavirus vaccination uptake: evidence from uninsured and publicly insured children in North Carolina. Cancer Epidemiol Biomarkers Prev. 2015;24(3):595–602. doi: 10.1158/1055-9965.EPI-14-1231. [DOI] [PubMed] [Google Scholar]
- 7.Adjei Boakye E, Tobo BB, Osazuwa-Peters N, Mohammed KA, Geneus CJ, Schootman M. A Comparison of parent- and rovider-reported human papillomavirus vaccination of adolescents. Am J Prev Med. 2016 doi: 10.1016/j.amepre.2016.10.016.. Epub date: Nov 24, 2016. [DOI] [PubMed] [Google Scholar]
- 8.Snow J. On the mode of communication of cholera. London, United Kingdom: John Churchill; 1855. [Google Scholar]
- 9.Auchincloss AH, Gebreab SY, Mair C, Diez Roux AV. A review of spatial methods in epidemiology, 2000–2010. Annu Rev Public Health. 2012;33:107–22. doi: 10.1146/annurev-publhealth-031811-124655. [DOI] [PMC free article] [PubMed] [Google Scholar]
- 10.Krieger N. Historical roots of social epidemiology: socioeconomic gradients in health and contextual analysis. Int J Epidemiol. 2001;30(4):899–900. doi: 10.1093/ije/30.4.899. [DOI] [PubMed] [Google Scholar]
- 11.Roux AVD, Mair C. Neighborhoods and health. Biology of disadvantage: Socioeconomic status and health. 2010;1186:125–45. doi: 10.1111/j.1749-6632.2009.05333.x. [DOI] [Google Scholar]
- 12.Nelson EJ, Hughes J, Oakes JM, Pankow JS, Kulasingam SL. Geospatial patterns of human papillomavirus vaccine uptake in Minnesota. Bmj Open. 2015;5(8) doi: 10.1136/bmjopen-2015-008617.. ARTN e008617. [DOI] [PMC free article] [PubMed] [Google Scholar]
- 13.Henry KA, Stroup AM, Warner EL, Kepka D. Geographic factors and human papillomavirus (HPV) vaccination Initiation among adolescent girls in the United States. Cancer Epidemiol Biomarkers Prev. 2016;25(2):309–17. doi: 10.1158/1055-9965.Epi-15-0658. [DOI] [PMC free article] [PubMed] [Google Scholar]
- 14.Kurland LT, Molgaard CA. The patient record in epidemiology. Sci Am. 1981;245(4):54–63. doi: 10.1038/scientificamerican1081-54. [DOI] [PubMed] [Google Scholar]
- 15.Melton LJ., 3rd History of the Rochester Epidemiology Project. Mayo Clin Pro. 1996;71(3):266–74. doi: 10.4065/71.3.266. [DOI] [PubMed] [Google Scholar]
- 16.St Sauver JL, Grossardt BR, Yawn BP, Meton LJ, Rocca WA. Using a medical records-linkage system to enumerate a dynamic population over time: The Rochester Epidemiology Project. Am J Epidemiol. 2011;173(9):1059–68. doi: 10.1093/aje/kwq482. [DOI] [PMC free article] [PubMed] [Google Scholar]
- 17.Centers for Disease Control and Prevention (CDC) FDA licensure of bivalent human papillomavirus vaccine (HPV2, Cervarix) for use in females and updated HPV vaccination recommendations from the Advisory Committee on Immunization Practices (ACIP) MMWR Morb Mortal Wkly Rep. 2010;59(20):626–9. [PubMed] [Google Scholar]
- 18.Reagan-Steiner S, Yankey D, Jeyarajah J, Elam-Evans LD, Singleton JA, Curtis CR, et al. National, regional, state, and selected local area vaccination coverage among adolescents aged 13–17 Years--United States, 2014. MMWR Morb Mortal Wkly Rep. 2015;64(29):784–92. doi: 10.15585/mmwr.mm6429a3. [DOI] [PMC free article] [PubMed] [Google Scholar]
- 19.Centers for Disease Control and Prevention (CDC) Human papillomavirus vaccination coverage among adolescent girls, 2007–2012, and postlicensure vaccine safety monitoring, 2006–2013 - United States. MMWR Morb Mortal Wkly Rep. 2013;62(29):591–5. [PMC free article] [PubMed] [Google Scholar]
- 20.United States Census Bureau. [Accessed 2015 January 21];TIGER/Line shapefiles 2014 technical documentation. 2014 Jan 21; < https://www2.census.gov/geo/pdfs/maps-data/data/tiger/tgrshp2014/TGRSHP2014_TechDoc.pdf/
- 21.Lindgren F, Rue H. Bayesian Spatial Modelling with R-INLA. Journal of Statistical Software. 2015;63(19):1–25. http://dx.doi.org/10.18637/jss.v063.i19. [Google Scholar]
- 22.Lindgren F, Rue H, Lindstrom J. An explicit link between Gaussian fields and Gaussian Markov random fields: the SPDE approach (with discussion) Journal of the Royal Statistical Society. 2011;73(4):423–98. [Google Scholar]
- 23.Rue H, Martino S, Chopin N. Approximate Bayesian inference for latent Gaussian models using integrated nested Laplace approximations (with discussion) Journal of the Royal Statistical Society. 2009;71(2):319–92. [Google Scholar]
- 24.Bolstad WM. Introduction to Bayesian Statistics Hoboken. New Jersey: John Wiley & Sons, Inc; [Google Scholar]
- 25.Markowitz LE, Dunne EF, Saraiya M, Lawson HW, Chesson H, Unger ER. Quadrivalent human papillomavirus vaccine: recommendations of the Advisory Committee on Immunization Practices (ACIP) MMWR Recommendations and reports : Morb Mortal Wkly Rep Recommendations and reports / Centers for Disease Control. 2007;56(RR-2):1–24. [PubMed] [Google Scholar]
- 26.St Sauver JL, Rutten LJ, Ebbert JO, Jacobson DJ, McGree ME, Jacobson RM. Younger age at initiation of the human papillomavirus (HPV) vaccination series is associated with higher rates of on-time completion. Prev Med. 2016;89:327–33. doi: 10.1016/j.ypmed.2016.02.039. [DOI] [PMC free article] [PubMed] [Google Scholar]
- 27.Block SL, Nolan T, Sattler C, Barr E, Giacoletti KE, Marchant CD, et al. Comparison of the immunogenicity and reactogenicity of a prophylactic quadrivalent human papillomavirus (types 6, 11, 16, and 18) L1 virus-like particle vaccine in male and female adolescents and young adult women. Pediatrics. 2006;118(5):2135–45. doi: 10.1542/peds.2006-0461. [DOI] [PubMed] [Google Scholar]
- 28.Giuliano AR, Lazcano-Ponce E, Villa L, Nolan T, Marchant C, Radley D, et al. Impact of baseline covariates on the immunogenicity of a quadrivalent (types 6, 11, 16, and 18) human papillomavirus virus-like-particle vaccine. J Infect Dis. 2007;196(8):1153–62. doi: 10.1086/521679. [DOI] [PubMed] [Google Scholar]
- 29.Reisinger KS, Block SL, Lazcano-Ponce E, Samakoses R, Esser MT, Erick J, et al. Safety and persistent immunogenicity of a quadrivalent human papillomavirus types 6, 11, 16, 18 L1 virus-like particle vaccine in preadolescents and adolescents: a randomized controlled trial. Pediatr Infect Dis J. 2007;26(3):201–9. doi: 10.1097/01.inf.0000253970.29190.5a. [DOI] [PubMed] [Google Scholar]
- 30.Institute of Medicine (IOM) Capturing social and behavioral domains and measures in electronic health records: Phase 2. Washington, DC: The National Academies Press; 2014. [PubMed] [Google Scholar]
- 31.Waller LA, Gotway CA. Applied Spatial Statistics for Public Health Data. Hoboken, New Jersey: Joan Wiley & Sons, Inc; 2004. [Google Scholar]
- 32.Krieger N, Chen JT, Waterman PD, Soobader MJ, Subramanian SV, Carson R. Geocoding and monitoring of US socioeconomic inequalities in mortality and cancer incidence: does the choice of area-based measure and geographic level matter?: the Public Health Disparities Geocoding Project. Am J Epidemiol. 2002;156(5):471–82. doi: 10.1093/aje/kwf068. [DOI] [PubMed] [Google Scholar]
Associated Data
This section collects any data citations, data availability statements, or supplementary materials included in this article.