

Supplemental Digital Content is available in the text
Keywords: artificial neural network, classification, electroencephalography, meditation experience, support vector machine
Abstract
To quantitate the meditation experience is a subjective and complex issue because it is confounded by many factors such as emotional state, method of meditation, and personal physical condition. In this study, we propose a strategy with a cross-sectional analysis to evaluate the meditation experience with 2 artificial intelligence techniques: artificial neural network and support vector machine. Within this analysis system, 3 features of the electroencephalography alpha spectrum and variant normalizing scaling are manipulated as the evaluating variables for the detection of accuracy. Thereafter, by modulating the sliding window (the period of the analyzed data) and shifting interval of the window (the time interval to shift the analyzed data), the effect of immediate analysis for the 2 methods is compared. This analysis system is performed on 3 meditation groups, categorizing their meditation experiences in 10-year intervals from novice to junior and to senior. After an exhausted calculation and cross-validation across all variables, the high accuracy rate >98% is achievable under the criterion of 0.5-minute sliding window and 2 seconds shifting interval for both methods. In a word, the minimum analyzable data length is 0.5 minute and the minimum recognizable temporal resolution is 2 seconds in the decision of meditative classification. Our proposed classifier of the meditation experience promotes a rapid evaluation system to distinguish meditation experience and a beneficial utilization of artificial techniques for the big-data analysis.
1. Introduction
In recent decades, meditation has been considered to be an effective alternative and complementary therapy to alleviate stress-associated psychosomatic syndromes.[1] Substantial evidence has revealed that meditation can be used for counteracting cardiovascular diseases,[2] stress,[3,4] and mental illness.[4]
Researchers have consistently demonstrated that long-term meditation can improve emotional stability,[5–9] meaning that a person is able to remain stable and calm even under stressful circumstances. To assess the effect of meditation on improving health, electroencephalography (EEG) is used to record the electric-physiological responses of the brain. Previous studies showed that responses to emotional loads between experienced and novice meditators are different according to the results of psychological questionnaires[10] and EEG examination.[5,7,8] In addition, to further understand what the effect is between different meditation experiences, the psychological and physiological responses are tested.[7] Recently, the artificial intelligence system has successfully evaluated the meditation experience through the responses to emotional loads.[8] However, to assess the responses to emotional loads, the participants need to take time and be examined by numerous emotional stimuli. If the performance of meditation can be assessed immediately from the mental response during meditation, it would be helpful to observe the induced mind state of meditation and to give the level of meditating depth as a feedback to the participants. By doing so, an evaluator of meditation experience provides information for anyone who wants to practice meditation to improve mental health.
To understand how and where such practice may alter the mind state and induce a lasting after-effect, recognizing possible variations in EEG response to meditation practice is important because the transitional state of mind is dynamic even though a man is at rest.[11] The performance between experienced meditator and novice is varying by the type of meditation tradition, the year of practice, and alpha blocking effect. During concentrative meditation, a type of meditation approach, recent studies point out that novice and experienced meditators show similar reactions, that is, domination of low-frequency components in EEG.[7] However, although previous studies have demonstrated that meditators increase alpha power (the power of alpha spectrum) during meditation,[11–13] the influence of alpha power would be distorted by the action of eye movement (open and closed), the so-called alpha blocking effect. The alpha blocking effect would affect the proportion of alpha frequency in the EEG while closed eyes of the subjects are open. Even if the interaction between alpha power and alpha blocking effect exists, as some research indicates, it is advocated that experienced meditators produce lower mean frequency[14,15] and less alpha blocking effect from their EEG measurement.[16,17] To distinguish the effect of these factors, spectrum features and alpha blocking effect should take into account the process of data analysis. Of alpha spectrum features, the mean power of alpha band, the amplitude of the main peak, and the frequency of the main peak are regarded as usefully associated features, indicating differences between meditation experiences.[14–17] Given this consideration of features, it would be possible to improve the speed of analysis of the meditation experience if the features of experienced meditators can be prominently extracted from meditative state.
Next to a better understanding of meditation characteristics, a suitable system for data analysis will facilitate the accuracy of feature recognition. To date, artificial intelligence techniques with a supervised learning model have commonly been used as classifiers to categorize a big-data or to analyze a mix-up data with a nonlinear combination. These classifiers include decision trees,[18]k-nearest neighbor method,[19] artificial neural networks (ANNs),[20–22] and support vector machine (SVM).[23–25] Of these methods, ANN and SVM are commonly used to solve either linear or nonlinear discrimination between groups. SVM decides a linear boundary between groups through finding a maximum margin on a hyper plane where the data are projected based on their features. Some studies indicate that SVM is suitable for solving more complex problems, for example, the data with multiple dimensions, such as the development of brain-computer interfaces with word communication,[25] fast filtering of compound libraries in bioinformation analysis,[23] and emotional assessment of healthcare applications.[24] However, the performance of SVM is influenced by normalization of scale among variables with the varying range of values because the distribution of multivariate data in the feature space is not proportionally scaled and it might restrict the recognizable distance between variables.[26] As for another self-learning technique, ANN creates a computational environment which is plausible to the neural system of human beings. By repeatedly adjusting the connection weight among neurons with a set of training data, which is the key procedure in ANN structure, the ANN will build up a suitable network for classifying information at the output node for the testing data. ANN is comprehensively applied to medical science for cancer diagnosis by feature recognition, image registration by tracking markers among different modalities, and neural behavior simulation by simulating the connectivity and function at special areas of the brain.[20–22]
Although the mechanism of meditation effect on neurological changes is implicit, studies about change of mind state and lasting after-effect are emerging via neuroelectric and neuroimging method. In our previous studies, the descriptive characteristics of meditation were tested with statistic comparison[7] and the after-effect of meditation was also evaluated with the emotional picture stimulation.[3] Therefore, in this study, we are eager to promote a discriminating system for effectively classifying the expertise level of meditators. To provide a system with rapid analysis, we applied SVM and ANN to the classification of meditation experience and tested some specific factors, including the characters of EEG response and operating parameters of the classifier. To identify the meditation experience, features of meditation are extracted from the alpha band (8–12 Hz) of the analyzed EEG spectrum. Three features of the spectrum are pinpointed: mean power of alpha band (M), the amplitude of the main peak (P), and frequency of the main peak (F). In addition, considering the alpha blocking effect, both open-eyed and close-eyed conditions are considered to be baseline references. Afterward, SVM and ANN are applied to these featured datasets individually and finalize the conclusion about the classification of meditation. As far as we know, this study is the first one to touch on the prompt evaluation of meditation experience and to take multiple features into account in an analysis system at the same time.
2. Materials and methods
2.1. Participants
The study is approved by an institutional review board of Kaohsiung Medical University Chung-Ho Memorial Hospital (Protocol Number: KMUH-IRB-980185). All participants were informed about the ethics statement and signed an informed consent before entering this study.
Thirty participants were invited to join this experiment and their information is shown in Table 1. The participants were divided into the following 3 groups. Ten participants with 10 to 30 years of experience (mean = 17.10 years, standard deviation [SD] = 8.80 years) of Tibetan Nyingmapa meditation were grouped as a senior experienced group and marked as “S.” Another 10 meditators with 1 to 7 years of experience (mean = 6.00 years, SD = 4.47 years) of the same meditation approach were grouped as a junior experienced group and marked as “J.” All meditators were recruited from an association of Tibetan Nyingmapa (Tibetan Nyingmapa Kathok Buddhist Organization, Tainan, Taiwan).The novice group, marked “N,” includes the remaining 10 participants with no experience in any kind of meditation, which was recruited in the community. As shown in Table 1, it was indicated that the significant difference is in the experience of meditation (F2,27 = 23.2, P < 0.05) but not in age (F2,27 = 0.7, P = 0.5). To maintain the meditation state, all participants were asked to use a focused breathing method by counting 1 to 4 silently at the speed of 1 second, alternatively during inhaling and exhaling. The meditation of focused breathing is the most common and basic form of concentrative meditation.[12,27] The novice participants were trained to perform focused breathing and practice the skill for 2 hours before the experiment day. The participants are all free from any disease that could cause autonomic nerve system dysfunction, including cardiac, pulmonary, metabolic, and any other applicable disease. In addition, all of them are medication-free and none are habitual drinkers or smokers. They were asked not to consume caffeine or alcoholic beverages for 12 hours and not to exercise 24 hours before the experiment, and they are also asked to refrain from eating and drinking anything for at least 3 hours before the experiment.
Table 1.
Demographic information of participants.

2.2. Physiological signal acquisition
EEG signals are acquired from 6 electrode placements (i.e., F3, F4, C3, C4, O1, and O2, according to the standard 10–20 system) and 2 reference electrodes are attached to the earlobes (i.e., A1, A2) (Fig. 1A). These areas are adopted from other reviewed studies,[11] which indicated that higher response to meditation is detected around these areas. The impedance of each electrode is constrained <10 kΩ. EEG data are recorded by the Nicolet Clinical EEG acquiring system with a 250-Hz sampling rate. The artifacts, including the influence of an eye blink, body movements, and power line, are eliminated before further analyzing EEG signals. Slow wave artifacts caused by body movement and eye blinking are filtered by digital high-pass filter with cutoff frequency at 4 Hz.[28,29] Subsequently, signals are filtered by a digital band-pass filter (4–70 Hz), and a digital notch filter is applied at 60 Hz to remove external noise caused by power line output.
Figure 1.
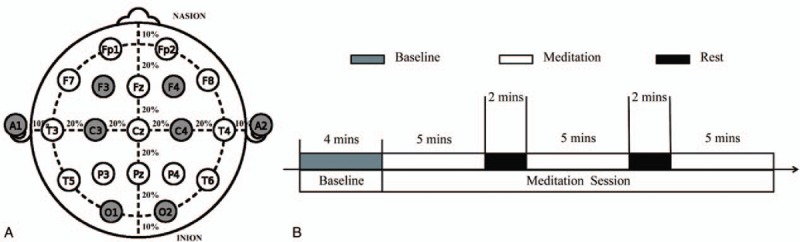
The experimental setting. (A) Electroencephalography signals are acquired at 6 areas through electrode leads while participant proceeds the assigned tasks. (B) The assigned tasks include 3 parts in the experiment. In “Baseline,” the ongoing activity is acquired by a counterbalanced random order of open-eyed and close-eyed movement for 4 cycles. In the “Meditation” session, the participants are asked to practice a focused breathing approach, and stay in a conscious state in the “Rest” session.
2.3. Experiment protocol
The experimental procedure is composed of initial baseline and meditation sessions, as shown in Figure 1B. The initial baseline session consists of four 60-second blocks of ongoing activity with a counterbalanced random sequential of 30-second open-eyed and 30-second close-eyed movements in each block. In the meditation session, the participants are asked to practice meditation (focused breathing method) for 5 minutes, 3 times with 2-minute rest between each meditation period after the baseline session and informed the instructor through speaker before each transition of trial. During the experimental process, EEG signals of participants are measured.
2.4. Data preprocessing
To understand how the factors affect the immediacy of the evaluation, this study accents the effect of factor selection on the accuracy of classification of meditation experience. After artifact is removed and filtered from raw EEG data, these data were segmented in pieces by moving a window size (wsize, the interval size of the analyzed data) subsequently by a step size of shifting interval (sint). The data within window size calculated the spectrum information and then dynamically moved to next window along with a step of shifting interval. The decision of window size and shifting interval masters the speed of calculation and accuracy of classification in an analysis system. Ideally, a small wsize and long sint are appropriate to create an environment of prompt analysis wherein a short responsive time and high accuracy are approached. However, these 2 parameters are always dependent on the characteristics of data. For multivariate data, the bigger size of window might add the information of analyzed data, but might compensate the details because feature's calculation is usually presented through data averaging. Besides, shorter shifting interval would decently present the tendency of data during the process, but it might take more computation time because of more segments of datasets. Therefore, for the first trial in this new analysis system, we adjusted these 2 parameters in a sequence of combination. Five different window sizes (0.5, 1, 1.5, 2, 2.5 minutes) and 5 different shifting intervals (2, 4, 8, 16, 30 seconds) were used on the data of meditation to test the performance of the classifiers (25 wsize-and-sint combinations in total). Afterward, for each combination, the averaged spectrum for a specific session (i.e., rest or meditation) is calculated, and this spectrum is used to determine features of extraction for analysis system.
2.5. Feature extraction
The frequency band of interest is analyzed in the zone of alpha spectrum (8–12 Hz) suggested by past studies,[7,11–13] which illustrated that alpha power of meditators was increased during meditation. In the process of meditating, more alpha power and lower mean frequency were observed in the experienced meditators than in the novice meditators. Therefore, indices of spectrum, mean power (M), amplitude of the main peak (P), and frequency of the main peak (F) in alpha band are nominated to be analyzed features.
Moreover, considering the effect of alpha blocking on alpha spectrum,[16,17] both open-eyed and close-eyed periods were considered to be reference conditions for calculating the changed alpha power. Hence, the indices of spectrum were obtained from a changed alpha spectrum for each reference condition. Taking one subject's spectrum as an example (Fig. 2), the indices of spectrum, M, P, and F are identified from the changed spectrums compared with the open-eyed condition. This power of spectrum was obtained from the EEG signal after fast Fourier transforms under one of the above wsize-and-sint conditions (0.5 minute wsize and 2 second sint).
Figure 2.

The demonstration of spectrum features. The spectrum features, amplitude of main peak (P), frequency of main peak (F), and mean power of alpha band (M) are demonstrated by the changed spectrums compared to the basic open-eyed condition from 1 participant.
In summary, each channel was given 6 features (3 indices of spectrum × 2 baseline conditions), so there were 36 features (3 indices of spectrum × 2 baseline conditions × 6 channels) in total as input features for each wsize-and-sint combination.
2.6. Feature scaling
To correct the characteristic variation among different types of feature, scaling the values of features is needed. For example, the original numerical range of mean power (M) and amplitude of the main peak (P) is from 0 to 1000, whereas the frequency range of main peak (F) is from 8 to 12. Considering the influence of feature scaling on the performance of classifiers, especially for SVM technique, 3 different scaling modifications are tested: the raw data (R), the data normalized to unit length (N1), and the data normalized to the range of [0,10] (N10).
2.7. ANN structure
The multilayer feed-forward neural networks were used to classify the meditation experience level from the EEG responses while the subject is in meditation. Thirty-six input datasets (3 indices of the spectrum × 2 baseline conditions × 6 channels) and 3 output categories (Ŝ, Ĵ, and οN) were set in ANN, whereas the data were normalized in a specific scaling. The multilayer feed-forward neural networks are built by the neural network toolbox in MATrix LABoratory, The MathWorks, Inc.
In ANN, the number of hidden nodes in the hidden layer is decided by the principal component analysis (PCA). Herein, we apply PCA for the assessment of data deviation because overestimated or underestimated number of node affects the coefficient balance between layers. A proper assessment of node number can reserve enough data information from input layer and thus facilitates the convergence of classification in the output layer. Figure S1 (Supplemental Digital Content 1) illustrates the distribution of Eigen value, and the sum of the first 5 Eigen values contains almost all data capacity (>99%). Hence, the 5 hidden nodes chosen in the hidden layer are proper to interpret the variety of data during classifying meditation experience.
Besides, for the training of network learning, the scaled conjugate gradient algorithm (SCG algorithm) is utilized.[30] This algorithm used the second-order approximation as the schema of network learning and that helps decrease phenomena of local minimal and avoiding time consuming line-search per learning iteration. The activation function of the hidden and output layers is a soft max function (an extension of normalized exponential function), which transforms the output value of each node between 0 and 1. The output of the ANN was determined on the basis of the maximum probability after the data went through the nodes. If the input data were extracted from the senior experienced meditators (S), the desired value was set as [1 0 0] and the data will be assigned to a group Ŝ. If the input data were extracted from the junior experienced meditators (J), the desired value was set as [0 1 0] and the data will be assigned to a group Ĵ. If the input data were extracted from the novice participants (N), the desired value was set as [0 0 1] and the data will be assigned to group οN.
To examine the performance of ANN on the meditation experience, the datasets were divided into a training set and a testing set. The training sets randomly selected 70% of the participants from the data pool, and the remaining 30% were for the testing set. These training data were set to go through the training procedure every time by SCG learning process. The neural network stops training when a minimum error is <0.0001 or maximum iterative number is >20000. To evaluate the reproducibility of classification, an average outcome of 100 repeated runs is summarized by accuracy rate (in percentage) and confusion matrix (a contingency table of classes between actual class and predicted class) in the “Result” part.
2.8. SVM
SVM attempts to decide a functional margin to group data by transforming the input data onto a higher-dimensional space where the separation of 2 class sets can be achieved by a linear separation.[31] When the 36 features are entered into SVM, the SVM algorithm will find the largest distance between the decided hyperplane and the edge of the data. This circumstance implies that if the margin is larger, the generalization error of the classifier will be less unbiased. Thus, SVM can make an identifying region to classify the data.
During the procedure of SVM,[2] a set of instance-label pairs (xi,yi), i = 1,…,l is assumed, where xi∊ℜ is the input data, l is the number of data items, and yi∊(1,-1) denotes the class label of xi. To decide the hyperplane, the SVM has to solve the following optimization problem to minimize the generalization error of the classifier, as shown in Eq. (1).
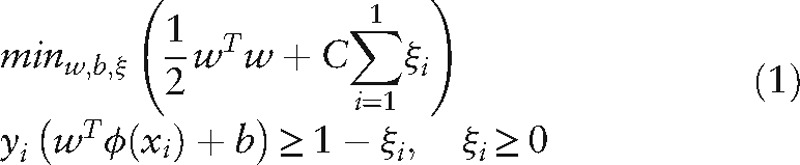 |
Where w is a vector orthogonal to the hyperplane <w,b>; C refers to the penalty factor (C> 0), and ξi and b refer to the error terms. Here, xi is mapped into a higher-dimensional space through the transfer function (ϕ) where xi is possible to assign to a group by a linear separation in a transformed feature space. ϕ is constructed in the kernel function, K(xi,xj) ≡ϕ(xi)Tϕ(xj). Of several common-used kernel functions, radial basis function (RBF), K(xi,xj) ≡exp(-γ‖xi-xj‖2), γ > 0, shows better accuracy rate especially in the nonlinear problem. In this study, 3 kinds of kernel functions were tested, and the results indicated that the RBF obtains the highest classification accuracy in our data. Therefore, the RBF is selected for the presentation in results.
The performance of SVM depends on the kernel's parameters, γ, and penalty factor C. The penalty factor C and kernel parameter γ are set using a grid search with cross-validation. Various pairs of (C,γ) values are tested, in which C is searched from 2–2 to 22 and γ is searched from 2–5 to 2–1. According to the Table-S1 (Supplemental Digital Content 2, http://links.lww.com/MD/B644), the one with the best validation accuracy rate is picked, namely (C, γ) = (21, 2–4) in an extreme case of the wsize-and-sint combination, 2.5-minute wsize and 2-second sint.
A strategy to solve a multiclass classification problem is the one-against-one method, which gives good results.[32] This method builds k(k-1)/2 machines, and each of the machines is trained to determine 2 different classes of total k classes. After the processing of each machine, a conjoint outcome is concluded with k classes. Similar to ANN, 100 repeated runs are performed to evaluate the reproducibility of classification. In this study, the algorithm adapted from the LIBSVM library implements the one-against-one strategy to classify the 3 types of meditator.
3. Results
The performances of the classifiers, ANN and SVM, are illustrated with different feature scalings (N10, N1 and Raw) at first and further explored the characteristics of feature types (channels and indices of the spectrum) under a given scaling condition. All results are demonstrated with the accuracy rate in total 25 wsize-and-sint combinations.
3.1. Influence of feature scaling
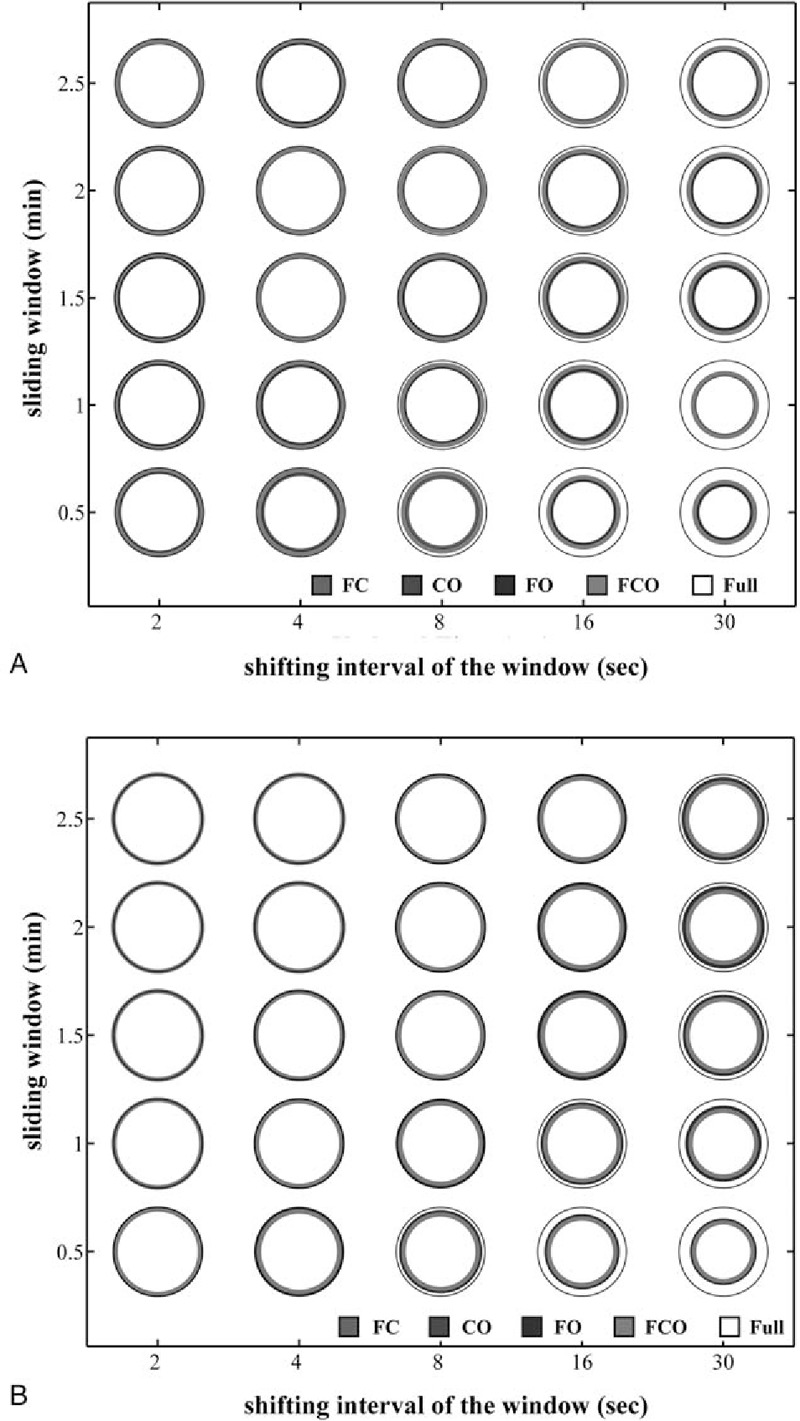
The influence of feature scaling on the performance of classifiers is tested by normalizing raw data into different scaling ranges (N10, N1, and Raw). Here, bubble plot is used to demonstrate the performance of accuracy rate for each discussed factors. All presented rings are in gray, referring to a specific scaling range, and the radius of the circle is subjected to the accuracy rate in percentage. A “Full” ring which indicates 100% full-score of accuracy rate is set as the reference. Figure 3A indicates that ANN is less affected by scaling ranges of data, and thus the 3 rings of accuracy rate with variant scaling in this analysis system are close to one another (the accuracy rate ranges from 80% to 99%). However, in the SVM case, the results show 3 rings deviate from each other in Figure 3B, which implies that SVM is highly sensitive to the numerical range of data. The accuracy rate of SVM drops to 30% (in average) under the raw data situation, and it increases from 72% to 98% when the data are normalized from N1 to N10. The best performance of classifiers is observed at N10, the accuracy rate ranging from 80% to 99% across 25 combinations. Although this phenomenon does not mean that larger the scaling range of data the higher the accuracy rate would gain from SVM, it does express a fact that SVM's performance is affected by scaling of data. Given the fluctuation of accuracy rate among scaling ranges, SVM had better be harnessed in the proper scaling range. To understand the derivation among different feature type, the following result is discussed under the data normalized in N10.
Figure 3.

The presentation of accuracy rate for different scaling criteria. The different scaling criteria are shown in circles of different colors for (A) artificial neural network and (B) support vector machine, presented with accuracy rate. Within each graph, different levels of normalization scaling are demonstrated in N10 (in light gray area), N1 (in dark gray area), and Raw (in black area). Here, 100% of accuracy rate is denoted as “Full” with a dark line.
3.2. Influence of spatial location and spectrum features
The spatial location of measurement, EEG channels (F3, F4, C3, C4, O1, O2), and indices of the spectrum (M, P, and F) are 2 important factors in the performance of classification because they would affect the stability of system computation because of the characteristics of input variables associated with meditation experience.[11–17] The below result of the accuracy rate as to each feature type is presented under N10 condition.
3.3. Differentiation in the channel location
Each channel acquires the local electronic signals of the brain area around the electrode (about 2–3 cm in radius). The influence of location on the performance of classifiers is assessed with 4 subareas, including frontal-middle part of the brain (F3, F4, C3, C4); middle-occipital part of the brain (C3, C4, O1, O2); frontal-occipital part of the brain (F3, F4, O1, O2); and all central parts of the brain (F3, F4, C3, C4, O1, O2). The accuracy rate of ANN ranges from 80% to 97% across the first 3 channel situations and the accuracy rate reaches the maximum value (99%) when all channels are used in the last case. A consistent variation among subarea selections is 2% on average across all wsize-and-sint combinations as shown in Figure 4A. This phenomenon manifests that signals vary from different brain areas in which the accuracy rate is being affected but not a lot. As for SVM, the accuracy rate ranges from 83% to 99% of these 4 subarea selections. As demonstrated in Figure 4B, the results show consistent accuracy rates in SVM among channel selections across 25 wsize-and-sint combinations. This outcome implies that ANN and SVM might not be affected by the electrode locations, or at least for these 6 areas. Again, to objectively assess the deviation among indices of the spectrum, all channel data are used for the following evaluation.
Figure 4.
The presentation of accuracy rate for variant spatial areas under N10 scaling. The spatial location of detected area is shown in circles for (A) artificial neural network and (B) support vector machine, presented with accuracy rate. Within each graph, different combinations of electroencephalography channels are demonstrated in FC combination in light gray area (referring to F3,F4,C3,C4), CO combination in dark gray area (referring to C3,C4,O1,O2), FO combination in black area (referring to F3,F4,O1,O2) and FCO combination in extra-light gray area (referring to all channels, F3, F4, C3, C4, O1, O2). Here, 100% of accuracy rate is denoted as “Full” with a dark line.
3.4. Selection in the indices of spectrum
Given the influence of spectrum on the performance of classifiers, 3 combinations of indices of the spectrum are considered. The first combination uses only the mean power of alpha band (M). The second one is the combination of amplitude and frequency of the main peak (referred to “PF”), and the third one covers all indices of the spectrum (denoted “MPF”). In ANN (seen in Fig. 5A)), the accuracy rate ranges from 93% to 98% using only “M” across all 25 wsize-and-sint combinations, from 88% to 97% for “PF,” and in the last situation from 83% to 99% using all indices of the spectrum (MPF). As for SVM (shown in Fig. 5B), the range of accuracy rate is from 95% to 100% using only “M” across all 25 period-and-time combinations, from 96% to 99% for “PF,” and from 81% to 99% using all indices of the spectrum (MPF). To further depict the variation of accuracy rate among indices of the spectrum, a profile across wsizes at 2-secind sint is shown in Figure 5C and D for ANN and SVM, respectively. From the result, ANN expresses larger impact on the selection of spectral features while the sint is shortened to 2 seconds. Under such circumstances, selecting all indices of the spectrum would compensate this fluctuation of the signal. On the contrary, SVM seems inert to the change of indicators and maintains the accuracy rate >97% in a case of short sint (2 seconds in this demonstration). It has been noted that ANN gains higher accuracy with increasing signal features. However, more indicators might narrow down the decision margin in SVM, and create bias in the boundary between the groups.
Figure 5.

The presentation of accuracy rate for varying features of alpha spectrum under N10 scaling. The effect of spectrum feature is shown in circles for (A) artificial neural network and (B) support vector machine and their profiles of 2-sec sint across wsize are presented in (c) and (d) respectively, presented with accuracy rate. Within each graph, different combinations of spectrum indicator are demonstrated with mean power in alpha band (M) (in light gray area), combination of amplitude of main peak (P) and frequency of main peak (F) (in dark gray area), and combination of whole spectrum indictors (in black area). Here, 100% of accuracy rate is denoted as “Full” with thin dark line.
3.5. Influence of wsize-and-sint combinations
According to Figures 3–5, if the wsize is longer and the sint is shorter, then there would be a higher accuracy rate. For a further dissection among 25 period-and-time combinations, normalized data (in N10) with all channels and all spectral indices are analyzed by ANN and the accuracy rate is presented in Table 2A. In this table, the accuracy rate decreases from 98.02% to 82.66% across a series of sint (from 2 to 30 seconds), which is fixed at 0.5-min wsize, and for other wsizes the decrease tendency is very similar. However, the accuracy rate decreases from 98.02% to 97.47% across a series of wsize s, while whereas sint is fixed at 2 seconds and similar outcomes happen in other sints. Of these values, the highest statistics (99.05% ± 1.49%) happened at the combination of 2-second sint and 1.5-minute wsize.
Table 2.
The performance of accuracy rate in 2 methods under N10 scaling. The detail of accuracy rate across whole combinations of wsize and sint is presented for (A) ANN with all spectrum features and channels in the calculation and (B) SVM with mean power of alpha and channels in the calculation. Here, the highlighted area shows the best combination where the highest accuracy rate is performed.

However, a detailed list for the same normalized data (in N10) with all channels and only the “M” indicator of the spectrum is presented for SVM in Table 2(B). We only select the “M” indicator as the demonstration here because the “M” indicator gained a highest accuracy rate in Figure 5D. A similar tendency is shown as the outcome in Table 2(A). However, the possibility of a 100% accuracy rate is frequent in the SVM analysis system. Thereafter, the highest accuracy rate (100% ± 0%) happened at updating times less than 8 seconds and at wsize s >1.5 minutes.
3.6. Statistical testing between groups
Given the conditional analysis of the variant features, we obtained a temporal resolution at the combination of 2-second sint and 1.5-minute wsize for immediate analysis on meditation experience. Therefore, the all-in-all comparison of the 36 features (2 levels of baseline correction for eye open-and-close, 3 levels of indicators of the spectrum, and 6 levels of EEG channels) can be tested individually under N10 scaling. One-way analysis of variance analysis is used to check the differences between groups for each feature following the post-hoc analysis with 2-sample t test. The histogram distributions and the testing outcome with P value were presented in Fig-S2 (Supplemental Digital Content 3) and Table 3. All P values are shown with corrected value after multiple comparisons. Our results manifest some remarks for EEG channel in the occipital area, the feature of the amplitude, and the baseline correction based on the close-eyed signals.
Table 3.
Statistical test for 36 features between groups with 1-way analysis of variance under N10 scaling.

3.7. The evaluation of classifiers
In 100 runs, histograms present the predicting accuracy rate of meditation experience (S, J, and N groups) of ANN and SVM and they also illustrate the deviations when data are normalized under N10, N1, or raw condition. In Figure 6, all histograms are compared under the situation of a combination of 1.5-minute wsize and 2-second sint, which was suggested in Table 2. In this figure, it pragmatically manifests the advantages and weaknesses between 2 classifiers. ANN illustrates high accuracy rates consistently across groups and different normalization conditions. Of course, it also exposes its intrinsic weakness about the erroneous prediction caused by local minimum calculation (happening in 2 or 3 events in 100 runs). Compared to ANN, SVM expresses a full prediction rate after data are normalized in N10. However, SVM still needs to choose a proper scaling range or otherwise its intrinsic disadvantage would ruin the predicting accuracy rate as shown in the Fig. 6E and F. Again, this figure supports the result in Figure 3 wherein the performance of SVM is severely affected by scaling of normalization.
Figure 6.

The evaluation of system stability. The histogram of accuracy rate in 100 runs is presented for artificial neural network (ANN) (in the left column) and support vector machine (SVM) (in the right column) for 3 meditation groups (S in black, J in gray, and N in white) in different scaling situations. All results are demonstrated while the data are acquired at the combination of 1.5-minute wsize and 2-second sint and are scaled in different normalized levels at N10 (A and B in the first row), N1 (C and D in the second row), and raw (E and F in the last row). X-axis denotes that the accuracy level of group prediction for each run and y-axis means the runs located at the same level of accuracy.
Furthermore, a summary of confusion matrix from the N10 result of ANN is presented to see the performance in groups in Table 4. Higher than 98% of the true-positive rate is achieved for each group's classification in 100 runs and <0.8% of false-positive rate is detected for misclassification, that is, 0.57% and 0.45% of the senior experienced meditators are assigned to junior and novice groups, respectively; 0.32% and 0.33% of junior experienced meditators are assigned to senior and novice groups, respectively; 0.77% and 0.40% of novice meditators are assigned to senior and junior groups, respectively. Owing to a full prediction of classification for SVM under the situation of 1.5-minute wsize and 2-second sint, the results of SVM are omitted. In brief, SVM shows 100% of the true-positive rate and 0% of false-positive rate at classification under such a specific circumstance.
Table 4.
The confusion matrix of group classification for ANN method.

4. Discussion
The technique of machine-based classifier has emerged comprehensively in past decades, especially for the analysis of big data or complex nonlinear problems.[20–25] However, to our knowledge, we did not find other publications mentioning the associated issue about the instant categorizing analysis of the meditation experience. In this study, ANN and SVM were applied to develop a classification system regarding meditation experience through analyzing the participant's EEG response, which is acquired while the participant practices meditation. The inferred outcome shows that the meditation experience can be successfully classified according to the features extracted from the changed alpha spectrum at the meditating state.
Undoubtedly, any analytic system has its own limitation, which might be constrained by data type or amount of variability. There is no comprehensive method that can solve all situations in classifying groups. In our previous research,[7] the statistical information on physiological responses is integrated into distinguishing the difference between groups while participants are tested with both emotional stimuli and meditation. Furthermore, automatic classifiers of meditation experience are utilized to verify the characteristics of a meditator through analyzing physiological responses under emotional stimuli.[8] Although the outcomes illustrate consistent finding across our studies, the discrimination of the meditation experience is not easily decided based on a linear classifier such as classification and regression tree (CART) or a supervised learning method such as SVM.[8] It is common to indicate that the performance of SVM is highly related to the type of feature owing to scaling or unit difference. As shown in the Figure 3B and Figure 6F, because variant units and scaling among frequency, amplitude, and power of spectrum polarize the distribution of data, they cause missclassification up to 60% on average for SVM. Yet, after a proper normalization of scaling (normalizing scaling between 1 and 10 in this study), the accuracy rate is rised to 100% among groups. The reason may be that a proper normalization makes distribution of variables more analyzable and expands the dynamic range of analysis according to the statistics. In the kernel function of SVM, the formula of RBF reflects that the parameter γ is similar to the term of 1/(2σ2) in a Gaussian distribution. Therefore, when γ is set at 2–4 which is decided from the best optimization of C and γ in Table-S1, http://links.lww.com/MD/B644, the value of σ is about 3. When the data are normalized in N10, the distribution of the data will cover the range of ± 2σ in which the data provide enough dynamics for the system to distinguish groups within 95% confidence interval. On the contrary, when data are normalized in N1, the dynamics will narrow down to the range of ± 0.2σ and this severely decreases the accuracy of classification. The same drawback is commonplace in other kernel functions in the SVM method.[33] It is noted that the choice of kernel function depends on the type of data. Therefore, using SVM might need more trials in a different data format.
Although ANN reveals a minimum effect with scaling, the error of local minimum cannot be avoided. To compensate this shortness, changing of ANN structure and adjustment of data scaling are possible approaches to solve the current problem. A multiple-layer hidden might provide a possibility of jumping out of a local minimum through a calculation of “exclusive OR” gate. However, multi-layer ANN cannot root out this shortness.[34] All in all, this confusing problem is essentially embedded in the ANN method.[35] Fortunately, ANN has a stable performance after repeated calculations, regardless of data type or scaling among variables. In this study, the adjustment of data scaling does not affect the performance of ANN in different scaling from the results in Figure 4A and the local minimum problem has nothing to do with combinations of wsize and sint as shown in Table 2. The frequency of the misclassification caused by the local minimum problem only occurs 2 to 3 times in 100 runs and only affects 1% to 2% of the accuracy rate.
Besides, to achieve rapid analysis, 2 adjustable factors, wsize and sint, affect the capacity of meditation signal and rapidity of analysis. Ideally, shorter wsize and longer sint are generally used to meet the need of immediate analysis. When the wsize is extended, the characteristic of meditation, calmness of mind, would be extracted from alpha responses. Therefore, the accuracy rate of the classifiers is improved by the extensive wsize, but the load of calculation is time-consuming. However, the sint directly influences the size of data pools. Indeed, longer sint provides acceleration of the calculation process, but it might erroneously miss the significant information during meditation. On the contrary, shorter sin covers whole details as meditation proceeds, but it might considerably increase the load of calculation. Hence, a trade-off between immediate analysis and capacity of meditation trait is commonly considered in the EEG signal processing.
According to the psychological and physiological effect of meditation trait,[11] identifying meditation experience is the main concern.[36–38] The classifier built with a proper size is more suitable to justify the meditation experience. Besides taking the wsize into account to decide the meditative state rapidly, precise sint is helpful to assure the quality of estimation.[1,3–5,7,8] Therefore, a wsize about 1.5 minutes and sint about 2 seconds leads to practically acceptable reasoning for instant analysis in our observation.
Currently, the mechanism of how and where the meditative practice may alter the mind state and induce a lasting effect in brain is still an open question. However, as mentioned in the “Introduction,” meditation traditions have become a current popular trend of improving psychological and physiological health.[11] More and more studies illustrate the benefits of meditation increase as the year of meditation experience grows.[5,6,9,10] Experienced meditators are able to release stress and improve emotional stability in mental health, and relieve autonomic nervous system stress.[7] Similarly, some researches focus on the comparison between ≥2 groups of meditators; however, the class identification of the meditation experience traditionally depends on the oral response of participant's self-announcement.[1,9] Of course, the findings from the physiological EEG detection and a systemized classifier support the fact that mental health is highly related to the depth of meditation.[4,5,7,8,10–13,15] Nevertheless, a solution has not been inferred that how many meditative-associated characters or which styles of meditative practice are enough to enhance the differences between the levels of meditation effect.[39] Of the great variety of meditation techniques, few techniques were focused on categorizing the different meditation traditions.[40,41] Therefore, signal processing of characteristics should be added to this field of study for a better understanding about the characteristics of meditation. Besides, further investigations are required to represent the relationship between meditation practices and neuroelectrophysiological changes.[39] In this study, although ANN and SVM provide a sensitive technique to identify the meditation experience in presenting meditators, other types of meditation practice (compassion meditation for example)[42] still challenge the performance of the classifier. For example, variant physiological responses are induced by different meditation practice types, so it is not guaranteed that ANN and SVM can work well in other cases.
In summary, this study made the first effort to utilize artificial-based classifiers, ANN and SVM, in the analysis of meditation experience. Several factors are still to be concerned. The first one is the targeting signal of meditation, including the alpha spectrum of EEG, alpha blocking effect, and other confounders. This might affect ANN's performance by 5% to 10% because of local minimum influence. The second is the scaling among variables which may ruin SVM's performance by 50% to 60%. The third one is about the operating efficiency of the system decided by the computation and accuracy of performance. Regarding to these concerns, several meditation-associated features, including the subarea of the channel and indices of the spectrum, are extracted according to the changed alpha spectrum during the analysis process. Given the considerations above, a prompt analysis system for classifying meditation experience can be confirmed by the combination of wsize-and-sint. These findings will attribute to our future work, a systematic regression model integrating all considerable factors, on quantitation of meditative profits.
Acknowledgments
The authors are especially indebted to the staff of the Sleep Disorders Center at the affiliated Chung-Ho Memorial Hospital for their support of this study. The authors also thank the Tibetan NyingmapaKathok Organization for supplying the participants for our study.
Supplementary Material
Footnotes
Abbreviations: Ĵ = junior experienced group in prediction,  = novice group in prediction, Ŝ = senior experienced group in prediction , ANN = artificial neural network, CART = classification and regression tree, EEG = electroencephalography, F = frequency of the main peak, J = junior experienced group, M = mean power, N = novice group, N1 = data normalized to unit length, N10 = data normalized to the range of [0,10], P = amplitude of the main peak, PCA = principal component analysis, R = raw data, S = senior experienced group, SCG algorithm = Scaled Conjugate Gradient algorithm, sint = shifting interval, SVM = support vector machine, wsize = window size.
Submit to Medicine as a Research Article.
Y-H.L. and S.C-J.C. contributed equally to this work.
Supplemental Digital Content is available for this Article.
This work was supported by the Ministry of Science and Technology of Taiwan under grants NSC 100–2221-E-006–160 and NSC 102–2314-B-037-072.
The authors report no conflicts of interest.
References
- [1].Ortner CN, Kilner SJ, Zelazo PD. Mindfulness meditation and reduced emotional interference on a cognitive task. Motiv Emot 2007;31:271–83. [Google Scholar]
- [2].Kaushik RM, Kaushik R, Mahajan SK, et al. Effects of mental relaxation and slow breathing in essential hypertension. Complement Ther Med 2006;14:120–6. [DOI] [PubMed] [Google Scholar]
- [3].Lane JD, Seskevich JE, Pieper CF. Brief meditation training can improve perceived stress and negative mood. Altern Ther Health M 2007;13:38–44. [PubMed] [Google Scholar]
- [4].Travis F, Haaga DA, Hagelin J, et al. Effects of transcendental meditation practice on brain functioning and stress reactivity in college students. Int J Psychophysiol 2009;71:170–6. [DOI] [PubMed] [Google Scholar]
- [5].Aftanas L, Golosheykin S. Impact of regular meditation practice on EEG activity at rest and during evoked negative emotions. Int J Neurosci 2005;115:893–909. [DOI] [PubMed] [Google Scholar]
- [6].Arch JJ, Craske MG. Mechanisms of mindfulness: emotion regulation following a focused breathing induction. Behav Res Ther 2006;44:1849–58. [DOI] [PubMed] [Google Scholar]
- [7].Lee YH, Shiah YJ, Chen SC, et al. Improved emotional stability in experienced meditators with concentrative meditation based on electroencephalography and heart rate variability. J Altern Complement Med 2015;21:31–9. [DOI] [PubMed] [Google Scholar]
- [8].Lee Y-H, Chen SC-J, Shiah Y-J, et al. Support-vector-machine-based meditation experience evaluation using electroencephalography signals. J Med Biol Eng 2014;34:589–97. [Google Scholar]
- [9].Lutz A, Brefczynski-Lewis J, Johnstone T, et al. Regulation of the neural circuitry of emotion by compassion meditation: effects of meditative expertise. Plos One 2008;3.3. [DOI] [PMC free article] [PubMed] [Google Scholar]
- [10].Schmidtke JI, Heller W. Personality, affect and EEG: predicting patterns of regional brain activity related to extraversion and neuroticism. Personality and Individual Differences 2004;36:717–32. [Google Scholar]
- [11].Cahn BR, Polich J. Meditation states and traits: EEG, ERP, and neuroimaging studies. Psychol Bull 2006;132:180–211. [DOI] [PubMed] [Google Scholar]
- [12].Takahashi T, Murata T, Hamada T, et al. Changes in EEG and autonomic nervous activity during meditation and their association with personality traits. Int J Psychophysiol 2005;55:199–207. [DOI] [PubMed] [Google Scholar]
- [13].Travis F, Wallace RK. Autonomic and EEG patterns during eyes-closed rest and transcendental meditation (TM) practice: the basis for a neural model of TM practice. Conscious Cogn 1999;8:302–18. [DOI] [PubMed] [Google Scholar]
- [14].Aftanas LI, Golocheikine SA. Human anterior and frontal midline theta and lower alpha reflect emotionally positive state and internalized attention: high-resolution EEG investigation of meditation. Neurosci Lett 2001;310:57–60. [DOI] [PubMed] [Google Scholar]
- [15].Stigsby B, Rodenberg JC, Moth HB. Electroencephalographic findings during mantra meditation (transcendental meditation)—a controlled, quantitative study of experienced meditators. Electroen Clin Neuro 1981;51:434–42. [DOI] [PubMed] [Google Scholar]
- [16].Random House Publishing Group, Goleman D. Destructive emotions: a scientific dialogue with the Dalai Lama. First edition2008. [Google Scholar]
- [17].Heide FJ. Psychophysiological responsiveness to auditory stimulation during transcendental meditation. Psychophysiology 1986;23:71–5. [DOI] [PubMed] [Google Scholar]
- [18].Quinlan JR. Induction of decision trees. Machine learning 1986;1:81–106. [Google Scholar]
- [19].Arya S, Mount DM, Netanyahu NS, et al. An optimal algorithm for approximate nearest neighbor searching in fixed dimensions. J Acm 1998;45:891–923. [Google Scholar]
- [20].Jiang J, Trundle P, Ren J. Medical image analysis with artificial neural networks. Comput Med Imag Grap 2010;34:617–31. [DOI] [PubMed] [Google Scholar]
- [21].Khan J, Wei JS, Ringner M, et al. Classification and diagnostic prediction of cancers using gene expression profiling and artificial neural networks. Nat Med 2001;7:673–9. [DOI] [PMC free article] [PubMed] [Google Scholar]
- [22].Patel JL, Goyal RK. Applications of artificial neural networks in medical science. Curr Clin Pharmacol 2007;2:217–26. [DOI] [PubMed] [Google Scholar]
- [23].Byvatov E, Schneider G. Support vector machine applications in bioinformatics. Appl Bioinform 2003;2:67–77. [PubMed] [Google Scholar]
- [24].Frantzidis CA, Bratsas C, Klados MA, et al. On the classification of emotional biosignals evoked while viewing affective pictures: an integrated data-mining-based approach for healthcare applications. Ieee T Inf Technol B 2010;14:309–18. [DOI] [PubMed] [Google Scholar]
- [25].Thulasidas M, Guan C, Wu JK. Robust classification of EEG signal for brain-computer interface. Ieee T Neur Sys Reh 2006;14:24–9. [DOI] [PubMed] [Google Scholar]
- [26].Shi SYM, Suganthan PN. Feature analysis and classification of protein secondary structure data. Lect Notes Comput Sc 2003;2714:1151–8. [Google Scholar]
- [27].Kubota Y, Sato W, Toichi M, et al. Frontal midline theta rhythm is correlated with cardiac autonomic activities during the performance of an attention demanding meditation procedure. Brain Res Cogn Brain Res 2001;11:281–7. [DOI] [PubMed] [Google Scholar]
- [28].Coburn KL, Moreno MA. Facts and artifacts in brain electrical activity mapping. Brain Topogr 1988;1:37–45. [DOI] [PubMed] [Google Scholar]
- [29].Fatourechi M, Bashashati A, Ward RK, et al. EMG and EOG artifacts in brain computer interface systems: a survey. Clin Neurophysiol 2007;118:480–94. [DOI] [PubMed] [Google Scholar]
- [30].Møller MF. A scaled conjugate gradient algorithm for fast supervised learning. Neural Networks 1993;6:525–33. [Google Scholar]
- [31].Cortes C, Vapnik V. Support-Vector Networks. Machine Learning 1995;20:273–97. [Google Scholar]
- [32].Knerr S, Personnaz L, Dreyfus G. Single-layer learning revisited: a stepwise procedure for building and training a neural network. Neurocomputing: Springer; 1990; 68:41–50. [Google Scholar]
- [33].Bo LF, Wang L, Jiao LC. Feature scaling for kernel fisher discriminant analysis using leave-one-out cross validation. Neural Comput 2006;18:961–78. [DOI] [PubMed] [Google Scholar]
- [34].Yuan GX, Ho CH, Lin CJ. Recent advances of large-scale linear classification. P Ieee 2012;100:2584–603. [Google Scholar]
- [35].Holt M, Semnani S. Convergence of back-propagation in neural networks using a log-likelihood cost function. Electron Lett 1990;26:1964–5. [Google Scholar]
- [36].Davidson RJ, Kabat-Zinn J, Schumacher J, et al. Alterations in brain and immune function produced by mindfulness meditation. Psychosom Med 2003;65:564–70. [DOI] [PubMed] [Google Scholar]
- [37].Travis F, Tecce J, Arenander A, et al. Patterns of EEG coherence, power, and contingent negative variation characterize the integration of transcendental and waking states. Biol Psychol 2002;61:293–319. [DOI] [PubMed] [Google Scholar]
- [38].Travis F, Tecce JJ, Guttman J. Cortical plasticity, contingent negative variation, and transcendent experiences during practice of the transcendental meditation technique. Biol Psychol 2000;55:41–55. [DOI] [PubMed] [Google Scholar]
- [39].Kaur C, Singh P. EEG derived neuronal dynamics during meditation: progress and challenges. Adv Prevent Med 20152015. [DOI] [PMC free article] [PubMed] [Google Scholar]
- [40].Josipovic Z. Duality and nonduality in meditation research. Conscious Cogn 2010;19:1119–21. [DOI] [PubMed] [Google Scholar]
- [41].Travis F, Shear J. Focused attention, open monitoring and automatic self-transcending: categories to organize meditations from Vedic, Buddhist and Chinese traditions. Conscious Cogn 2010;19:1110–8. [DOI] [PubMed] [Google Scholar]
- [42].Lutz A, Greischar LL, Rawlings NB, et al. Long-term meditators self-induce high-amplitude gamma synchrony during mental practice. Proc Natl Acad Sci U S A 2004;101:16369–73. [DOI] [PMC free article] [PubMed] [Google Scholar]
Associated Data
This section collects any data citations, data availability statements, or supplementary materials included in this article.