

Supplemental Digital Content is available in the text
Keywords: admission time, hip fracture, hospital type, mortality, trend, volume
Abstract
Two hypotheses were offered for the effect of shorter hospital stays on mortality after hip fracture surgery: worsening the quality of care and shifting death occurrence to postacute settings.
We tested whether the risk of hospital death after hip fracture surgery differed across years when postoperative stays shortened, and whether care factors moderated the association.
Analysis of acute hospital discharge abstracts for subgroups defined by hospital type, bed capacity, surgical volume, and admission time.
153,917 patients 65 years or older surgically treated for first hip fracture.
Risk of hospital death.
We found a decrease in the 30-day risk of hospital death from 7.0% (95%CI: 6.6–7.5) in 2004 to 5.4% (95%CI: 5.0–5.7) in 2012, with an adjusted odds ratio [OR] 0.71 (95%CI: 0.63–0.80). In subgroup analysis, only large community hospitals showed the reduction of ORs by calendar year. No trend was observed in teaching and medium community hospitals. By 2012, the risk of death in large higher volume community hospitals was 34% lower for weekend admissions, OR = 0.66 (95%CI: 0.46–0.95) and 39% lower for weekday admissions, OR = 0.61 (95%CI: 0.40–0.91), compared to 2004. In large lower volume community hospitals, the 2012 risk was 56% lower for weekend admissions, OR = 0.44 (95%CI: 0.26–0.75), compared to 2004.
The risk of hospital death after hip fracture surgery decreased only in large community hospitals, despite universal shortening of hospital stays. This supports the concern of worsening the quality of hip fracture care due to shorter stays.
1. Introduction
Several studies show excess mortality after hip fracture compared with the general population.[1] One in 10 extra deaths occur during hospitalization for hip fracture surgery.[2] The risk of hospital death is associated with characteristics of patients, their fracture, and treatment.[3,4] Where patients undergo surgical treatment for hip fracture may also influence the risk of postoperative hospital death.[5–11] Factors of care delivery include hospital type and size, surgical volume, prioritization policy, care standards, transfers, care intensity, the availability of operating rooms and intensive care teams during the week, and management of non-medical delays. Recently, some argued that shortening of hospital stays after hip fracture surgery could affect hospital mortality either by worsening the quality of hip fracture care or by shifting the occurrence of death to postacute settings.[11–13]
In Canada, hospitalization after hip fracture surgery shortened markedly in the 2000s as hospitals started introducing early discharge programs to improve efficiency.[14] However, whether the risk of hospital death also changed during that period has not been reported. This study sought to test whether the risk of hospital death within 30 days after hip fracture surgery was different between 2004 and 2012 in Canada, and whether the time trend was moderated by factors of care delivery. In particular, we examine the time trends in subgroups of patients defined by a combination of hospital type, bed capacity, surgical volume, and admission time, that is, by factors that influence access and outcomes of surgery.[5,9,10,15]
2. Methods
2.1. Study group
We examined discharge abstracts of 153,917 patients 65 years or older who underwent surgery for nonpathological first hip fracture between January 1, 2004 and December 31, 2012 in all Canadian hospitals, except for the province of Quebec. The abstracts were selected from a database maintained by the Canadian Institute for Health Information (CIHI) using procedure codes for hip fracture surgery (CCI: 1VA74^^, 1VA53^^, 1VC74^^, 1SQ53^^, or CCP: 9054, 9114, 9134, 9351, 9359, 9361, 9362, 9363, 9364, 9369). All selected patients stayed at least one day after surgery. These did not include 25 patients with invalid procedure or discharge dates. The University of British Columbia Behavioural Research Ethics Board approved this study (H11-02611).
2.2. Primary outcome
The primary outcome was hospital death. Live discharge was treated as a competing event. Live discharges were identified by CIHI discharge destination codes: discharged home, discharge to home with support services, transferred to a long term care facility, or transferred to another nonacute facility (palliative care/hospice, addiction treatment centre). Deaths after surgery were ascertained within 30 inpatient days, on the premise that longer stays reflected nonacute hospitalization.[16]
2.3. Subgroups
We studied the time trends in hospital mortality separately in 15 subgroups defined by factors of care delivery, namely, hospital type, bed capacity, annual volume of hip fracture surgery, and weekday and time of admission. Hospital type here serves as a proxy for standards of anesthesia, surgery and intensive care, adequacy of facilities and staffing levels, and attitudes to training, which may affect mortality outcomes.[15] We used the CIHI classification that aggregates hospitals by type and the total number of beds in four groups: teaching, community-large, community-medium and community-small.[17] Hospital surgical volume is often linked to quality of care and access to resources.[6] We dichotomized hospitals into higher and lower volume categories by comparing their annual volumes in the year of index surgery with the median of average annual volumes among hospitals of the same type (174 surgeries for teaching hospitals, 141 for community large hospitals, 37 for community medium hospitals).[18,19] Admission time was previously linked to access to resources with fewer support services from late Friday to Monday morning.[9] In our analysis, weekday admissions between 8 am and 5 pm were classified as during working hours, and between 5 pm to 8 am as after hours, and weekend admissions were between 5 pm Friday and 8 am Monday.
2.4. Statistical analysis
We reported the distribution of patients by variable levels in each calendar year and compared the distributions across years using the chi-square test. Daily death rates were estimated by dividing the number of deaths found in the discharge abstracts by the total number of inpatient days during the 30-day follow-up, overall and by calendar year.
We estimated the cumulative incidence function of death for each of 30 inpatient days after day of surgery, accounting for discharge rates, on the premise that patients remain at risk of hospital death only while they remain in hospital.[20] We treated postoperative stays ended by transfers to another acute care facility, or by discharges occurring on the same day of surgery, as well as stays exceeding 30 days after surgery as the right-censored observations of time duration.[21] We compared the cumulative incidence functions between years using Pepe-Mori 2-sample test.[22]
We used proportional odds models and the pseudovalues method to test whether the cumulative incidences of death were different between each year and 2004.[23] In the overall analysis, differences between the years were adjusted for age, sex, preadmission residence, diagnostic code for heart failure (ICD-10-CA I50, J81), chronic obstructive pulmonary disease (ICD-10-CA J41, J42, J43, J44, J47), ischemic heart disease (ICD-10-CA I20, I21, I22, I24, I25), cardiac dysrhythmias (ICD-10-CA I47, I48, I49), hypertension (ICD-10-CA I10.0, I10.1, I11), and diabetes (ICD-10-CA E10.0 –E10.7, E11.0–11.7, E13.0–13.7, E14.0–14.7) from all hospitalizations in 1 year prior to index admission, and fracture type, procedure type, weekday and time of admission, hospital type and size, hospital volume of hip fracture surgeries, demand at index admission, time to surgery, and province of residence.[3–5,9,10,15] In the subgroup analysis, the differences were adjusted for age, sex, preadmission residence, comorbidity, fracture type at surgery, procedure type, demand at index admission, and time to surgery. Within each subgroup, we performed the nonparametric rank-order test for trend in adjusted ORs ordered by a calendar year.[24] The competing-risk analysis was conducted with R packages cmprsk,[25] prodlim,[26] and geepack.[27]
3. Results
3.1. Patient characteristics
In total, 153,917 hip fracture patients underwent surgery between 2004 and 2012 (Table 1). The majority were women (73.4%), and almost half were 85 years or older (45.6%). In half of the patients, fracture type was transcervical (52.0%). Major comorbidity was reported for 27.0%, with cardiac dysrhythmias being the most prevalent (9.4%).
Table 1.
Characteristics of 153,917 patients surgically treated for first hip fracture, by calendar year.
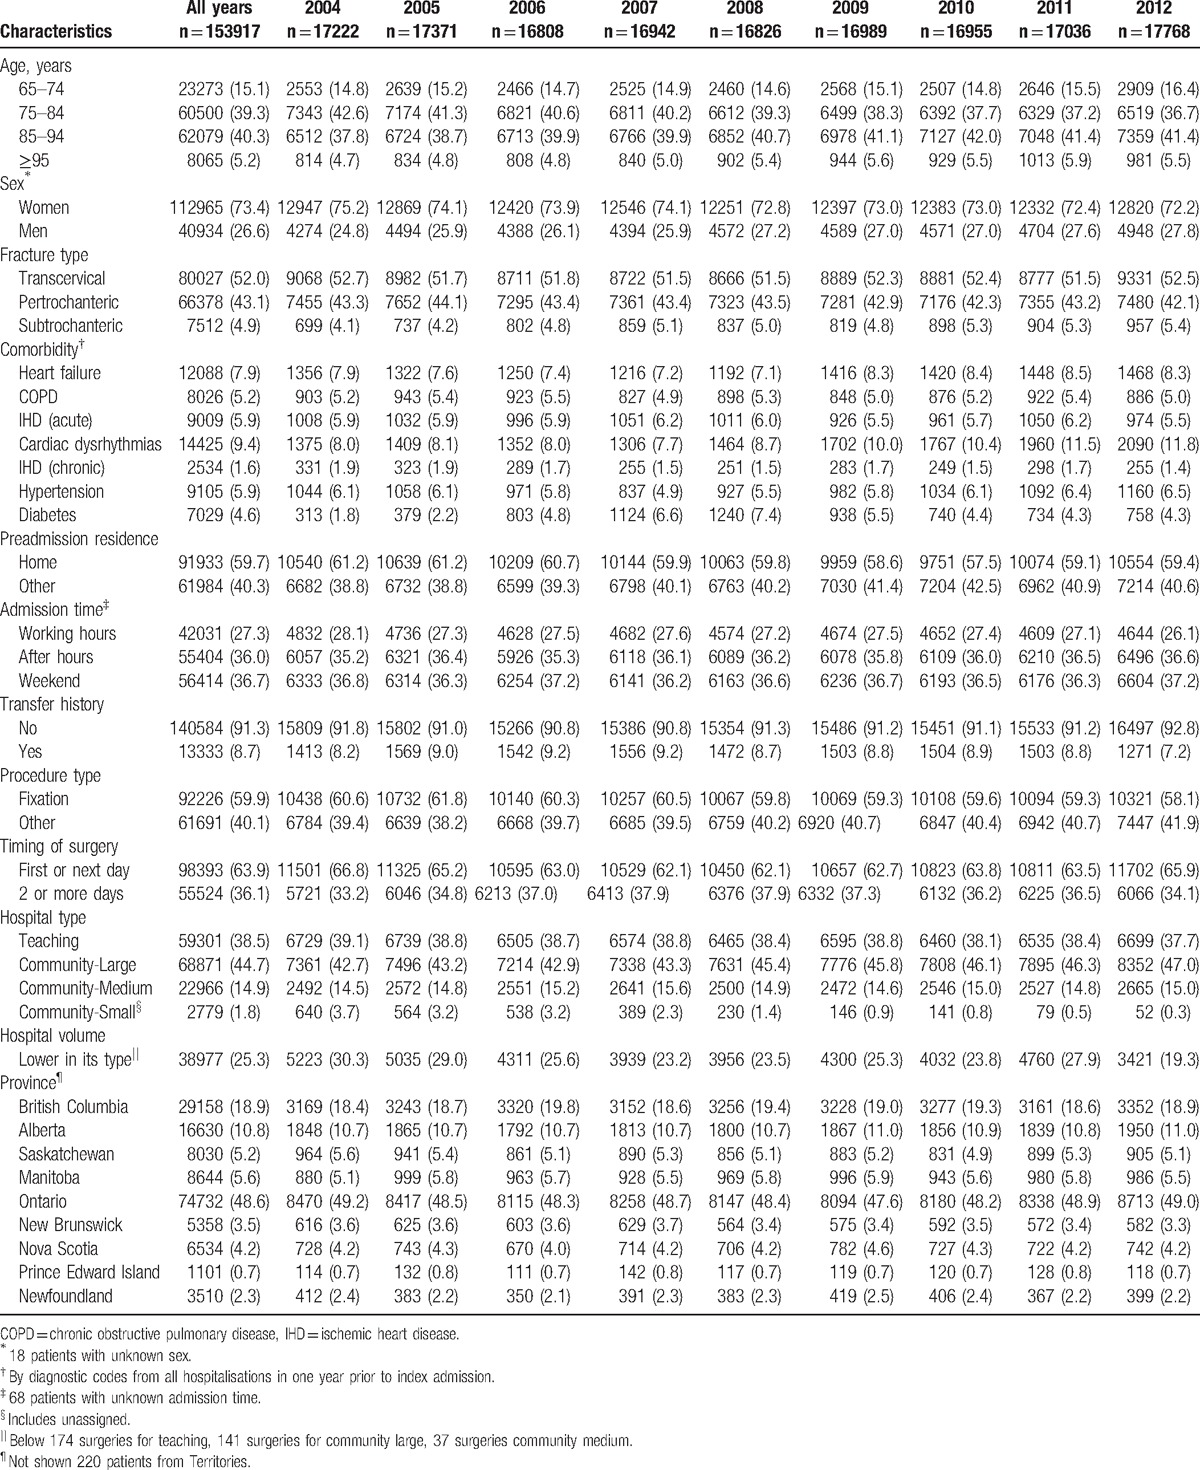
The proportion of patients who underwent surgery in large community hospitals (44.7%) was higher than in teaching (38.5%) or medium community (14.9%) hospitals (Table 1). Less patients underwent surgery at small community and unassigned type (1.8%) hospitals. More patients underwent surgery at higher volume teaching (76.7%) and community large hospitals (68.4%) when compared to lower volume hospitals of each type. More patients were admitted after working hours (39.1%) or on weekends (37.5%) than during working hours (23.4%) at higher volume teaching hospitals. Similar distributions were seen for higher volume community large hospitals: after hours (36.0%), weekends (36.8%), and working hours (27.2%), and for lower volume community large hospitals: after hours (34.0%), weekends (36.1%), and working hours (29.8%). For lower volume teaching hospitals, more patients were admitted after working hours (37.9%) or on weekends (37.9%) than during working hours (24.2%). Similar proportions of patients were admitted during working hours, after hours and on weekends at community medium hospitals.
In all subgroups, similar proportions of patients were over the age of 85, men, with at least 1 major comorbidity, with transcervical fracture type, and underwent fixation (see Table, Supplemental Digital Content 1–3). Higher proportion of patients were admitted from home for lower volume teaching hospitals (65.2%) and community large hospitals (63.0%) than for higher volume teaching hospitals (54.2%) or community medium hospitals (54.6%) (see Table, Supplemental Digital Content 1–3). Higher proportion of patients waited for surgery 2 or more days after admission for teaching hospitals (44.4%) than for community hospitals (30.8%) (see Table, Supplemental Digital Content 1–3). The proportion of patients for higher volume teaching hospitals, higher volume community large hospitals, and community medium hospitals were distributed evenly over the years (not shown in Tables). The proportion of patients for lower volume teaching hospitals decreased from 14.9% of patients in 2004 to 6.8% in 2012. The proportion of patients for lower volume community large hospitals varied across calendar years with 12.3% in 2004, 9.0% in 2007, and 13.5% in 2011.
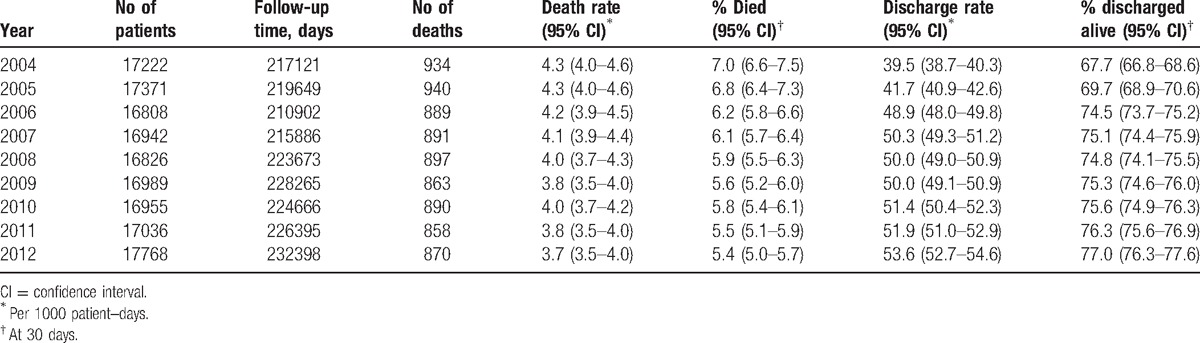
3.2. Death by calendar year
In this synthetic cohort, 8,032 (5.2%) patients died and 97,259 (63.2%) were discharged within 30 inpatient days of surgery. The average follow-up time was 13 days with 48,626 (31.6%) patients followed until censoring events or 30 days after surgery. Overall, the average death rate was 4.0 (95% confidence interval [CI] 3.9 to 4.1) per 1000 patient-days, with the highest rate of 4.3 (95% CI 4.0 to 4.6) per 1000 patient-days in 2004 and 2005 and the lowest rate of 3.7 (95% CI 3.5 to 4.0) per 1000 patient-days in 2012 (Table 2). When compared to 2004, the cumulative incidence functions of death were not different in 2005 (P = .82) or 2006 (P = .34), but were different in 2007 and 2008 (P < .05), and in 2009, 2010, 2011, and 2012 (P < .01). At 30 days after surgery, the cumulative incidence of death was highest among patients treated in 2004 at 7.0% (95% CI 6.6 to 7.5) and lowest in 2012 at 5.4% (95% CI 5.0 to 5.7) (Table 2).
Table 2.
Hospital deaths and live discharges within 30 days after surgery by calendar year.
Compared to 2004, the adjusted odds of death were 17% lower (odds ratio [OR] = 0.83, 95% CI 0.74 to 0.93), 22% lower (OR = 0.78, 95% CI 0.70 to 0.88), and 29% lower (OR = 0.71, 95% CI 0.63 to 0.80) in 2006, 2009, and 2012 respectively (Fig. 1). The trend test indicates a consistent reduction of the adjusted ORs ordered by calendar year (z = −3.9, P < .001). This was in contrast to increasing trends for live discharges (z = 5.5, P < .001).
Figure 1.
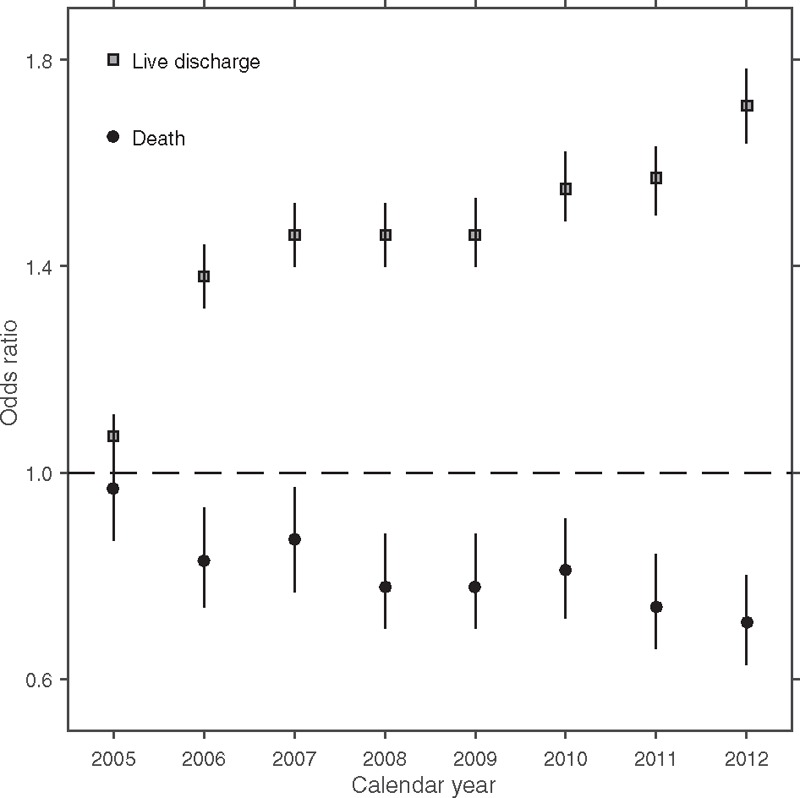
Risk of death and live discharge by calendar year, relative to 2004 (dashed line). Year-specific odds ratios and 95% confidence intervals were adjusted for age (85+ vs < 85), sex, preadmission residence (residence vs home), comorbidity (at least 1 acute admission for heart failure, chronic obstructive pulmonary disease, ischemic heart disease, hypertension, or diabetes in the year prior to admission for hip fracture), fracture type (transcervical vs other), procedure type (fixation vs implant), weekday and time of admission, hospital type and size (teaching, large, medium, or small community), and hospital volume of hip fracture surgery (higher vs lower), demand at index admission (number of admissions in the week of initial hospitalization, larger vs smaller than hospital weekly capacity), time to surgery (2 days or more days vs less), and province of admission. Trend test for odds ratios of death z = −3.9, P < .001. Trend test for odds ratios of discharge z = 5.5, P < .001.
3.3. Death by calendar year in subgroups
Table 3 summarizes the rates and risks for death and for discharge in the subgroups. The lowest death rate was 3.3 (95% CI 2.8 to 3.7) per 1000 patient-days in teaching hospitals with lower volume of hip fracture surgeries for weekend admissions and the highest death rate was 5.0 (95% CI 4.5 to 5.4) per 1,000 patient-days in medium size community hospitals for working-hours admission. The 30-day cumulative incidence of death was lowest for weekend admissions to low-volume teaching hospitals 5.0% (95% CI 4.4 to 5.6) and highest for weekend admissions to medium community hospitals 6.7% (95% CI 6.0 to 7.3). The lowest discharge rate and 30-day cumulative incidence of discharge were observed in teaching higher volume hospitals for after-hours admissions at 38.1 (95% CI 37.4 to 38.9) per 1000 patient-days and 67.1% (95% CI 66.3% to 67.9%), respectively. The highest discharge rate was 57.9 (95% CI 56.9 to 59.0) per 1,000 patient-days in community large higher volume hospitals for weekend admissions. The highest 30-day cumulative incidence of discharge was in community large higher volume hospitals for after-hours admissions at 79.2% (95% CI 78.5% to 79.9%).
Table 3.
Hospital deaths and live discharges in subgroups defined by hospital type, bed capacity, annual volume of hip fracture surgery, and time of admission∗.
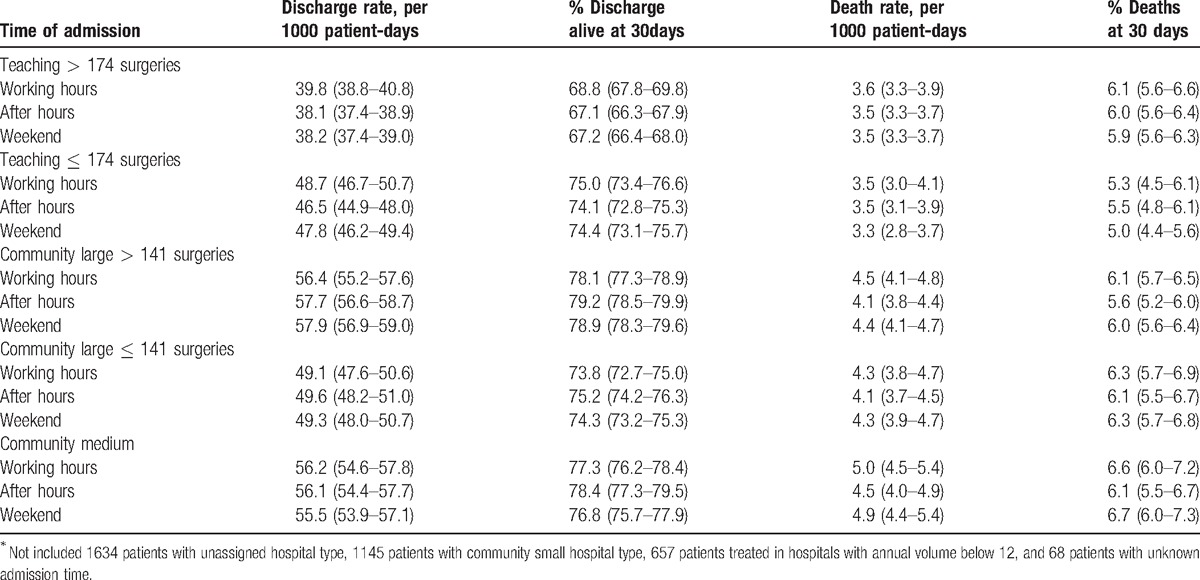
Figure 2 shows the year-specific adjusted ORs for death in each subgroup. For working-hours admissions (Fig. 2, row 1), the odds of death were 0.68 (95% CI 0.43 to 1.09) at higher volume teaching hospitals, 0.61 (95% CI 0.40 to 0.91) at higher volume large community hospitals, 0.99 (95% CI 0.40 to 2.42) at lower volume teaching hospitals, 0.75 (95% CI 0.42 to 1.35) at lower volume large community hospitals, and 0.53 (95% CI 0.32 to 0.85) at medium community hospitals in 2012 compared to 2004. For after-hours admissions (Fig. 2, row 2), the odds of death were 0.64 (95% CI 0.45 to 0.91) at higher volume teaching hospitals, 0.56 (95% CI 0.37 to 0.83) at higher volume large community hospitals, 0.90 (95% CI 0.40 to 2.06) at lower volume teaching hospitals, 0.80 (95% CI 0.46 to 1.40) at lower volume large community hospitals, and 1.10 (95% CI 0.65 to 1.87) at medium community hospitals in 2012 compared to 2004. For weekend admissions (Fig. 2, rows 3), the odds of death were 1.02 (95% CI 0.73 to 1.43) at higher volume teaching hospitals, 0.66 (95% CI 0.46 to 0.95) at higher volume large community hospitals, 0.61 (95% CI 0.25 to 1.48) at lower volume teaching hospitals, 0.44 (95% CI 0.26 to 0.75) at lower volume large community hospitals, and 0.67 (95% CI 0.40 to 1.12) at medium community hospitals in 2012 compared to 2004.
Figure 2.
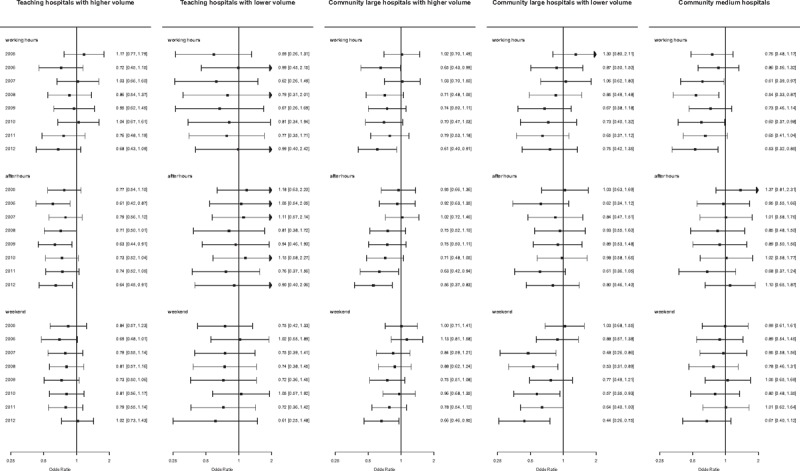
Risk of death after surgery by calendar year as compared to 2004 within subgroups defined by hospital type, bed capacity, annual volume of hip fracture surgery, and weekday and time of admission. Differences between years were adjusted for age (85+ vs < 85), sex, preadmission residence (residence vs home), comorbidity (at least 1 acute admission for heart failure, chronic obstructive pulmonary disease, ischemic heart disease, hypertension, or diabetes in the year prior to admission for hip fracture), fracture type (transcervical vs other), procedure type (fixation vs implant), demand at index admission (number of admissions in the week of initial hospitalization, larger vs smaller than hospital weekly capacity), and time to surgery (2 days or more days vs less).
The trend tests indicate consistent reduction in the adjusted ORs ordered by calendar year in large community hospitals with lower volumes for working-hours admissions (z = −2.1, P < .05), and with higher volumes for weekend admissions (z = −2.0, P < .05) and for after-hours admissions (z = −2.5, P < .01). No trend for the adjusted ORs ordered by calendar year was seen in other subgroups.
4. Discussion
In this study, we tested whether hospital mortality changed after shortening in postoperative stays among patients undergoing hip fracture surgery. We estimated the risk of hospital death for each calendar year between 2004 and 2012, when postoperative stays markedly shortened in Canada. Using the cumulative incidence function for death to account for the rate of live discharge, we found a gradual decrease in the 30-day risk of death from 7.0% (95% CI 6.6 to 7.5) in 2004 to 5.4% (95% CI 5.0 to 5.7) in 2012. After adjustment for characteristics of patients, their fracture, treatment, and care delivery, the risk of death was 29% lower in 2012 than in 2004 (OR = 0.71, 95% CI 0.63 to 0.80), with a significant trend in reduction of the adjusted ORs ordered by calendar year (P < .001).
We further found that where patients undergo surgery moderated the association between calendar year and hospital mortality after hip fracture surgery during the study period. In particular, our results demonstrate the time trend differed in subgroups of patients defined by a combination of hospital type, bed capacity, annual volume of hip fracture surgeries, and weekday and time of admission. Only large community hospitals showed reduction of the adjusted ORs by calendar year. Compared to 2004, the 2012 risk of death was 34% lower for weekend admissions to higher volume hospitals (OR = 0.66, 95% CI 0.46 to 0.95), 39% lower for weekday admissions to higher volume hospitals (OR = 0.61, 95% CI 0.40 to 0.91), and 56% lower for weekend admissions to lower volume hospitals (OR = 0.44, 95% CI 0.26 to 0.75). No trend for the adjusted ORs ordered by calendar year was present in teaching hospitals or medium community hospitals.
Some suggested that early discharge programs shorten the exposure to the risk of death in hospital after hip fracture surgery[28] and shift the occurrence of death to postacute settings.[11] Shortening of postoperative stays also caused a concern of worsening the quality of hip fracture care.[12] Following Andersen et al,[29] we may expect fewer deaths in the intervention group than in the control group when an intervention increases the discharge rate even with no change in the death rate, simply because the number of event-free patients will decrease more quickly in the intervention group. Similarly, Wobblers et al reasoned that a decrease in the death rate even with no change in the rate of discharge in the intervention group leaves more patients exposed to the competing risk of discharge, resulting in more discharges in the intervention group.[30] Thus, in the presence of competing risk of discharge, a policy question (“Does the stay shortening lower the risk of death?”) and an etiological question (“Does the stay shortening lower the death rate among patients still hospitalized?”) may have differing answers. We demonstrate that a time-trend in increasing the probability of discharge was not followed by a reduction in the risk of death in many care settings. This points to a new research agenda aimed at understanding the effects of shortening of postoperative hospital stays on the standards of hip fracture care.
This is the first study to examine the occurrence of hospital death across calendar years within subgroups defined by the factors of care delivery, but there are some limitations. In particular, hospital type was based on the peer group assignments available only after 2010 and therefore there was a possibility for misclassification.[31] Due to the observational nature of the study, there was a limited number of variables for adjustment. In particular, the presence of renal disease, prior cerebrovascular accident, dementia, or Parkinson's disease may influence the occurrence of hospital death after hip fracture across calendar years. Within each subgroup we were able to control for only age, sex, preadmission residence, comorbidity, fracture subtype, type of surgical procedure, and time to surgery. We examined data for all Canadian hospitals outside the province of Quebec. Sirois et al[32] reported an annual decrease in hospital death after hip fracture surgery of 4% over 20 years in a level 1 trauma center in Quebec, which is consistent with our results.
5. Conclusions
Despite universal shortening hospital stays in Canadian hospitals between 2004 and 2012, the risk of hospital death after hip fracture surgery decreased only in large community hospitals, but not in teaching and medium-size community hospitals. This supports the concern of worsening the quality of hip fracture care resulting from shorter stays in some care settings.
Acknowledgments
We gratefully acknowledge the guidance from the CIHI experts in understanding the discharge abstracts, and thank Nick Bradley, Kirill Gordin, and Michael Tang for preparing data, Bo Green for statistical programming, and Janet Lam for generating figures for the manuscript. As the manuscript's guarantor BS affirms that he had full access to all of the data in the study and takes responsibility for the integrity of the data and the accuracy of the data analysis. This research was funded by the Canadian Institute for Health Research. This funder had no role in the design of this study, execution, analyses, data interpretation or decision to submit results for publication. (1) BS, PG and the Collaborative have received grants from the Canadian Institutes of Health Research related to this work. (2) PG also receives funding from the Natural Sciences and Engineering Research Council of Canada, the Canadian Foundation for Innovation and the British Columbia Specialists Services Committee for work around hip fracture care not related to this manuscript. He has also received fees from the BC Specialists Services Committee (for a provincial quality improvement project on redesign of hip fracture care) and from Stryker Orthopedics (as a product development consultant). He is a board member and shareholder in Traumis Surgical Systems Inc. and a board member for the Canadian Orthopedic Foundation. He also serves on the speakers’ bureaus of AO Trauma North America and Stryker Canada. (3) SNM reports research grants from Amgen Canada, and from Merck, personal fees from Amgen Canada, and personal fees from Eli Lilly outside the submitted work. (4) KS is a postdoctoral fellow whose salary is paid by Canadian Institutes of Health Research funding related to this work.
Supplementary Material
Footnotes
Abbreviations: CI = confidence interval, CIHI = Canadian Institute of Health Information, OR = odds ratio.
The following are members of the Canadian Collaborative Study on Hip Fractures: Eric Bohm, Lauren Beaupre, Michael Dunbar, Donald Griesdale, Pierre Guy, Edward Harvey, Erik Hellsten, Susan Jaglal, Hans Kreder, Lisa Kuramoto, Adrian Levy, Suzanne N. Morin, Katie J. Sheehan, Boris Sobolev, Jason M. Sutherland, and James Waddell.
The authors have no funding and conflicts of interest to disclose.
Supplemental Digital Content is available for this article.
References
- [1].Panula J, Pihlajamaki H, Mattila VM, et al. Mortality and cause of death in hip fracture patients aged 65 or older: a population-based study. BMC Musculoskelet Disord 2011;12:105. [DOI] [PMC free article] [PubMed] [Google Scholar]
- [2].Uzoigwe CE, Burnand HG, Cheesman CL, et al. Early and ultra-early surgery in hip fracture patients improves survival. Injury 2013;44:726–9. [DOI] [PubMed] [Google Scholar]
- [3].Penrod JD, Litke A, Hawkes WG, et al. The association of race, gender, and comorbidity with mortality and function after hip fracture. J Gerontol A Biol Sci Med Sci 2008;63:867–72. [DOI] [PMC free article] [PubMed] [Google Scholar]
- [4].Vestergaard P, Rejnmark L, Mosekilde L. Loss of life years after a hip fracture. Acta Orthop 2009;80:525–30. [DOI] [PMC free article] [PubMed] [Google Scholar]
- [5].Forte ML, Virnig BA, Swiontkowski MF, et al. Ninety-day mortality after intertrochanteric hip fracture: does provider volume matter? J Bone Joint Surg Am 2010;92:799–806. [DOI] [PubMed] [Google Scholar]
- [6].Kristensen PK, Thillemann TM, Johnsen SP. Is bigger always better? A nationwide study of hip fracture unit volume, 30-day mortality, quality of in-hospital care, and length of hospital stay. Med Care 2014;52:1023–9. [DOI] [PubMed] [Google Scholar]
- [7].Metcalfe D, Olufajo OA, Zogg CK, et al. Are older adults with hip fractures disadvantaged in level 1 trauma centers? Med Care 2016;54:616–22. [DOI] [PubMed] [Google Scholar]
- [8].Wiggers JK, Guitton TG, Smith RM, et al. Observed and expected outcomes in transfer and nontransfer patients with a hip fracture. J Orthop Trauma 2011;25:666–9. [DOI] [PubMed] [Google Scholar]
- [9].Freemantle N, Ray D, McNulty D, et al. Increased mortality associated with weekend hospital admission: a case for expanded seven day services? BMJ 2015;351:h4596. [DOI] [PubMed] [Google Scholar]
- [10].Khan SK, Jameson SS, Avery PJ, et al. Does the timing of presentation of neck of femur fractures affect the outcome of surgical intervention. Eur J Emerg Med 2013;20:178–81. [DOI] [PubMed] [Google Scholar]
- [11].Nordstrom P, Gustafson Y, Michaelsson K, et al. Length of hospital stay after hip fracture and short term risk of death after discharge: a total cohort study in Sweden. BMJ 2015;350:h696. [DOI] [PMC free article] [PubMed] [Google Scholar]
- [12].Cram P, Rush RP. Length of hospital stay after hip fracture: how low can we go before patients are at risk? BMJ 2015;350:h823. [DOI] [PubMed] [Google Scholar]
- [13].FitzGerald JD, Boscardin WJ, Hahn BH, et al. Impact of the medicare short stay transfer policy on patients undergoing major orthopedic surgery. Health Serv Res 2007;42(1 pt 1):25–44. [DOI] [PMC free article] [PubMed] [Google Scholar]
- [14].Sobolev B, Guy P, Sheehan KJ, et al. Time trends in hospital stay after hip fracture in Canada, 2004–2012: database study. Arch Osteoporos 2016;11:13. [DOI] [PubMed] [Google Scholar]
- [15].Weller I, Wai EK, Jaglal S, et al. The effect of hospital type and surgical delay on mortality after surgery for hip fracture. J Bone Joint Surg Br 2005;87:361–6. [DOI] [PubMed] [Google Scholar]
- [16].Kaboli PJ, Go JT, Hockenberry J, et al. Associations between reduced hospital length of stay and 30-day readmission rate and mortality: 14-year experience in 129 Veterans Affairs hospitals. Ann Intern Med 2012;157:837–45. [DOI] [PubMed] [Google Scholar]
- [17].Canadian Institute for Health Information (CIHI). Peer Groups in the Electronic Discharge Abstract Database Reports, 2015. Ottawa: CIHI; 2015. [Google Scholar]
- [18].Urbach DR, Baxter NN. Does it matter what a hospital is “high volume” for? Specificity of hospital volume-outcome associations for surgical procedures: analysis of administrative data. Qual Saf Health Care 2004;13:379–83. [DOI] [PMC free article] [PubMed] [Google Scholar]
- [19].Ghaferi AA, Birkmeyer JD, Dimick JB. Hospital volume and failure to rescue with high-risk surgery. Med Care 2011;49:1076–81. [DOI] [PubMed] [Google Scholar]
- [20].Pintilie M. Competing Risks, A Practical Perspective. 2006;New York: John Wiley & Sons, 53–70. [Google Scholar]
- [21].Austin PC, Lee DS, Fine JP. Introduction to the analysis of survival data in the presence of competing risks. Circulation 2016;133:601–9. [DOI] [PMC free article] [PubMed] [Google Scholar]
- [22].Pepe MS, Mori M. Kaplan–Meier, marginal or conditional probability curves in summarizing competing risks failure time data? Stat Med 1993;12:737–51. [DOI] [PubMed] [Google Scholar]
- [23].Klein JP, Andersen PK. Regression modeling of competing risks data based on pseudovalues of the cumulative incidence function. Biometrics 2005;61:223–9. [DOI] [PubMed] [Google Scholar]
- [24].Cuzick J. A Wilcoxon-type test for trend. Stat Med 1985;4:87–90. [DOI] [PubMed] [Google Scholar]
- [25].Gray B. cmprsk: Subdistribution analysis of competing risks. 2014. Available at: http://CRAN.R-project.org/package=cmprsk Accessed June 19, 2016. [Google Scholar]
- [26].Gerds T. prodlim: Product-limit estimation for censored event history analysis. 2014. Available at: http://CRAN.R-project.org/package=prodlim Accessed June 19, 2016. [Google Scholar]
- [27].Hojsgaard S, Halekoh U, Yan J. The R package geepack for generalized estimating equations. J Stat Software 2006;15:1–1. [Google Scholar]
- [28].Holvik K, Ranhoff AH, Martinsen MI, et al. Predictors of mortality in older hip fracture inpatients admitted to an orthogeriatric unit in oslo, norway. J Aging Health 2010;22:1114–31. [DOI] [PubMed] [Google Scholar]
- [29].Andersen PK, Geskus RB, de WT, et al. Competing risks in epidemiology: possibilities and pitfalls. Int J Epidemiol 2012;41:861–70. [DOI] [PMC free article] [PubMed] [Google Scholar]
- [30].Wolbers M, Koller MT, Stel VS, et al. Competing risks analyses: objectives and approaches. Eur Heart J 2014;35:2936–41. [DOI] [PMC free article] [PubMed] [Google Scholar]
- [31].Canadian Institute for Health Information (CIHI). CIHI Portal Release Noted: Release 9.14.2015. Ottawa: CIHI; 2015. [Google Scholar]
- [32].Sirois MJ, Cote M, Pelet S. The burden of hospitalized hip fractures: patterns of admissions in a level I trauma center over 20 years. J Trauma 2009;66:1402–10. [DOI] [PubMed] [Google Scholar]
Associated Data
This section collects any data citations, data availability statements, or supplementary materials included in this article.