

Abstract
Background
The adaptability of the human brain to the constantly changing environment is reduced in patients with psychotic disorders, leading to impaired cognitive functions. Brain signal complexity, which may reflect adaptability, can be readily quantified via resting-state functional magnetic resonance imaging (fMRI) signals. We hypothesized that resting-state brain signal complexity is altered in psychotic disorders, and is correlated with cognitive impairment.
Methods
We assessed 156 healthy controls (HC) and 330 probands, including 125 patients with psychotic bipolar disorder (BP), 107 patients with schizophrenia (SZ), 98 patients with schizoaffective disorder (SAD) and 230 of their unaffected first-degree relatives (76 BPR, 79 SADR, and 75 SZR) from four sites of the Bipolar-Schizophrenia Network on Intermediate Phenotypes (B-SNIP) consortium. Using multi-scale entropy analysis, we determined whether patients and/or relatives had pathologic differences in complexity of resting-state fMRI signals toward regularity (reduced entropy in all time scales), or toward uncorrelated randomness (increased entropy in fine time scales that decays as the time scale increases) and how these complexity differences might be associated with cognitive impairment.
Results
Compared to HC subjects, proband groups showed either decreased complexity toward regularity or toward randomness. SZ probands showed decreased complexity toward regular signal in hypothalamus, and BP probands in left inferior occipital, right precentral and left superior parietal regions, whereas no brain region with decreased complexity toward regularity was found in SAD probands. All proband groups showed significantly increased brain signal randomness in dorsal and ventral prefrontal cortex (PFC), and unaffected relatives showed no complexity differences in PFC regions. SZ had the largest area of involvement in both dorsal and ventral PFC. BP and SAD probands shared increased brain signal randomness in ventral medial PFC, BP and SZ probands shared increased brain signal randomness in ventral lateral PFC, whereas SAD and SZ probands shared increased brain signal randomness in dorsal medial PFC. Only SZ showed increased brain signal randomness in dorsal lateral PFC. The increased brain signal randomness in dorsal or ventral PFC was weakly associated with reduced cognitive performance in psychotic probands.
Conclusion
These observations support the loss of brain complexity hypothesis in psychotic probands. Furthermore, we found significant differences as well as overlaps of pathologic brain signal complexity between psychotic probands by DSM diagnoses, thus suggesting a biological approach to categorizing psychosis based on functional neuroimaging data.
Keywords: psychosis; schizophrenia, schizoaffective disorder, psychotic bipolar disorder; neural complexity; multiscale entropy
1. Introduction
1.1 What is complexity and why study complexity?
Adapting to everyday stresses requires highly complex interactions between many physiological systems and their regulatory feedback loops operating across numbers of temporal and spatial scales (Goldberger et al., 2002b; Lipsitz, 2002). These dynamic interactions are typically non-linear. Changes in input can result in apparently “unpredictable” but rule-driven changes in the output that can be analyzed by complex statistical techniques such as fractal analyses and other so-called chaos theory-based approaches (Paulus and Braff, 2003). Such approaches have been used to analyze complex phenomena, both within and beyond medicine, ranging from weather and stock market fluctuations to electroencephalogram (EEG) and heart rhythms.
Complexity of physiological systems may be reduced in many disease states and aging (Goldberger et al., 2002a; Goldberger et al., 2002b), leading to degradation of their information processing, thereby making individuals less adaptable to the demands of frequently changing environments. For example, patients with severe congestive heart failure have decreased heart rate variability characterized by low entropy (i.e., regularity or reduced information content) (Costa et al., 2002) and patients with atrial fibrillation have increased randomness in their heart rate that has high entropy (i.e., increased randomness but also reduced information content) (Costa et al., 2002; Goldberger et al., 2002b; Pincus, 1991). Relatively few studies have investigated the complexity of brain physiology in psychiatric disorders.
1.2 Why study complexity in psychosis?
The characteristic disorganization and unpredictability in thinking and behavior in schizophrenia (SZ) points to an intuitive connection between psychosis and chaos (Schmid, 1991). Several investigators have examined complexity in psychotic disorders. More predictable (i.e., decreased complexity) behavior in a consecutive binary choice task has been reported in SZ (Paulus et al., 1996). Decreased nonlinear complexity has been observed during REM and wake periods while undergoing sleep polysomnography in first episode SZ patients (Keshavan et al., 2004). However, some studies showing increased complexity as well (For review see (Fernandez et al., 2013; Takahashi, 2013)). Variations across studies may be related to differences in the phase of illness studied, age, medications, and illness severity. Regional brain differences in complexity measures have not been well delineated. It is also unclear if complexity differs between different psychotic disorders. Mood ratings in bipolar disorder (BP) have less complex patterns compared to healthy persons (Gottschalk et al., 1995). On the other hand, increased EEG complexity has also been observed in bipolar mania (Bahrami et al., 2005). Few studies have directly compared brain complexity measures across diagnoses within the psychosis spectrum. Finally, it is not clear whether brain complexity measures reflect merely disease related markers, or whether they represent familial vulnerability markers. There is evidence that the dynamic complexity of brain oscillations may be heritable (Anokhin et al., 2006). This points to the value of examining brain complexity measures in non-psychotic first degree relatives of psychotic disorder probands.
1.3 How to quantify complexity?
Complexity is often assessed using entropy-based methods (Pincus, 1991; Richman and Moorman, 2000; Rosso et al., 2002) to quantify the regularity (orderliness) of a time series. Entropy, which is a measure of randomness, increases with the degree of irregularity, reaching its maximum in completely random systems. Physiologic output in healthy conditions usually exhibits a higher degree of entropy than output in a pathological state. However, this approach could yield contradictory results in which a high degree of entropy is also observed in pathological conditions, such as heart rate rhythm in atrial fibrillation (Goldberger et al., 2002b). Therefore, a generic approach to measuring global complexity involves considering multiple time scales in a given physical system (Costa et al., 2002, 2005). Subsequently, MSE has been proposed based on sample entropy (Richman and Moorman, 2000) by measuring entropy over multiple time scales inherent in a time series (Costa et al., 2002).
MSE analysis introduces the notion that neither the extremes of complete regularity nor complete randomness are complex (Costa et al., 2002), and the profiles of entropy changes across different time scales are different between regular and random signal in a variety of biological signals (Costa et al., 2005). In the case of regular signal, the entropy is low across all time scales, whereas in random signal the entropy is high in short time scale and its value decays as scale factors increase; indicating the absence of information flow across different time scales in the time series. MSE has been applied to various types of biomedical data, such as electromyograms (Istenic et al., 2010), the human gait (Costa et al., 2003) and postural sway (Costa et al., 2007), EEGs (Catarino et al., 2011; Escudero et al., 2006; Mizuno et al., 2010; Park et al., 2007; Protzner et al., 2011; Takahashi et al., 2010; Yang et al., 2013b), and resting-state fMRI signal (McDonough and Nashiro, 2014; Smith et al., 2014; Yang et al., 2015; Yang et al., 2014; Yang et al., 2013a). Collectively, changes in signal dynamics toward regularity or randomness as two ways of reduced complexity may be ubiquitous in the pathology of biologic systems.
1.4 Why study the resting-state fMRI signal?
Brain complexity in SZ has been examined using electroencephalography (Keshavan et al., 2004; Takahashi et al., 2010), magnetoencephalography (Fernandez et al., 2011), and gyral folding using structural MRI (Narr et al., 2004). A valuable approach to investigating the complexity of brain activity in SZ is resting-state fMRI. Sokumbi and colleagues (Sokunbi et al., 2014) showed that SZ had increased randomness of BOLD activity as indexed by single-scale sample entropy and the Hurst exponent, suggesting that brain complexity may be increased in patients with SZ. We have recently examined the complexity of resting-state fMRI signal in an independent sample of SZ patients (Yang et al., 2015) using multiscale entropy (MSE) (Costa et al., 2002, 2005), and have shown reduced MSE complexity toward either regular or random patterns. The two patterns of change in complexity correlated differently with positive and negative symptoms. However, the study was limited to SZ without their relatives, and the question of diagnostic specificity was not examined.
1.5 Current study
In the current study, we applied the MSE method to assess the complexity of resting-state fMRI data from the Bipolar Schizophrenia Network for Intermediate Phenotypes (BSNIP) study. We sought to address the following questions: 1) Do probands with psychotic disorders (SZ, schizoaffective; SAD, and psychotic BP) differ from healthy controls on the MSE complexity? 2) Do MSE complexity measures differ between diagnostic categories, 3) Do MSE complexity measures correlate with dimensional measures of psychopathology and cognition? and finally 4) Do non-psychotic first degree relatives of psychotic disorder probands have alterations in brain complexity?
2. Materials and methods
2.1 Participants
The recruitment strategy and subject characteristics of the BSNIP sample have been previously described (Tamminga et al., 2013). Patients were recruited from the community if they had a DSM IV-TR diagnosis of SZ, SAD or psychotic BP and at least one first-degree relative between the ages of 15–65 willing to participate in the study. Healthy controls were recruited from the same local communities as where the patients were recruited. Diagnoses were determined using the Structured Clinical Interview for DSM Disorders (SCID) (First et al., 1997).
Inclusion criteria were: 1) no history of seizures or head injury with loss of consciousness (>10 minutes), 2) no diagnosis of substance abuse in the preceding 30 days or substance dependence in the preceding 6 months, 3) negative urine drug screen for common drugs of abuse on the day of testing, 4) clinically stable over the previous month, 5) no history of systemic medical or neurological disorder known to affect cognitive abilities, 6) age-corrected Wide Range Achievement Test-IV Reading standard score >65, and 7) adequate fluency in English to complete testing. The study protocol was approved by the Institutional Review Board at each local site. After a complete description of the study was given to volunteers, their written informed consent was obtained.
Non-psychotic first-degree relatives of probands were included in this study as the relative groups. Those relatives of probands that also met the diagnostic criteria for an Axis-I psychotic disorder were added into the corresponding proband group. For fMRI data, sites were included if they satisfied the following criteria: 1) >200 time points and 2) a TR of 1.5. The Baltimore and Boston sites collected less than 200 time points, and were therefore excluded. The number of time points for the included sites was 204 and was consistent across four sites (Chicago, Hartford, Detroit, and Dallas).
2.2 Cognitive assessment
The Brief Assessment of Cognition in Schizophrenia (BACS) is a neuropsychological battery designed to evaluate global neuropsychological function in individuals with SZ that has been demonstrated to be reliable and valid (Keefe et al., 2004; Keefe et al., 2008). The BACS consists of six subtests covering four domains (Verbal Memory, Processing Speed, Reasoning, and Problem Solving, and Working Memory). Subtest scores were converted to z-scores using published norms (Keefe et al., 2008). To limit the impact of extreme values on group means, outliers were winsorized (Tabachnick and Fidell, 2007) to a maximum absolute value of 4.0 for subtest z-scores before BACS composite scores were computed to reduce outlier effects on data analyses. A previous report provides details of the BACS data in the full BSNIP sample (Hill et al., 2013).
2.3 Functional MRI scanning and image processing
All subjects at each site underwent a single 5-min run of resting-state fMRI on a 3-T scanner as described previously in articles that examined conventional functional MRI measures (Khadka et al., 2013; Meda et al., 2012). Preprocessing of fMRI and T1-weighted images were carried out using the Data Processing Assistant for Resting-State fMRI toolbox (Chao-Gan and Yu-Feng, 2010) implemented in Matlab (MathWorks, Natick, MA). The initial six images, during which T2 effects stabilized, were removed. Images were then realigned and corrected for slice timing differences, with appropriate adjustments incorporated for between site variability in acquisition parameters such as repetition time, slice acquisition direction etc. Only subjects that exhibited a maximum displacement less than 1.5mm in each axis, and less than 1.5 degree angular motion were included. A conservative motion limit was chosen to increase consistency of resting-state fMRI data across different sites. A total of 201 subjects was excluded due to excess head motion (Chicago: 36; Dallas: 34; Detroit: 1; and Hartford: 130 subjects). Images were then co-registered to their corresponding structural T1-weighted images. Resting-state images were normalized into a common 3mm isotropic MNI space. The CSF and white matter partitions generated during the segmentation process were used as regions of interest to extract the corresponding signal for nuisance covariate regression along with head motion to remove potential physiological noise.
2.4 Analysis of the resting-state fMRI signal complexity
MSE analysis (Costa et al., 2002, 2005) was developed to estimate sample entropy in multiple time scales by using a coarse-graining procedure. Sample entropy is used in MSE analysis because it provides greater consistency and is less dependent on a given signal length compared with other entropy methods (Richman and Moorman, 2000). MSE calculation can be summarized in the following three steps: (a) constructing coarse-grained time series according to different scale factors; (b) quantifying the sample entropy of each coarse-grained time series; and (c) examining the sample entropy profile over a range of scales. According to this method, the length of each coarse-grained time series is equal to the length of the original time series divided by the scale factor. For Scale 1, the time series is merely the original time series.
The MSE analysis of resting-state fMRI signal has been described previously (Yang et al., 2015; Yang et al., 2014; Yang et al., 2013a) using parameters of m = 1, r = 0.35, and scale factor up to 5. We have shown that the parameters m = 1 and r = 0.20–0.45 provided reliable MSE estimates in short resting-state fMRI signal (e.g., 200 data points) (Yang et al., 2016).
A conceptual illustration of quantifying resting-state fMRI signal complexity using MSE is provided in Fig. 1. Using the MSE of resting-state fMRI signal from healthy subjects as the reference, we classified MSE profiles into three types: 1) increased complexity (i.e., increased entropy in all scales), 2) reduced complexity toward regularity (i.e., decreased entropy in all scales), or 3) reduced complexity toward randomness (i.e., increased entropy in fine scales followed by decay in entropy as the scale factors increase) (Yang et al., 2015). The random type of MSE profile quantifies uncorrelated randomness that cannot be fully captured by single-scale entropy and the slope of entropy decay was used as an indicator of complexity change in the random type of complexity changes (Yang et al., 2015).
Figure 1.
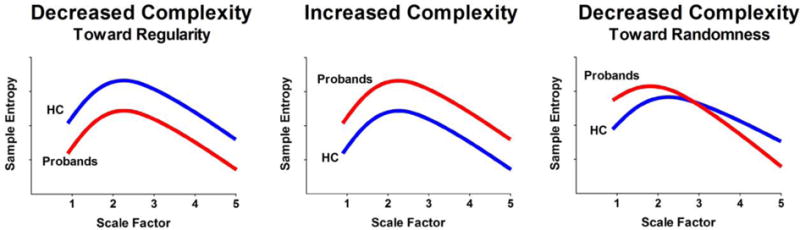
Schematic illustration of quantifying complexity of resting-state fMRI signal using multiscale entropy. Left: decreased complexity toward regularity is defined as reduced entropy of resting-state fMRI signal in probands compared to healthy control (HC) in all scale factors. Middle: increased complexity is defined as increased entropy of resting-state fMRI signal in probands compared to healthy control (HC) in all scale factors. Right: decreased complexity toward randomness is defined as increased entropy of resting-state fMRI signal in fine time scale in probands compared to healthy control (HC) and the entropy decays as the scale factor increases. Modified and reprinted with permission form (Yang et al., 2015).
2.5 Statistical analysis
Voxel-wise group differences in MSE parametric mapping were examined using an analysis of covariance (ANCOVA) model implemented within the Statistical Parametric Mapping software (version 8) adjusted for age, sex, and site. Post-hoc pair-wise t-contrasts were generated to visualize group differences in 1) respective proband groups with respect to controls and 2) between proband groups. If significant differences were noted in any proband group compared to controls then we sought to see if these regional differences were also found in their respective non-psychotic first-degree relatives. Significant brain clusters were reported if the nominal P value was less than .005 for any t test (uncorrected) on a single voxel level with a cluster size greater than 30 voxels, and further corrected by familywise-error-rate (FWE) methods at P values of less than .05 at the cluster level. Additionally, we also implemented an ANCOVA model to visualize any main effects of site across controls only and a full-factorial model across controls, probands and unaffected relatives to test for any significant diagnosis × site interactions.
3. Results
3.1 Demographic data and cognitive assessment
Table 1 shows the demographic and cognitive data of probands and HCs. There was no significant between-group difference in age, handedness, age of onset, duration of illness, and socioeconomic status by Hollingshead score. SZ patients had a significantly lower ratio of females than other groups (X2 = 28.7; P < .001). Between-group differences in probands were found in, YMRS (F = 3.65; P = .027), MADRS (F = 6.4; P = .002), PANSS (total scores; F = 21.7; P < .001), chlorpromazine (CPZ) equivalent dose (F = 4.2; P = 0.017) and BACS (composite scores; F = 13.7; P < .001). In general, when compared to HC subjects, SZ patients had the lowest cognitive performance by BACS composite scores and its subscales, followed by SAD and BP patients.
Table 1.
Demographics and clinical characteristics
| Variables | Bipolar with Psychosis (n = 125) |
Schizoaffective Disorder (n = 98) |
Schizophrenia (n = 107) |
Healthy Control (n = 156) |
||||
|---|---|---|---|---|---|---|---|---|
|
| ||||||||
| Mean | SD | Mean | SD | Mean | SD | Mean | SD | |
| Age at Scan (years) | 36.2 | 12.3 | 37.7 | 12.4 | 34.8 | 12.7 | 36.4 | 12.5 |
| Gender, Female (%) | 87 | 69.6 | 55 | 55.1 | 37 | 34.6 | 83 | 53.2 |
| Handedness, Right | 104 | 83.2 | 87 | 88.8 | 86 | 80.4 | 137 | 87.8 |
| Hollingshead Socioeconomic Score | 39.5 | 16.5 | 44.3 | 16.8 | 40.7 | 15.9 | 39.5 | 14.7 |
| Age of Illness Onset (years) | 24.1 | 9.9 | 24.1 | 9.1 | 23.6 | 8.0 | ||
| Illness Duration (years) | 15.1 | 11.6 | 17.5 | 12.1 | 14.5 | 14.0 | ||
| YMRS | 5.7 | 6.2 | 7.7 | 5.9 | 5.9 | 5.4 | ||
| MADRS | 11.0 | 9.6 | 15.3 | 13.0 | 16.6 | 24.7 | ||
| PANSS Total | 54.6 | 13.6 | 67.5 | 18.2 | 70.0 | 18.6 | ||
| PANSS Positive | 12.9 | 4.3 | 21.3 | 14.6 | 25.1 | 24.3 | ||
| PANSS Negative | 12.0 | 4.0 | 18.1 | 15.2 | 23.9 | 24.9 | ||
| PANSS General | 29.6 | 7.9 | 38.1 | 13.7 | 40.4 | 20.4 | ||
| CPZ equivalents (mg) | 319.5 | 355.3 | 520.9 | 517.3 | 503.5 | 439.1 | ||
| BACS (Z-scores) | ||||||||
| Composite Score | −0.86 | 1.29 | −1.54 | 1.31 | −1.75 | 1.36 | −0.01 | 1.13 |
| Verbal memory | −0.39 | 1.32 | −1.09 | 1.45 | −1.06 | 1.39 | −0.02 | 1.06 |
| Digital sequencing | −0.55 | 1.15 | −0.88 | 1.31 | −1.26 | 1.16 | −0.13 | 1.12 |
| Token motor | −0.95 | 1.26 | −1.40 | 1.02 | −1.29 | 1.13 | 0.08 | 1.20 |
| Verbal fluency | −0.28 | 1.21 | −0.52 | 1.12 | −0.76 | 1.21 | 0.12 | 1.04 |
| Symbol coding | −0.86 | 0.99 | −1.36 | 1.12 | −1.37 | 1.02 | −0.06 | 0.96 |
| Tower of London | −0.21 | 1.07 | −0.62 | 1.29 | −0.84 | 1.46 | −0.03 | 1.10 |
Categorical data are given as number (%); YMRS: Young Mania Rating Scale; MADRS: Montgomery–Åsberg Depression Rating Scale; PANSS: Positive and Negative Syndrome Scale; CPZ: Chlorpromazine equivalent dosage; BACS: Brief Assessment of Cognition in Schizophrenia
3.2 Probands versus control differences in resting-fMRI signal complexity
Table 2 shows the observed differences in MSE profiles of each proband group versus HCs. There was no increased complexity of resting-state fMRI signal (i.e., increased entropy in all time scales) in proband groups in any brain region compared to HCs. Proband groups showed either decreased complexity toward regularity (i.e., decreased entropy in all time scales) or toward randomness (i.e., increased entropy in fine scales followed by decay in entropy as the scale factors increase), compared to HCs. No significant differences in MSE profiles were found between proband groups.
Table 2.
Regions showing significant changes in the MSE complexity profiles of resting-state fMRI signal in probands
| Bipolar | Schizoaffective | Schizophrenia | ||||||||||||
|---|---|---|---|---|---|---|---|---|---|---|---|---|---|---|
|
| ||||||||||||||
| Increased complexity | ||||||||||||||
|
| ||||||||||||||
| Brain regiona | BA | Peak Location | kEb | Peak Z | Brain regiona | BA | Peak Location | kEb | Peak Z | Brain regiona | BA | Peak Location | kEb | Peak Z |
| None | None | None | ||||||||||||
| Decreased complexity toward regularity | ||||||||||||||
| L inferior occipital | 19 | −33, −81, −3 | 18 | 3.37 | Hypothalamus | −6, 0, −12 | 78 | 3.57 | ||||||
| R precentral | 4/6 | 36, −15, 57 | 94 | 3.78 | ||||||||||
| L superior parietal | 7 | −27, −54, 63 | 62 | 3.27 | ||||||||||
| Decreased complexity toward randomness | ||||||||||||||
| L infrior frontal | 47 | −21, 30, −12 | 194 | 3.80 | L dorsal medial frontal | 9 | 6, 51, 42 | 104 | 3.18 | L inferior frontal | 45/47 | −39, 42, −6 | 387 | 4.01 |
| L inferior frontal & antrioud cinglate | 11 | −9, 48, −12 | 152 | 3.27 | L/R ventral medial frontal | 11 | 9, 51, −24 | 83 | 3.16 | L superior frontal | 9 | −9, 51, 36 | 127 | 4.16 |
| L inferior forntal, pars triangularis | 45 | −51, 24, −21 | 72 | 3.16 | L supplentary motor | 6 | 0, 15, 69 | 68 | 3.78 | L middle frontal | 8 | −39, 27, 48 | 68 | 3.72 |
L, left; R, right; BA, Brodmann area
Voxel size is 3 × 3 × 3 mm.
All brain clusters had P value < .05 corrected for multiple comparisons using Family-wise Error Rate methods.
SZ probands showed decreased complexity toward regular signal in hypothalamus (t = −3.61). BP probands showed decreased complexity toward regular signal in left inferior occipital (t = −3.41), right precentral (t = −3.83) and left superior parietal (t = −3.31) regions. No brain region with decreased complexity toward regularity was found in SAD probands.
SZ probands showed decreased complexity toward random signal in the left inferior frontal (t = −4.29), left superior frontal (t = −4.17), and the left middle frontal cortex (t = −3.98). SAD probands showed decreased complexity toward random signal in the left dorsal medial frontal (t = −3.34), bilateral ventral medial frontal (t = −3.19), and left supplementary motor cortex (t = −3.91). BP probands showed decreased complexity toward random signal in the left inferior frontal (t = −3.80), left inferior frontal gyrus and anterior cingulate (t = −3.30), and left inferior frontal/pars triangularis (t = −3.20) (see Fig. 2).
Figure 2.
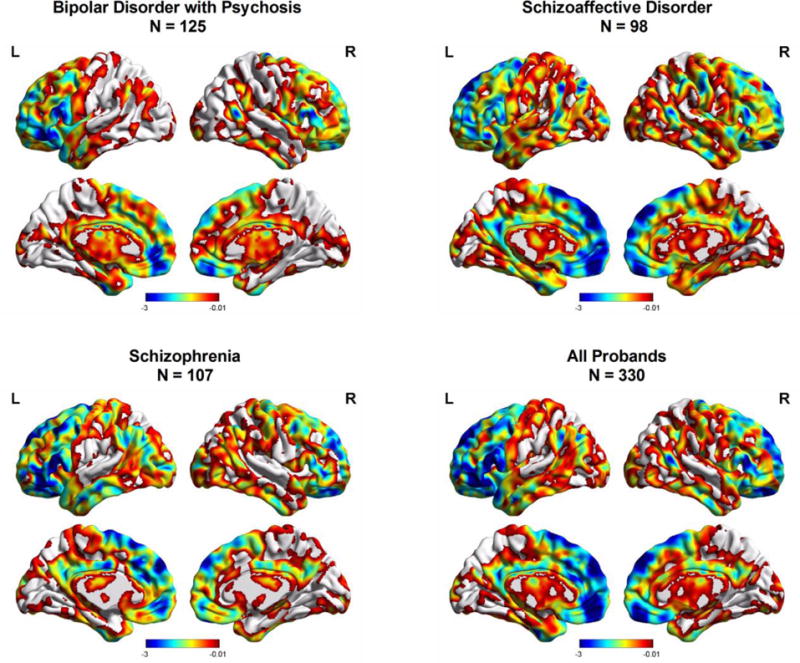
Regional differences in brain signal complexity toward randomness between probands and HCs. Color bar represents t value derived from ANCOVA of group comparisons between each proband group and HCs.
When overlaying these identified brain regions from each proband group (Fig. 3), all proband groups shared a decreased complexity toward random signal in the dorsal or ventral prefrontal cortex (PFC). Specifically, Fig. 3 shows that BP and SAD probands shared abnormal brain signal complexity in ventral medial PFC (vmPFC), BP and SZ probands shared abnormal brain signal complexity in ventral lateral PFC (vlPFC), and SAD and SZ probands shared abnormal brain signal complexity in dorsal medial PFC (dmPFC). Notably, only SZ probands showed a decreased complexity toward randomness in dorsal lateral PFC (dlPFC). Overall, SZ had the widest area of involvement in abnormal brain signal complexity in vlPFC, dmPFC, and dlPFC.
Figure 3.
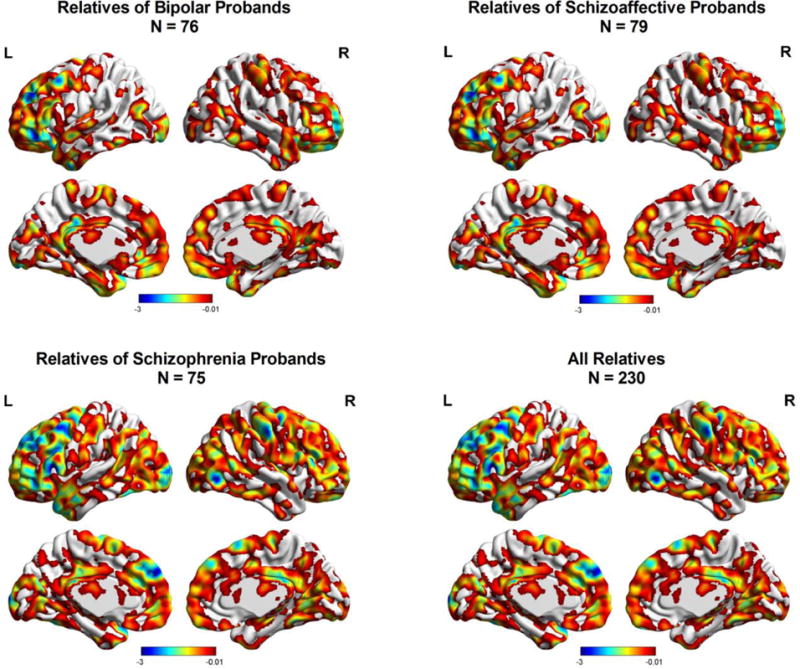
Regional differences in brain signal complexity toward randomness between relatives and HCs. Color bar represents t value derived from ANCOVA of group comparisons between each relative group and HCs.
3.3 Relatives versus control Differences in resting-fMRI signal complexity
BP, SAD, and SZ relatives did not show any significant differences in resting-fMRI signal complexity compared to controls in PFC regions. It is worth noting that SZ relatives showed a trend of decreased complexity toward random signal in dmPFC (Fig. 4; peak voxel at x = −6, y = 54, z = 33; kE = 52) but this regional difference did not survive corrections for multiple comparisons.
Figure 4.
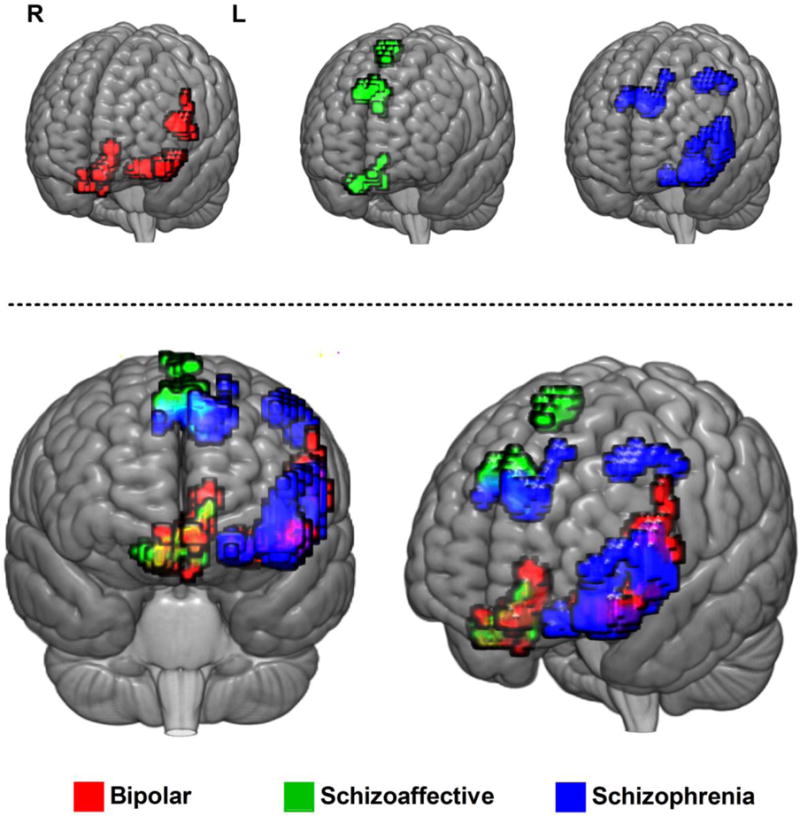
Overlay of brain regions with significantly reduced complexity of resting-state fMRI signal toward randomness in psychotic probands compared to healthy controls. Upper: Overlay of brain regions in individual diagnostic group. Lower: Overlap of brain regions between proband groups.
3.4 Correlation of MSE complexity of resting-state fMRI signal with cognition and psychopathology
The slope of entropy values across all time scales were extracted from the dorsal (peak voxel at x = −9, y = −51, z = −33; kE = 268) and ventral PFC (peak voxel at x = −48, y = 21, z = −9; kE = 858) in which these brain regions showed significant brain signal randomness when comparing all probands and HCs. We then correlated the slope of entropy values (as an indicator of brain signal randomness; more negative slope represents increased brain signal randomness) with cognitive and psychopathology measures separately in each group (Supp. Table 1 and 2). In general, the correlation level was weak when correlating brain signal randomness with psychopathology or cognitive performance, and none of correlations survived Bonferroni correction for multiple comparisons (i.e., all P > 0.003; 0.05/16 tests). When examining effects in all proband groups combined, slope of entropy values in ventral PFC was correlated positively with BACS digit sequencing (r = .133; P = .018). The strongest level of correlation was found in SAD probands between BACS digit sequencing and brain signal complexity in dorsal (r = .250, P = .016) and ventral PFC (r = .249, P = .016), indicating that increased brain signal randomness was associated with reduced cognitive performance. Of note, we did not find consistent patterns of correlations between increased brain signal complexity and psychopathology or average daily chlorpromazine (CPZ) equivalent dose.
3.5 Site effects
While sites were well matched for TR and TE values, due to variability in scanner manufacturer and a slight variation in voxel size (Hartford group used 3.4mm × 3.4mm × 5mm), global site effects across all brain regions were observed across all groups. However, no significant diagnoses by site interactions were observed for any comparisons. The absence of interactions suggests that the MSE differences are robust against site effects.
3.6 Medication effects
We did not find the main effect of average dose of CPZ equivalents in regional differences between proband groups.
4. Discussion
With MSE analysis, we quantified pathologic processes of resting-state fMRI signal that exhibited either increased regularity or increased randomness. The key finding emerging from this study is that psychotic probands (e.g., psychotic BP, SAD, and SZ) showed either decreased complexity toward regularity or randomness in various brain regions. Essentially, psychotic probands differentially shared pathologically decreased complexity of resting-state fMRI signal toward randomness in the vmPFC, vlPFC, or dmPFC, and only SZ patients exhibited increased brain signal randomness in dlPFC. The abnormal changes in brain signal complexity in the PFC regions of psychotic probands were not seen in their non-psychotic relatives, suggesting that the alteration of brain signal complexity in the PFC region may be an illness marker rather than a familial trait. Furthermore, we found that the increased brain signal randomness was associated with reduced cognitive performance in psychotic probands.
Collectively, these observations are in line with the loss of brain complexity hypothesis (Yang and Tsai, 2013) that brain signal oscillations in mental illness may exhibit pathologic dynamics toward regularity or randomness, and suggest that measures of brain signal complexity may serve as novel translational neuroimaging biomarkers that can potentially shed new insights into the pathophysiology of psychotic disorders. Recent approaches to psychiatric classification such as Research Domain Criteria (RDoC) have moved toward characterization of biomarkers that cut across symptom-based diagnoses but map on to translational domains from cellular to circuitry and behavioral levels (Insel, 2014). Our observations that alterations in brain signal complexity cut across DSM diagnoses, suggests that they are worth further investigation using the RDoC paradigms.
4.1 Clinical implications of altered complexity of resting-state fMRI signal in psychosis
A significant body of research has shown that SZ and BP share substantial overlap in clinical features, as well as in contributing genetic factors (Lichtenstein et al., 2009), and these two disorders may share some underlying neural substrates. The findings in the current work extend prior observations of abnormal brain signal complexity in SZ patients (Bassett et al., 2012; Sokunbi et al., 2014; Takahashi et al., 2010; Yang et al., 2015) to other primary psychotic disorders showing that increased randomness of resting-state fMRI signal in psychotic probands was consistently observed in various PFC regions across disorders (Table 2). Affected regions partially overlapped between diagnostic groups (Fig. 4), suggesting a pivotal role of brain signal dysregulation in the PFC region and relevant diagnostic overlap observed in psychotic spectrum disorders.
Prior B-SNIP studies have shown shared aberrant functional connectivity in SZ and BP probands in meso/paralimbic or posterior default mode networks, and also found other networks that are unique to the individual proband groups (Khadka et al., 2013; Meda et al., 2012). For example, midbrain/cerebellum and frontal-temporal/paralimbic were unique to SZ probands (Khadka et al., 2013), while paralimbic circuit was uniquely associated with BP probands (Meda et al., 2012).
Our analyses based on temporal brain signal dynamics also revealed important overlap/non-overlap patterns between proband groups. First, both SZ and BP showed increased brain signal randomness in vlPFC, a brain region that is associated with the selection and maintenance of goal-relevant item information (Blumenfeld et al., 2013), and SAD and BP showed increased brain signal randomness in vmPFC, a brain region that is associated with social decision making (van den Bos and Guroglu, 2009), theory of mind (Leopold et al., 2012), as well as generating (Koenigs et al., 2007) or regulating emotions (Koenigs et al., 2007; Phillips et al., 2008; Ritter et al., 2004). Although we did not find the consistent patterns of correlations between increased brain signal randomness and psychopathology, the overlap between SAD and BP in vmPFC may explain the clinical similarity of mood dysregulation exhibited in both disorders, and the overlap between SZ and BP in vlPFC may be associated with reduced working memory commonly seen in the broader category of psychotic disorders (Glahn et al., 2005; Hill et al., 2015).
The findings in abnormal brain signal complexity in ventral PFC may also add to prior research based on task-based fMRI or functional connectivity studies. Task-based fMRI studies have observed elevated activations in vlPFC in BP patients during an emotional Go-NoGo task (Elliott et al., 2004) and while viewing emotional faces (Lawrence et al., 2004), suggesting that dysfunction of the vlPFC may underlie the deficit in mood regulation in BP patients. On the other hand, meta-analysis of task-based fMRI studies found that the most consistent reductions in task-related activation in SZ patients during encoding and retrieval were in the both dlPFC and vlPFC (Ragland et al., 2009). A prior resting-state fMRI study showed that altered functional connectivity between brain networks involved in cognitive and emotional processing was found in BP and SZ patients (Mamah et al., 2013).
Second, SAD and SZ share increased brain signal randomness in dmPFC, a brain region that is related to errors, near-misses, and response conflict (Modirrousta and Fellows, 2008). In contrast, only SZ showed increased brain signal randomness in dlPFC, a brain region that is consistently involved in decision making (Greene et al., 2001) and working memory (Barbey et al., 2013). The additional involvement of the dlPFC in SZ alone with the overlap between SZ and SAD in dmPFC may explain the greater impairment of cognitive performance in SZ compared to SAD that is observed in certain clinical samples (Bora et al., 2009), and is evidenced by ANOVA analysis of BACS in the current study.
4.2 Association of brain signal complexity with cognitive and behavioral measures
A recent systematic review of cognition in SZ and BP found that overall both SZ and BP patients present deficits on all neurocognitive measures compared to healthy controls (Hill et al., 2015; Hill et al., 2013; Vohringer et al., 2013). In particular, SZ patients showed more severe and pervasive cognitive deficits while BD patients present a milder and more confined impairment. Prior B-SNIP analysis showed that the excessive connectivity within brain networks coupled to the dlPFC and medial PFC was associated with cognitive deficits in persons at risk for SZ (Unschuld et al., 2014). We found a modest association between brain signal randomness in the dorsal or ventral PFC and the BACS digit span. However, we were unable to find consistent patterns of correlations between abnormal brain signal complexity and any of the symptom dimensions. These findings are consistent with our recent study (Clementz et al., 2016), in which three distinct Biotypes of psychosis were identified that did not conform to traditional symptom-based diagnostic criteria but were associated with distinct severity of cognitive deficits. Therefore, our finding of modest associations of BACS with brain complexity by DSM diagnostic groups may warrant future studies to investigate the neurocognitive correlates of brain complexity based on novel categorization of patients, such as Biotypes (Clementz et al., 2016).
4.3 How brain signal complexity analysis can help understand the complex brain functions?
The advance in pathophysiology of mental illness has been hampered by a lack of biological markers (Singh and Rose, 2009). Despite substantial effort, the causes of numerous psychiatric disorders remain unclear; even precisely categorizing such disorders has been difficult. The diagnostic systems in psychiatry have mostly relied on descriptive phenomenology rather than their biological mechanisms, etiology, and possible genotypes. Increasingly, neuroimaging studies have established a better understanding of the complex brain functions in both healthy and pathological mental conditions, which include the Human Connectome Project (Van Essen et al., 2013), Autism Brain Imaging Data Exchange (Di Martino et al., 2014), or Bipolar & Schizophrenia Network on Intermediate Phenotypes (Tamminga et al., 2013). To understand the complex brain data, an approach that integrates mathematics, physics, and neuroscience is required. Complexity theory may have the potential to add a new dimension and provide a crucial tool to extract fundamental features from large nonlinear, spatio-temporal neuroimaging data at multiple levels. In fact, the overlap and non-overlap of brain regions with abnormal brain signal complexity between psychotic disorders by DSM diagnoses suggest a novel RDoC approach to potentially improve the DSM diagnoses by incorporating neuroimaging markers.
In recent years, advances in nonlinear dynamics have provided new analysis methods for measuring subtle changes in complex neurophysiological signals, thereby opening a new window through which to study the neurobiology of psychiatric disorders and potentially, for more clinically relevant assessments. Measures of complexity (including those developed in our research) have provided a useful tool for differentiating people of different age groups (McIntosh et al., 2008; McIntosh et al., 2014; Smith et al., 2014; Takahashi et al., 2009; Vakorin et al., 2011; Yang et al., 2013a) and with different clinical disorders including Alzheimer’s disease (Escudero et al., 2006; Mizuno et al., 2010; Yang et al., 2013b), autism (Bosl et al., 2011; Catarino et al., 2011; Ghanbari et al., 2015), attention deficit hyperactivity disorder (Gomez et al., 2013; Sokunbi et al., 2013), depression (Mendez et al., 2012; Niemiec and Lithgow, 2005; Saletu et al., 2010), SZ (Fernandez et al., 2011; Sokunbi et al., 2014; Takahashi et al., 2010; Yang et al., 2015), and traumatic brain injury (Lu et al., 2012; Raja Beharelle et al., 2012). Of note, the interpretation of complexity is often by the simple up vs. down approach in a single time scale along the continuum of regularity toward randomness, leading to the confusing conclusion that randomness is complex. Therefore, such simple up vs. down definitions of complexity need to be substantially revised with incorporation of multiple scales inherent in complex systems. In terms of the information theory, regularity is associated with the limited information content relative to meaningful complexity while randomness represents the reduced information flow across different scales. The categorization of resting-state fMRI signal into regularity and randomness as two ways of decreasing complexity provides a qualitative approach to pathologic changes in brain signal complexity. In this context, the analysis of brain signal complexity provides a useful and promising tool for clinical psychiatry that may benefit the evaluation of the disease process or treatment outcome. Furthermore, understanding the possible mechanisms of healthy complexity is important both at the basic scientific level and at the practical level, at which clinical interventions can be proposed to maintain or restore the dynamical complexity via stochastic resonance mechanism (Costa et al., 2007; Sejdic and Lipsitz, 2013).
4.4 Limitations
An important limitation of our study is that the majority of probands were on medications, and the effects of antipsychotics and other psychotropic drugs on brain complexity measures cannot be completely ruled out, though we did not see any correlations between CPZ equivalents and complexity measures. Previous studies have shown similar reductions in brain nonlinear complexity measures in antipsychotic naïve first episode SZ patients (Keshavan et al., 2004), but few data exist in other psychotic disorders. Future studies need to investigate untreated and treated patients across both early chronic phases of psychotic disorders.
Site effects are a potential limitation, but no site by diagnosis interactions were seen. It is important to note that while no diagnosis by site interactions were found, the significant main effect of different site manufacturers should not be ignored. In addition, resting-state fMRI data are also highly sensitive to motion artifacts, but we took care to exclude scans with significant motion. Recent development in denoising resting-state fMRI data by independent component analysis (ICA) and FIX algorithm (Oxford Centre for Functional MRI of the Brain’s ICA-based X-noiseifier) may help to tackle the challenge of motion artifacts (Salimi-Khorshidi et al., 2014).
The slope measure captures MSE profile only in a first-order level and may overlook second order trends in the profile. The improvement of profiling MSE complexity toward randomness could be achieved by incorporating higher order polynomial trends and a broader range of scales when analyzing longer resting-state fMRI time series.
The findings in this study are partly consistent with prior MSE analysis of resting-state fMRI signal in SZ patients (Yang et al., 2015) that increased randomness of resting-state fMRI signal was found in dorsal and ventral lateral prefrontal cortex. However, the findings from other brain regions were inconsistent, possibly due to population differences, i.e. ethnic difference or the older SZ patients in Yang et al., 2015. Nevertheless, the findings of increased randomness of resting-state fMRI signal in the prefrontal region are consistent across studies and warrants a meta-analytic investigation of MSE-based fMRI analysis in the future.
5. Conclusion
Our observations of the overlap in brain complexity patterns between DSM IV psychotic disorders were not surprising, consistent with findings with several other biomarker investigations (Tamminga et al., 2013). Recent investigations by our group using taxometric approaches to biomarker data applies agnostic to DSM categories have revealed Biotypes that did not map on to clinical diagnoses; rather the distinctiveness of these Biotypes was supported by external validating criteria such as brain structural data, social functioning and family history (Clementz et al., 2016). Further analysis is needed to see whether brain complexity measures differ across such Biotypes. Finally, as pointed out in Clementz et al., 2016, psychosis may be a final endpoint for multiple psychotogenic etiologies, as congestive heart failure is a common endpoint of various medical disorders. Alternatively, resting-state brain oscillations in severe mental illness could exhibit pathological dynamics as seen in severe cardiovascular diseases, such as reduced heart rate variability in congestive heart failure or increased irregularity in atrial fibrillation. The biological mechanisms underlying abnormal brain signal complexity will be of importance in future studies to understand the pathophysiology of psychosis.
Supplementary Material
Highlights.
Multiscale entropy quantifies pathologic brain signal dynamics of regularity or randomness.
Psychotic probands show increased brain signal randomness in the prefrontal cortex.
Increased brain signal randomness is associated with reduced cognitive functions.
Psychotic probands partially overlap in prefrontal cortex by DSM diagnoses.
Footnotes
Publisher's Disclaimer: This is a PDF file of an unedited manuscript that has been accepted for publication. As a service to our customers we are providing this early version of the manuscript. The manuscript will undergo copyediting, typesetting, and review of the resulting proof before it is published in its final citable form. Please note that during the production process errors may be discovered which could affect the content, and all legal disclaimers that apply to the journal pertain.
References
- Anokhin AP, Muller V, Lindenberger U, Heath AC, Myers E. Genetic influences on dynamic complexity of brain oscillations. Neuroscience letters. 2006;397:93–98. doi: 10.1016/j.neulet.2005.12.025. [DOI] [PMC free article] [PubMed] [Google Scholar]
- Bahrami B, Seyedsadjadi R, Babadi B, Noroozian M. Brain complexity increases in mania. Neuroreport. 2005;16:187–191. doi: 10.1097/00001756-200502080-00025. [DOI] [PubMed] [Google Scholar]
- Barbey AK, Koenigs M, Grafman J. Dorsolateral prefrontal contributions to human working memory. Cortex; a journal devoted to the study of the nervous system and behavior. 2013;49:1195–1205. doi: 10.1016/j.cortex.2012.05.022. [DOI] [PMC free article] [PubMed] [Google Scholar]
- Bassett DS, Nelson BG, Mueller BA, Camchong J, Lim KO. Altered resting state complexity in schizophrenia. NeuroImage. 2012;59:2196–2207. doi: 10.1016/j.neuroimage.2011.10.002. [DOI] [PMC free article] [PubMed] [Google Scholar]
- Blumenfeld RS, Nomura EM, Gratton C, D’Esposito M. Lateral prefrontal cortex is organized into parallel dorsal and ventral streams along the rostro-caudal axis. Cereb Cortex. 2013;23:2457–2466. doi: 10.1093/cercor/bhs223. [DOI] [PMC free article] [PubMed] [Google Scholar]
- Bora E, Yucel M, Pantelis C. Cognitive functioning in schizophrenia, schizoaffective disorder and affective psychoses: meta-analytic study. The British journal of psychiatry: the journal of mental science. 2009;195:475–482. doi: 10.1192/bjp.bp.108.055731. [DOI] [PubMed] [Google Scholar]
- Bosl W, Tierney A, Tager-Flusberg H, Nelson C. EEG complexity as a biomarker for autism spectrum disorder risk. BMC medicine. 2011;9:18. doi: 10.1186/1741-7015-9-18. [DOI] [PMC free article] [PubMed] [Google Scholar]
- Catarino A, Churches O, Baron-Cohen S, Andrade A, Ring H. Atypical EEG complexity in autism spectrum conditions: a multiscale entropy analysis. Clin Neurophysiol. 2011;122:2375–2383. doi: 10.1016/j.clinph.2011.05.004. [DOI] [PubMed] [Google Scholar]
- Chao-Gan Y, Yu-Feng Z. DPARSF: A MATLAB Toolbox for “Pipeline” Data Analysis of Resting-State fMRI. Frontiers in systems neuroscience. 2010;4:13. doi: 10.3389/fnsys.2010.00013. [DOI] [PMC free article] [PubMed] [Google Scholar]
- Clementz BA, Sweeney JA, Hamm JP, Ivleva EI, Ethridge LE, Pearlson GD, Keshavan MS, Tamminga CA. Identification of Distinct Psychosis Biotypes Using Brain-Based Biomarkers. The American journal of psychiatry. 2016;173:373–384. doi: 10.1176/appi.ajp.2015.14091200. [DOI] [PMC free article] [PubMed] [Google Scholar]
- Costa M, Goldberger AL, Peng CK. Multiscale entropy analysis of complex physiologic time series. Physical review letters. 2002;89:068102. doi: 10.1103/PhysRevLett.89.068102. [DOI] [PubMed] [Google Scholar]
- Costa M, Goldberger AL, Peng CK. Multiscale entropy analysis of biological signals. Physical review. 2005;71:021906. doi: 10.1103/PhysRevE.71.021906. [DOI] [PubMed] [Google Scholar]
- Costa M, Peng CK, Goldberger AL, Hausdorff JM. Multiscale entropy analysis of human gait dynamics. Physica A. 2003;330:53–60. doi: 10.1016/j.physa.2003.08.022. [DOI] [PMC free article] [PubMed] [Google Scholar]
- Costa M, Priplata AA, Lipsitz LA, Wu Z, Huang NE, Goldberger AL, Peng CK. Noise and poise: Enhancement of postural complexity in the elderly with a stochastic-resonance-based therapy. Europhysics letters. 2007;77:68008. doi: 10.1209/0295-5075/77/68008. [DOI] [PMC free article] [PubMed] [Google Scholar]
- Di Martino A, Yan CG, Li Q, Denio E, Castellanos FX, Alaerts K, Anderson JS, Assaf M, Bookheimer SY, Dapretto M, Deen B, Delmonte S, Dinstein I, Ertl-Wagner B, Fair DA, Gallagher L, Kennedy DP, Keown CL, Keysers C, Lainhart JE, Lord C, Luna B, Menon V, Minshew NJ, Monk CS, Mueller S, Muller RA, Nebel MB, Nigg JT, O’Hearn K, Pelphrey KA, Peltier SJ, Rudie JD, Sunaert S, Thioux M, Tyszka JM, Uddin LQ, Verhoeven JS, Wenderoth N, Wiggins JL, Mostofsky SH, Milham MP. The autism brain imaging data exchange: towards a large-scale evaluation of the intrinsic brain architecture in autism. Molecular psychiatry. 2014;19:659–667. doi: 10.1038/mp.2013.78. [DOI] [PMC free article] [PubMed] [Google Scholar]
- Elliott R, Ogilvie A, Rubinsztein JS, Calderon G, Dolan RJ, Sahakian BJ. Abnormal ventral frontal response during performance of an affective go/no go task in patients with mania. Biological psychiatry. 2004;55:1163–1170. doi: 10.1016/j.biopsych.2004.03.007. [DOI] [PubMed] [Google Scholar]
- Escudero J, Abasolo D, Hornero R, Espino P, Lopez M. Analysis of electroencephalograms in Alzheimer’s disease patients with multiscale entropy. Physiological measurement. 2006;27:1091–1106. doi: 10.1088/0967-3334/27/11/004. [DOI] [PubMed] [Google Scholar]
- Fernandez A, Gomez C, Hornero R, Lopez-Ibor JJ. Complexity and schizophrenia. Progress in neuro-psychopharmacology & biological psychiatry. 2013;45:267–276. doi: 10.1016/j.pnpbp.2012.03.015. [DOI] [PubMed] [Google Scholar]
- Fernandez A, Lopez-Ibor MI, Turrero A, Santos JM, Moron MD, Hornero R, Gomez C, Mendez MA, Ortiz T, Lopez-Ibor JJ. Lempel-Ziv complexity in schizophrenia: a MEG study. Clin Neurophysiol. 2011;122:2227–2235. doi: 10.1016/j.clinph.2011.04.011. [DOI] [PubMed] [Google Scholar]
- First MB, Sptzer RL, Gibbon M, Williams JBW. Structured Clinical Interview for DSM-IV Axis I Disorders. American Psychiatric Publishing; Arlington, VA: 1997. [Google Scholar]
- Ghanbari Y, Bloy L, Christopher Edgar J, Blaskey L, Verma R, Roberts TP. Joint analysis of band-specific functional connectivity and signal complexity in autism. Journal of autism and developmental disorders. 2015;45:444–460. doi: 10.1007/s10803-013-1915-7. [DOI] [PMC free article] [PubMed] [Google Scholar]
- Glahn DC, Ragland JD, Abramoff A, Barrett J, Laird AR, Bearden CE, Velligan DI. Beyond hypofrontality: a quantitative meta-analysis of functional neuroimaging studies of working memory in schizophrenia. Hum Brain Mapp. 2005;25:60–69. doi: 10.1002/hbm.20138. [DOI] [PMC free article] [PubMed] [Google Scholar]
- Goldberger AL, Amaral LA, Hausdorff JM, Ivanov P, Peng CK, Stanley HE. Fractal dynamics in physiology: alterations with disease and aging. Proceedings of the National Academy of Sciences of the United States of America. 2002a;99(Suppl 1):2466–2472. doi: 10.1073/pnas.012579499. [DOI] [PMC free article] [PubMed] [Google Scholar]
- Goldberger AL, Peng CK, Lipsitz LA. What is physiologic complexity and how does it change with aging and disease? Neurobiology of aging. 2002b;23:23–26. doi: 10.1016/s0197-4580(01)00266-4. [DOI] [PubMed] [Google Scholar]
- Gomez C, Poza J, Fernandez A, Bachiller A, Gomez J, Hornero R. Entropy analysis of MEG background activity in attention-deficit/hyperactivity disorder. Conference proceedings : … Annual International Conference of the IEEE Engineering in Medicine and Biology Society. IEEE Engineering in Medicine and Biology Society. Conference. 2013;2013:5057–5060. doi: 10.1109/EMBC.2013.6610685. [DOI] [PubMed] [Google Scholar]
- Gottschalk A, Bauer MS, Whybrow PC. Evidence of chaotic mood variation in bipolar disorder. Archives of general psychiatry. 1995;52:947–959. doi: 10.1001/archpsyc.1995.03950230061009. [DOI] [PubMed] [Google Scholar]
- Greene JD, Sommerville RB, Nystrom LE, Darley JM, Cohen JD. An fMRI investigation of emotional engagement in moral judgment. Science. 2001;293:2105–2108. doi: 10.1126/science.1062872. [DOI] [PubMed] [Google Scholar]
- Hill KS, Buchholz A, Amsbaugh H, Reilly JL, Rubin LH, Gold JM, Keefe RS, Pearlson GD, Keshavan MS, Tamminga CA, Sweeney JA. Working memory impairment in probands with schizoaffective disorder and first degree relatives of schizophrenia probands extend beyond deficits predicted by generalized neuropsychological impairment. Schizophrenia research. 2015;166:310–315. doi: 10.1016/j.schres.2015.05.018. [DOI] [PMC free article] [PubMed] [Google Scholar]
- Hill SK, Reilly JL, Keefe RS, Gold JM, Bishop JR, Gershon ES, Tamminga CA, Pearlson GD, Keshavan MS, Sweeney JA. Neuropsychological impairments in schizophrenia and psychotic bipolar disorder: findings from the Bipolar-Schizophrenia Network on Intermediate Phenotypes (B-SNIP) study. The American journal of psychiatry. 2013;170:1275–1284. doi: 10.1176/appi.ajp.2013.12101298. [DOI] [PMC free article] [PubMed] [Google Scholar]
- Insel TR. The NIMH Research Domain Criteria (RDoC) Project: precision medicine for psychiatry. The American journal of psychiatry. 2014;171:395–397. doi: 10.1176/appi.ajp.2014.14020138. [DOI] [PubMed] [Google Scholar]
- Istenic R, Kaplanis PA, Pattichis CS, Zazula D. Multiscale entropy-based approach to automated surface EMG classification of neuromuscular disorders. Medical & biological engineering & computing. 2010;48:773–781. doi: 10.1007/s11517-010-0629-7. [DOI] [PubMed] [Google Scholar]
- Keefe RS, Goldberg TE, Harvey PD, Gold JM, Poe MP, Coughenour L. The Brief Assessment of Cognition in Schizophrenia: reliability, sensitivity, and comparison with a standard neurocognitive battery. Schizophrenia research. 2004;68:283–297. doi: 10.1016/j.schres.2003.09.011. [DOI] [PubMed] [Google Scholar]
- Keefe RS, Harvey PD, Goldberg TE, Gold JM, Walker TM, Kennel C, Hawkins K. Norms and standardization of the Brief Assessment of Cognition in Schizophrenia (BACS) Schizophrenia research. 2008;102:108–115. doi: 10.1016/j.schres.2008.03.024. [DOI] [PubMed] [Google Scholar]
- Keshavan MS, Cashmere JD, Miewald J, Yeragani VK. Decreased nonlinear complexity and chaos during sleep in first episode schizophrenia: a preliminary report. Schizophrenia research. 2004;71:263–272. doi: 10.1016/j.schres.2004.02.015. [DOI] [PubMed] [Google Scholar]
- Khadka S, Meda SA, Stevens MC, Glahn DC, Calhoun VD, Sweeney JA, Tamminga CA, Keshavan MS, O’Neil K, Schretlen D, Pearlson GD. Is aberrant functional connectivity a psychosis endophenotype? A resting state functional magnetic resonance imaging study. Biological psychiatry. 2013;74:458–466. doi: 10.1016/j.biopsych.2013.04.024. [DOI] [PMC free article] [PubMed] [Google Scholar]
- Koenigs M, Young L, Adolphs R, Tranel D, Cushman F, Hauser M, Damasio A. Damage to the prefrontal cortex increases utilitarian moral judgements. Nature. 2007;446:908–911. doi: 10.1038/nature05631. [DOI] [PMC free article] [PubMed] [Google Scholar]
- Lawrence NS, Williams AM, Surguladze S, Giampietro V, Brammer MJ, Andrew C, Frangou S, Ecker C, Phillips ML. Subcortical and ventral prefrontal cortical neural responses to facial expressions distinguish patients with bipolar disorder and major depression. Biological psychiatry. 2004;55:578–587. doi: 10.1016/j.biopsych.2003.11.017. [DOI] [PubMed] [Google Scholar]
- Leopold A, Krueger F, dal Monte O, Pardini M, Pulaski SJ, Solomon J, Grafman J. Damage to the left ventromedial prefrontal cortex impacts affective theory of mind. Social cognitive and affective neuroscience. 2012;7:871–880. doi: 10.1093/scan/nsr071. [DOI] [PMC free article] [PubMed] [Google Scholar]
- Lichtenstein P, Yip BH, Bjork C, Pawitan Y, Cannon TD, Sullivan PF, Hultman CM. Common genetic determinants of schizophrenia and bipolar disorder in Swedish families: a population-based study. Lancet. 2009;373:234–239. doi: 10.1016/S0140-6736(09)60072-6. [DOI] [PMC free article] [PubMed] [Google Scholar]
- Lipsitz LA. Dynamics of stability: the physiologic basis of functional health and frailty. The journals of gerontology. Series A, Biological sciences and medical sciences. 2002;57:B115–125. doi: 10.1093/gerona/57.3.b115. [DOI] [PubMed] [Google Scholar]
- Lu CW, Czosnyka M, Shieh JS, Smielewska A, Pickard JD, Smielewski P. Complexity of intracranial pressure correlates with outcome after traumatic brain injury. Brain. 2012;135:2399–2408. doi: 10.1093/brain/aws155. [DOI] [PMC free article] [PubMed] [Google Scholar]
- Mamah D, Barch DM, Repovs G. Resting state functional connectivity of five neural networks in bipolar disorder and schizophrenia. Journal of affective disorders. 2013;150:601–609. doi: 10.1016/j.jad.2013.01.051. [DOI] [PMC free article] [PubMed] [Google Scholar]
- McDonough IM, Nashiro K. Network complexity as a measure of information processing across resting-state networks: evidence from the Human Connectome Project. Frontiers in human neuroscience. 2014;8:409. doi: 10.3389/fnhum.2014.00409. [DOI] [PMC free article] [PubMed] [Google Scholar]
- McIntosh AM, Whalley HC, McKirdy J, Hall J, Sussmann JE, Shankar P, Johnstone EC, Lawrie SM. Prefrontal function and activation in bipolar disorder and schizophrenia. The American journal of psychiatry. 2008;165:378–384. doi: 10.1176/appi.ajp.2007.07020365. [DOI] [PubMed] [Google Scholar]
- McIntosh AR, Vakorin V, Kovacevic N, Wang H, Diaconescu A, Protzner AB. Spatiotemporal Dependency of Age-Related Changes in Brain Signal Variability. Cereb Cortex. 2014;24:1806–1817. doi: 10.1093/cercor/bht030. [DOI] [PMC free article] [PubMed] [Google Scholar]
- Meda SA, Gill A, Stevens MC, Lorenzoni RP, Glahn DC, Calhoun VD, Sweeney JA, Tamminga CA, Keshavan MS, Thaker G, Pearlson GD. Differences in resting-state functional magnetic resonance imaging functional network connectivity between schizophrenia and psychotic bipolar probands and their unaffected first-degree relatives. Biological psychiatry. 2012;71:881–889. doi: 10.1016/j.biopsych.2012.01.025. [DOI] [PMC free article] [PubMed] [Google Scholar]
- Mendez MA, Zuluaga P, Hornero R, Gomez C, Escudero J, Rodriguez-Palancas A, Ortiz T, Fernandez A. Complexity analysis of spontaneous brain activity: effects of depression and antidepressant treatment. Journal of psychopharmacology. 2012;26:636–643. doi: 10.1177/0269881111408966. [DOI] [PubMed] [Google Scholar]
- Mizuno T, Takahashi T, Cho RY, Kikuchi M, Murata T, Takahashi K, Wada Y. Assessment of EEG dynamical complexity in Alzheimer’s disease using multiscale entropy. Clin Neurophysiol. 2010;121:1438–1446. doi: 10.1016/j.clinph.2010.03.025. [DOI] [PMC free article] [PubMed] [Google Scholar]
- Modirrousta M, Fellows LK. Dorsal medial prefrontal cortex plays a necessary role in rapid error prediction in humans. J Neurosci. 2008;28:14000–14005. doi: 10.1523/JNEUROSCI.4450-08.2008. [DOI] [PMC free article] [PubMed] [Google Scholar]
- Narr KL, Bilder RM, Kim S, Thompson PM, Szeszko P, Robinson D, Luders E, Toga AW. Abnormal gyral complexity in first-episode schizophrenia. Biological psychiatry. 2004;55:859–867. doi: 10.1016/j.biopsych.2003.12.027. [DOI] [PubMed] [Google Scholar]
- Niemiec A, Lithgow B. Alpha-band characteristics in EEG spectrum indicate reliability of frontal brain asymmetry measures in diagnosis of depression. Conference proceedings : … Annual International Conference of the IEEE Engineering in Medicine and Biology Society. IEEE Engineering in Medicine and Biology Society. Conference. 2005;7:7517–7520. doi: 10.1109/IEMBS.2005.1616251. [DOI] [PubMed] [Google Scholar]
- Park JH, Kim S, Kim CH, Cichocki A, Kim K. Multiscale entropy analysis of EEG fom patients under different pathological conditions. Fractals. 2007;15:399–404. [Google Scholar]
- Paulus MP, Braff DL. Chaos and schizophrenia: does the method fit the madness? Biological psychiatry. 2003;53:3–11. doi: 10.1016/s0006-3223(02)01701-8. [DOI] [PubMed] [Google Scholar]
- Paulus MP, Geyer MA, Braff DL. Use of methods from chaos theory to quantify a fundamental dysfunction in the behavioral organization of schizophrenic patients. The American journal of psychiatry. 1996;153:714–717. doi: 10.1176/ajp.153.5.714. [DOI] [PubMed] [Google Scholar]
- Phillips ML, Ladouceur CD, Drevets WC. A neural model of voluntary and automatic emotion regulation: implications for understanding the pathophysiology and neurodevelopment of bipolar disorder. Molecular psychiatry. 2008;13(829):833–857. doi: 10.1038/mp.2008.65. [DOI] [PMC free article] [PubMed] [Google Scholar]
- Pincus SM. Approximate entropy as a measure of system complexity. Proceedings of the National Academy of Sciences of the United States of America. 1991;88:2297–2301. doi: 10.1073/pnas.88.6.2297. [DOI] [PMC free article] [PubMed] [Google Scholar]
- Protzner AB, Valiante TA, Kovacevic N, McCormick C, McAndrews MP. Hippocampal signal complexity in mesial temporal lobe epilepsy: a noisy brain is a healthy brain. Archives italiennes de biologie. 2011;148:289–297. [PubMed] [Google Scholar]
- Ragland JD, Laird AR, Ranganath C, Blumenfeld RS, Gonzales SM, Glahn DC. Prefrontal activation deficits during episodic memory in schizophrenia. The American journal of psychiatry. 2009;166:863–874. doi: 10.1176/appi.ajp.2009.08091307. [DOI] [PMC free article] [PubMed] [Google Scholar]
- Raja Beharelle A, Kovacevic N, McIntosh AR, Levine B. Brain signal variability relates to stability of behavior after recovery from diffuse brain injury. NeuroImage. 2012;60:1528–1537. doi: 10.1016/j.neuroimage.2012.01.037. [DOI] [PMC free article] [PubMed] [Google Scholar]
- Richman JS, Moorman JR. Physiological time-series analysis using approximate entropy and sample entropy. American journal of physiology. 2000;278:H2039–2049. doi: 10.1152/ajpheart.2000.278.6.H2039. [DOI] [PubMed] [Google Scholar]
- Ritter LM, Meador-Woodruff JH, Dalack GW. Neurocognitive measures of prefrontal cortical dysfunction in schizophrenia. Schizophrenia research. 2004;68:65–73. doi: 10.1016/S0920-9964(03)00086-0. [DOI] [PubMed] [Google Scholar]
- Rosso OA, Martin MT, Plastino A. Brain electrical activity analysis using wavelet-based informational tools. Physica A. 2002;313:587–608. [Google Scholar]
- Saletu B, Anderer P, Saletu-Zyhlarz GM. EEG topography and tomography (LORETA) in diagnosis and pharmacotherapy of depression. Clinical EEG and neuroscience. 2010;41:203–210. doi: 10.1177/155005941004100407. [DOI] [PubMed] [Google Scholar]
- Salimi-Khorshidi G, Douaud G, Beckmann CF, Glasser MF, Griffanti L, Smith SM. Automatic denoising of functional MRI data: combining independent component analysis and hierarchical fusion of classifiers. NeuroImage. 2014;90:449–468. doi: 10.1016/j.neuroimage.2013.11.046. [DOI] [PMC free article] [PubMed] [Google Scholar]
- Schmid GB. Chaos theory and schizophrenia: elementary aspects. Psychopathology. 1991;24:185–198. doi: 10.1159/000284713. [DOI] [PubMed] [Google Scholar]
- Sejdic E, Lipsitz LA. Necessity of noise in physiology and medicine. Computer methods and programs in biomedicine. 2013;111:459–470. doi: 10.1016/j.cmpb.2013.03.014. [DOI] [PMC free article] [PubMed] [Google Scholar]
- Singh I, Rose N. Biomarkers in psychiatry. Nature. 2009;460:202–207. doi: 10.1038/460202a. [DOI] [PubMed] [Google Scholar]
- Smith RX, Yan L, Wang DJ. Multiple time scale complexity analysis of resting state FMRI. Brain imaging and behavior. 2014;8:284–291. doi: 10.1007/s11682-013-9276-6. [DOI] [PMC free article] [PubMed] [Google Scholar]
- Sokunbi MO, Fung W, Sawlani V, Choppin S, Linden DE, Thome J. Resting state fMRI entropy probes complexity of brain activity in adults with ADHD. Psychiatry research. 2013;214:341–348. doi: 10.1016/j.pscychresns.2013.10.001. [DOI] [PubMed] [Google Scholar]
- Sokunbi MO, Gradin VB, Waiter GD, Cameron GG, Ahearn TS, Murray AD, Steele DJ, Staff RT. Nonlinear complexity analysis of brain FMRI signals in schizophrenia. PloS one. 2014;9:e95146. doi: 10.1371/journal.pone.0095146. [DOI] [PMC free article] [PubMed] [Google Scholar]
- Tabachnick BG, Fidell LS. Using multivariate statistics. 5th. Allyn & Bacon; Boston, MA: 2007. [Google Scholar]
- Takahashi T. Complexity of spontaneous brain activity in mental disorders. Progress in neuro-psychopharmacology & biological psychiatry. 2013;45:258–266. doi: 10.1016/j.pnpbp.2012.05.001. [DOI] [PubMed] [Google Scholar]
- Takahashi T, Cho RY, Mizuno T, Kikuchi M, Murata T, Takahashi K, Wada Y. Antipsychotics reverse abnormal EEG complexity in drug-naive schizophrenia: a multiscale entropy analysis. NeuroImage. 2010;51:173–182. doi: 10.1016/j.neuroimage.2010.02.009. [DOI] [PMC free article] [PubMed] [Google Scholar]
- Takahashi T, Cho RY, Murata T, Mizuno T, Kikuchi M, Mizukami K, Kosaka H, Takahashi K, Wada Y. Age-related variation in EEG complexity to photic stimulation: a multiscale entropy analysis. Clin Neurophysiol. 2009;120:476–483. doi: 10.1016/j.clinph.2008.12.043. [DOI] [PMC free article] [PubMed] [Google Scholar]
- Tamminga CA, Ivleva EI, Keshavan MS, Pearlson GD, Clementz BA, Witte B, Morris DW, Bishop J, Thaker GK, Sweeney JA. Clinical phenotypes of psychosis in the Bipolar-Schizophrenia Network on Intermediate Phenotypes (B-SNIP) The American journal of psychiatry. 2013;170:1263–1274. doi: 10.1176/appi.ajp.2013.12101339. [DOI] [PubMed] [Google Scholar]
- Unschuld PG, Buchholz AS, Varvaris M, van Zijl PC, Ross CA, Pekar JJ, Hock C, Sweeney JA, Tamminga CA, Keshavan MS, Pearlson GD, Thaker GK, Schretlen DJ. Prefrontal brain network connectivity indicates degree of both schizophrenia risk and cognitive dysfunction. Schizophrenia bulletin. 2014;40:653–664. doi: 10.1093/schbul/sbt077. [DOI] [PMC free article] [PubMed] [Google Scholar]
- Vakorin VA, Lippe S, McIntosh AR. Variability of brain signals processed locally transforms into higher connectivity with brain development. J Neurosci. 2011;31:6405–6413. doi: 10.1523/JNEUROSCI.3153-10.2011. [DOI] [PMC free article] [PubMed] [Google Scholar]
- van den Bos W, Guroglu B. The role of the ventral medial prefrontal cortex in social decision making. J Neurosci. 2009;29:7631–7632. doi: 10.1523/JNEUROSCI.1821-09.2009. [DOI] [PMC free article] [PubMed] [Google Scholar]
- Van Essen DC, Smith SM, Barch DM, Behrens TE, Yacoub E, Ugurbil K, Consortium WUMH. The WU-Minn Human Connectome Project: an overview. NeuroImage. 2013;80:62–79. doi: 10.1016/j.neuroimage.2013.05.041. [DOI] [PMC free article] [PubMed] [Google Scholar]
- Vohringer PA, Barroilhet SA, Amerio A, Reale ML, Alvear K, Vergne D, Ghaemi SN. Cognitive impairment in bipolar disorder and schizophrenia: a systematic review. Frontiers in psychiatry. 2013;4:87. doi: 10.3389/fpsyt.2013.00087. [DOI] [PMC free article] [PubMed] [Google Scholar]
- Yang AC, Hong CJ, Liou YJ, Huang KL, Huang CC, Liu ME, Lo MT, Huang NE, Peng CK, Lin CP, Tsai SJ. Decreased resting-state brain activity complexity in schizophrenia characterized by both increased regularity and randomness. Hum Brain Mapp. 2015;36:2174–2186. doi: 10.1002/hbm.22763. [DOI] [PMC free article] [PubMed] [Google Scholar]
- Yang AC, Huang CC, Liu ME, Liou YJ, Hong CJ, Lo MT, Huang NE, Peng CK, Lin CP, Tsai SJ. The APOE epsilon4 allele affects complexity and functional connectivity of resting brain activity in healthy adults. Hum Brain Mapp. 2014;35:3238–3248. doi: 10.1002/hbm.22398. [DOI] [PMC free article] [PubMed] [Google Scholar]
- Yang AC, Huang CC, Yeh HL, Liu ME, Hong CJ, Tu PC, Chen JF, Huang NE, Peng CK, Lin CP, Tsai SJ. Complexity of spontaneous BOLD activity in default mode network is correlated with cognitive function in normal male elderly: a multiscale entropy analysis. Neurobiology of aging. 2013a;34:428–438. doi: 10.1016/j.neurobiolaging.2012.05.004. [DOI] [PubMed] [Google Scholar]
- Yang AC, Tsai SJ. Is mental illness complex? From behavior to brain. Progress in neuro-psychopharmacology & biological psychiatry. 2013;45:253–257. doi: 10.1016/j.pnpbp.2012.09.015. [DOI] [PubMed] [Google Scholar]
- Yang AC, Tsai SJ, Lin CP, Peng CK. A Strategy to Reduce Bias of Entropy Estimates in fMRI Signal 38th Annual International Conference of the IEEE Engineering in Medicine and Biology Society Orlando, FL 2016 [Google Scholar]
- Yang AC, Wang SJ, Lai KL, Tsai CF, Yang CH, Hwang JP, Lo MT, Huang NE, Peng CK, Fuh JL. Cognitive and neuropsychiatric correlates of EEG dynamic complexity in patients with Alzheimer’s disease. Progress in neuro-psychopharmacology & biological psychiatry. 2013b;47:52–61. doi: 10.1016/j.pnpbp.2013.07.022. [DOI] [PubMed] [Google Scholar]
Associated Data
This section collects any data citations, data availability statements, or supplementary materials included in this article.