Abstract
The multicellular spheroid model partly mimics tumor microenvironments in vivo and has been reported in plenty of studies regarding radiosensitivity. However, clear isolation of quiescent and proliferating cells in live conditions has been quite difficult owing to technical limitations; therefore, comprehensive characterization could not be done thus far. In this study, we succeeded in separately isolating different cell types using a fluorescent ubiquitination‐based cell cycle indicator (Fucci) and determining their radiosensitivities. Unexpectedly, proliferating cells were more radioresistant than quiescent cells due to the contact effect when spheroids were disaggregated immediately after irradiation. However, the radiosensitivity of quiescent cells was not influenced by mild hypoxia (hypoxia‐inducible factor‐1α‐positive but pimonidazole‐negative), but their radioresistance became similar to that of proliferating cells due to potentially lethal damage repair when disaggregated 24 h after irradiation. The Fucci system further allowed long‐term observation of cell kinetics inside of the spheroid following irradiation using real‐time confocal fluorescence scanning. Repeated cycles of recruitment from the quiescent to the proliferating phase resulted in cell loss from the outside of the spheroid toward the inside, causing gradual shrinkage. Interestingly, the central region of the spheroid entered a dormant stage approximately 40 days after irradiation and survived for more than 2 months. Using the Fucci system, we were able to comprehensively characterize the radiosensitivity of spheroids for the first time, which highlights the importance of cell cycle kinetics after irradiation in determining the radiosensitivity under tumor microenvironments.
Keywords: Contact effect; fluorescent ubiquitination‐based cell cycle indicator (Fucci), spheroid; quiescent cells; radiosensitivity
Cell cycle kinetics greatly influence radiosensitivity, as indicated by in vitro analysis. Terasima and Tolmach were the first to report fluctuations in radiosensitivity during the cell cycle; cells in late S phase were the most radioresistant, whereas those in M phase were the most radiosensitive.1 It has also been well recognized that cells stopping cell cycle progression show potentially lethal damage repair (PLDR).2 Potentially lethal damage repair has been the operationally observed phenomenon that the surviving fraction (as determined by a clonogenic assay) significantly increases when plateau phase cells with low growth activity are plated after a delay, as opposed to immediately after irradiation.3 In addition to the aforementioned factors, when studying solid tumors, it is necessary to take into account features of the tumor microenvironment that are absent during in vitro conditions. For example, within tumors in vivo, hypoxic and quiescent cell fractions are generated because oxygen and nutrition are delivered by diffusion from tumor vessels, thereby varying their concentration throughout the tumor.4 Considering that cells become radioresistant when oxygen tension is below 20–30 mmHg, with an ED50 (effective dose: pO2 required to achieve 50% of the radioresistance) = ~3 mmHg,4 such hypoxic cells in tumors have been thought to be a cause of cancer relapse after radiotherapy by in vitro studies.
The multicellular spheroid model includes 3‐D anchorage‐independent growth conditions, quiescent and proliferating cell fractions, and hypoxia, thus partly mimicking in vivo conditions, albeit with no vasculature.5, 6, 7 This model has been used to study radiosensitivity in tumor microenvironments, and indeed, radioresistance was shown by 3‐D cell–cell contact (contact effect)8 and the existence of a hypoxic cell fraction.9 Concerning the latter, the existence of a very small fraction was contemplated due to the shape of cell survival curves detectable only at high doses.9 Although coculture of fibroblasts with tumor cells was reported to increase the radioresistant hypoxic fraction,10 sufficient radioresistance by hypoxia is unlikely to be detected in a simple spheroid model. Potentially lethal damage repair was also detected when irradiated spheroids were disaggregated and prepared for a clonogenic assay after a delay.11 Structurally, mature spheroids are known to consist of the outer thin proliferating and inner hypoxic quiescent fraction, by demonstrating that only the outer fraction contains DNA synthesizing cells incorporating 3H‐thymidine or bromodeoxyuridine.6 However, due to technical limitations, it has been quite difficult to separately isolate them in live conditions. Availability of such techniques should provide highly useful information regarding the effect of cell cycle kinetics on radiosensitivity.
To address this issue, we used the fluorescent ubiquitination‐based cell cycle indicator, Fucci.12 This system takes advantage of the cell cycle‐specific properties of the E3 ligase activities of the APCCdh1 and SCFSkp2 complexes, allowing us to visualize cell cycle progression in living cells: cells expressing Fucci emit red and green fluorescence in G1 and S/G2/M phases, respectively. We previously reported that the radiation‐induced Fucci fluorescence change perfectly reflects the radiation‐induced G2 arrest in HeLa‐Fucci cells,13, 14 and such a G2 arrest is prolonged in tumor microenvironments.15, 16 In this study, we newly established a human tongue carcinoma cell line expressing Fucci (SAS‐Fucci cells) and forming spheroids. First, we characterized radiation‐induced cell cycle kinetics of spheroids and separately isolated quiescent and proliferating cells. Next, we determined their radiosensitivities by a clonogenic assay, and compared them to the survivors obtained from long‐term observation of the spheroid following irradiation when its structure was maintained.
Materials and Methods
Cell lines and culture conditions
A human tongue squamous cell carcinoma cell line, SAS, was obtained from the Health Science Research Resources Bank (Sendai, Japan) and maintained in DMEM (Sigma‐Aldrich, St. Louis, MO, USA) containing a high concentration of glucose (4500 mg/L) with 100 units/mL penicillin and 100 μg/mL streptomycin, supplemented with 10% FBS, at 37°C in a humidified 5% CO2 atmosphere.
Establishment of SAS‐Fucci cells
Fucci plasmids (CFII‐EF‐mKO2‐hCdt1 [30/120]) and CFII‐EF‐mAG‐hGeminin [1/110]) were provided by the Riken Bio‐Resource Center through the National Bio‐Resource Project of the Ministry of Education, Culture, Sports, Science and Technology, Japan. Packaging plasmids (pLV‐IVSV‐G and pLV‐HELP) (LENTI‐Smart; InvivoGen, San Diego, CA, USA) and Fucci plasmids were transfected into 293T cells (Clontech, Mountain View, CA, USA). Supernatants were added to SAS cells, which were then cultured in serum‐free medium for 72 h in the presence of 8 μg/mL infection reagent, Polybrene (Sigma‐Aldrich). To purify double‐transduced cells, green fluorescent cells were first isolated using a MoFlo XDP cell sorter (Beckman Coulter, Brea, CA, USA) at ice‐cold temperature. One week after the first cell‐sorting procedure, red fluorescent cells were isolated. After the two‐step sorting, six clones were isolated, and one clone showing strong fluorescence in both colors was designated as SAS‐Fucci cells. This experiment was approved by Genetically Modified Organisms Safety Committee of Tokyo Medical and Dental University (2012‐006C3).
Time‐lapse imaging
Time‐lapse images of monolayer cells were acquired at 1‐h intervals for 72 h on a BIOREVO BZ‐9000 fluorescence microscope (Keyence, Osaka, Japan). Images of spheroids were acquired at 1‐h intervals for 72 h using an FV10i‐LIV confocal laser scanning microscope (Olympus, Tokyo, Japan) in an agar‐spread culture dish containing growth medium. During imaging, cells and spheroids were kept at 37°C in a humidified atmosphere containing 95% air and 5% CO2. For quantitative analysis, fluorescent areas were measured using the ImageJ 1.44 software (available at http://rsbweb.nih.gov/ij/).
Flow cytometry analysis
All samples were fixed in 4% paraformaldehyde to detect DNA contents and the fluorescence intensity of monomeric Azami Green (mAG) or monomeric Kusabira Orange 2 (mKO2). After washing in PBS, cells were stained with PBS containing 10 μg/mL Hoechst 33342 (Invitrogen, Carlsbad, CA, USA) for 30 min. Samples were analyzed using a FACSCanto II (BD Bioscience, Franklin Lakes, NJ, USA) with FlowJo software (Tree Star, Ashland, OR, USA).
Spheroid formation
A Hydrocell 96‐well plate (CellSeed, Tokyo, Japan) was used to generate spheroids. One thousand cells were plated in each well and incubated for approximately 7 days. After the spheroids became visible to the naked eye, the culture medium was replaced with fresh medium every 2 days. Spheroids approximately 700 μm in diameter were transferred to the agar‐spread culture dish containing growth medium, which was originally prepared for observation on an FV10i‐LIV confocal laser scanning microscope (Olympus).
Cell sorting
To assess the radiosensitivity of cells grown in tumor microenvironments, spheroids were disaggregated after irradiation. Spheroids were incubated for 15 min in Spheroid Dispersion Solution (SCIVAX Life Sciences, Kawasaki, Japan) for preparation of single‐cell suspensions immediately or 24 h after irradiation. To distinguish viable from non‐viable cells, cells were incubated in 200 nM DAPI (Sigma) solution for 15 min at room temperature under light‐shielded conditions. After aspiration of the DAPI solution, cells were washed twice in PBS. The DAPI‐positive cells were excluded as non‐viable cells, and only DAPI‐negative cells were analyzed further. To enrich quiescent cells relative to G1 cells, cells with higher red fluorescence intensity were sorted according to Fucci fluorescence intensity. Equal numbers of proliferating cells expressing green fluorescence were sorted at the same time. Fluorescence analysis and cell sorting were carried out using a MoFlo XDP flow cytometer (Beckman Coulter). After sorting, cells were subjected to colony‐forming assays as described below.
Hypoxic treatment
To investigate the effect of oxygen tension on radiosensitivity, spheroids formed as described above were treated using the AnaeroPack‐Anaero 5% (Mitsubishi Gas Chemical, Tokyo, Japan) as described previously.17 Incubation time was 9 h, which was sufficient to generate severe hypoxia (pO2 < 0.1% = 0.78 mmHg) in the liquid phase after equilibration with the air phase. Irradiation was given under this condition and then the spheroids were returned to normoxia. Twenty‐four hours after reoxygenation, the spheroids were disaggregated and red and green cells were sorted as described above. Radiosensitivity was determined by a colony‐forming assay as described below.
Immunohistochemistry
To detect DNA‐synthesizing cells, spheroids were incubated for 48 h in growth medium containing 10 μM 5‐ethynyl‐2′‐deoxyuridine (EdU), and sections were stained using the Click‐iT Plus EdU Imaging kit (Invitrogen). Pimonidazole and hypoxia‐inducible factor‐1α (HIF‐1α) were used as hypoxic markers and 53BP1 was used to detect DNA double‐strand breaks (DSBs). Spheroids were incubated in 200 μM pimonidazole–HCl (Hypoxyprobe‐1; Hypoxyprobe, Burlington, MA, USA) for 8 h. Samples were fixed in PBS containing 4% paraformaldehyde for 24 h. Fixed samples were embedded in OCT compound (Sakura, Tokyo, Japan) and stored at −80°C. Frozen samples were cut with a cryostat into 10‐μm sections, and then boiled in Target Retrieval Solution (Dako, Glostrup, Denmark) for 20 min at 70°C. After antigen retrieval, non‐specific antigens were blocked in Protein Block Serum‐Free (Dako) for 20 min. Sections were incubated with anti‐pimonidazole (1:50; Hypoxyprobe), anti‐HIF1α (1:150; Novus Biologicals, Littleton, CO, USA), or anti‐53BP1 (1:500; Abcam, Cambridge, UK) for 60 min at room temperature. After washing, samples were incubated with secondary antibodies conjugated with Alexa Fluor 488, 555, or 647 (1:500; Invitrogen) for 30 min at room temperature. After immunoreaction, samples were counterstained with Hoechst 33342 (1:1000; Invitrogen). All sections were mounted with ProLong Gold Antifade Reagent (Molecular Probes, Eugene, OR, USA). For quantitation of the 53BP1 foci number per cell, 50 cells were randomly selected from outer and inner regions of the spheroids and foci were counted. Experiments were repeated three times and results were expressed as mean ± SE.
Irradiation
Monolayer cells and spheroids were irradiated using an RX‐650 Cabinet X‐radiator system (Faxitron, Lincolnshire, IL, USA) at a dose rate of 0.75 Gy/min (130 kVp, 5 mA, 0.5 mm Al filtration).
Clonogenic assay
To assess radiosensitivity, an appropriate number of prepared single cells following irradiation were plated on dishes and incubated for approximately 10 days. Colonies were fixed and stained with crystal violet. Colonies consisting of more than 50 cells were counted, and surviving fractions (SFs) were determined as described previously.16 Data were fitted to the following equation (linear‐quadratic [LQ] model) by KaleidaGraph 3.6 (Synergy Software, Reading, PA, USA):
Parameters of α, β, and D10 (dose obtaining SF at 10%) were determined by the curve fitting.
Statistical analysis
Mean values were statistically compared using one‐way anova with post hoc Tukey's multiple comparison test or Student's t‐test. P‐values <0.05 were considered statistically significant.
Results
Establishment of SAS‐Fucci cells
A schematic diagram of the fluorescence colors emitted by the Fucci system over the course of the cell cycle is shown in Figure 1(a). To establish SAS cells expressing the Fucci probes, the Fucci plasmids were virally transduced into SAS cells, and Fucci‐expressing cells were isolated through two‐step cell sorting (Fig. S1). Ultimately, a clone expressing high levels of fluorescence was isolated and designated as SAS‐Fucci. Fucci function was assessed by time‐lapse imaging: red fluorescence gradually shifted to green fluorescence, and then back to red fluorescence after mitosis (Fig. 1b). Two‐dimensional flow cytometry analysis revealed the inverted U‐phase (Fig. 1c) of exponentially growing cell populations.12 After 10 Gy irradiation, the number of green cells gradually increased, reaching a peak approximately 16 h after irradiation, and then red cells appeared 24 h after irradiation. By 72 h after irradiation, most cells had returned to their original distribution, although a small fraction of green cells persisted (Fig. 1c, upper and middle panels). These kinetics reflected G2 arrest kinetics, as shown by DNA content analysis (Fig. 1c, lower panels). Overall, the fluorescence kinetics were similar to that of HeLa‐Fucci cells reported previously.13, 14 Thus, we confirmed that the Fucci system expressed in SAS cells was fully functional.
Figure 1.
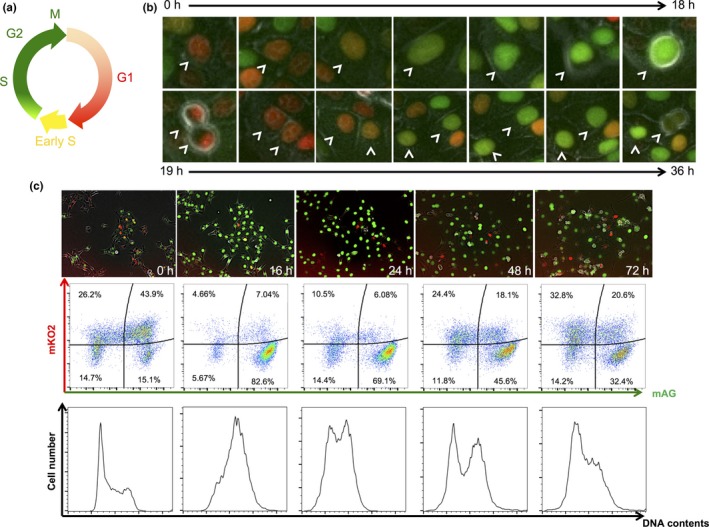
Functional examination of SAS‐Fucci cells. (a) Schematic diagram of fluorescence colors emitted by the Fucci system during the cell cycle. (b) Time‐lapse imaging of Fucci fluorescence during cell cycle progression. Arrowheads indicate the same SAS‐Fucci cell nucleus. (c) Time course of cell population during cell cycle progression following 10 Gy irradiation. Upper panels, time‐lapse imaging of Fucci fluorescence. Middle panels, time course of 2‐D flow cytometric analysis of fluorescence intensities of monomeric Azami Green (mAG; green) and monomeric Kusabira Orange 2 (mKO2; red). Proportions of cells in each cell fraction are shown as percentages. Lower panels, time course of DNA content analysis.
Structures of spheroids
We next formed multicellular spheroids (diameter, ~700 μm). First, we observed the inner regions of the spheroids using histology sections (Fig. 2a). Green cells were concentrated in the outer layer, with a thickness of ~70 μm, whereas red cells were present inside the spheroid. DNA‐synthesizing (S‐phase) cells were labeled with EdU (Fig. 2a). The EdU staining overlapped with the outer layer, which mainly contained green cells. Confocal laser scanning images of the spheroid (Fig. S2) confirmed that the outer layer consisted mainly of green cells, whereas the interior consisted mainly of red cells. When using this method, deeper regions (>100 μm from the surface) appear dark due to the optical conditions of the confocal scanning microscope system used. Furthermore, we examined hypoxic conditions inside the spheroids by immunostaining for HIF‐1α and pimonidazole. The inner region was positive for HIF‐1α, but not for pimonidazole (Fig. 2b), indicating that the interior was mildly, but not severely, hypoxic.18, 19 Taken together, these results indicated that the outer rim, rich in green cells, represented the growing fraction, whereas the interior, rich in red cells, was a quiescent fraction under mild hypoxia.
Figure 2.
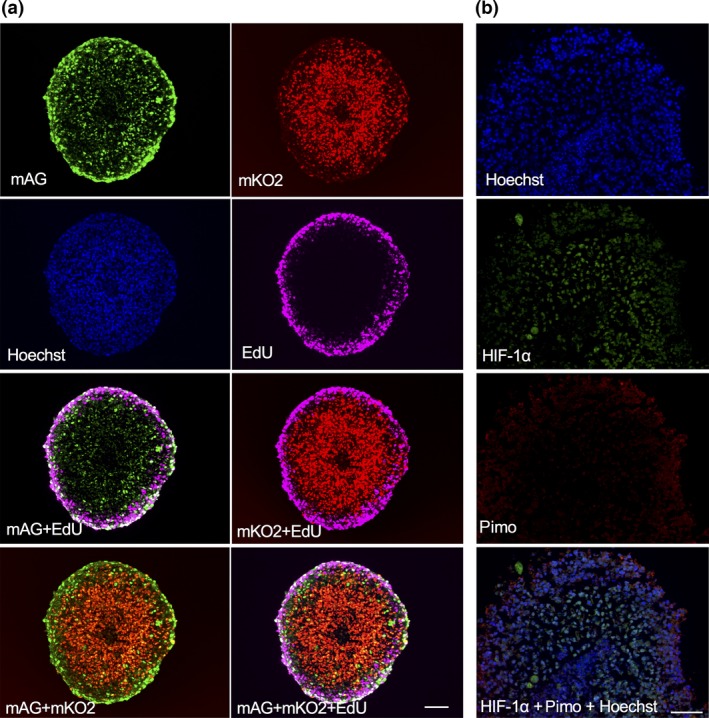
Histological analysis of spheroids consisting of SAS‐Fucci cells. (a) Fucci fluorescence and staining of 5‐ethynyl‐2′‐deoxyuridine (EdU) incorporated into DNA‐synthesizing cells. EdU was incorporated into spheroids for 48 h, and thin sections were prepared. After EdU staining, fluorescence was observed. Bar = 100 μm. (b) Hypoxic conditions within spheroids. Spheroids were incubated with pimonidazole (Pimo) for 8 h, and thin sections were prepared. The sections were immunostained for hypoxia‐inducible factor‐1α (HIF‐1α) and pimonidazole and counterstained with Hoechst. Bar = 100 μm.
Cell cycle kinetics in spheroids following irradiation
Figure 3 shows time‐lapse images of Fucci fluorescence at different depths in the absence (Fig. 3a) or presence (Fig. 3b) of irradiation. In addition, the time course of the ratio of green to red fluorescent areas in the same plane is shown in the absence (Fig. 3c) or presence (Fig. 3d) of irradiation. Essentially, in the absence of irradiation, the ratio did not change at any depth (Fig. 3c). At a depth of 25 μm, corresponding to the growing fraction, a mixture of red and green cells was observed. After irradiation, the proportion of green cells gradually increased, reaching a peak approximately 24 h after irradiation; thereafter, it decreased and went back to the original distribution by 72 h, which was thought to reflect G2 arrest kinetics. The time required to reach the peak was somewhat longer than for cells in monolayer cultures (Fig. 1c). At a depth of 50 μm, only a small part of the quiescent fraction was included in the plane, whereas at a depth of 100 μm, the quiescent fraction accounted for the majority of the plane. Considering that quiescent red cells remained red even after irradiation, it is reasonable that the peak height decreased as the depth increased, as shown in Figure 3(d).
Figure 3.
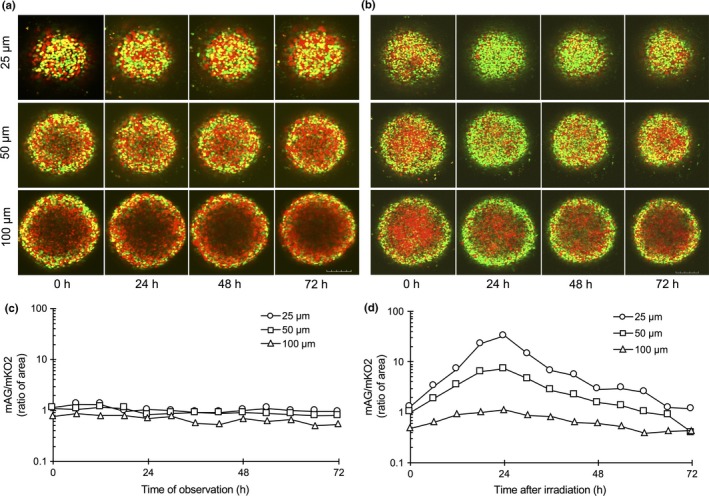
Time‐lapse imaging inside of spheroids in live conditions. Time‐lapse imaging of Fucci fluorescence at various depths from the bottom of the spheroid in the absence (a) or presence (b) of irradiation. Fucci fluorescence inside the spheroid for up to 72 h after sham or 10 Gy irradiation was determined at each depth using a confocal laser scanning microscope. Bar = 200 μm. Time course of ratio of monomeric Azami Green (mAG; green) to monomeric Kusabira Orange 2 (mKO2; red) area at each depth in the absence (c) or presence (d) of irradiation. Areas of red or green fluorescence at each depth were quantitated using ImageJ 1.44 software. Ratios were plotted as a function of time after start of the observation or irradiation. Representative values are shown.
Isolation of cells in outer and inner regions grown as spheroids after irradiation
We next tried to sort cells by flow cytometry according to Fucci fluorescence under sterile conditions to isolate cells in the outer proliferating and inner quiescent regions. As a control, red and green cells isolated from each fraction I and II (Fig. 4a, upper panel) showed essentially the same radiosensitivity in monolayer cultures (Fig. 4a, lower panel). Two‐dimensional FACS revealed that the red fraction consisted of cells with a wide range of red fluorescence intensities immediately after irradiation (Fig. 4b, upper panel), but primarily of cells with higher intensities 24 h after irradiation (Fig. 4c, upper panel). These results indicate that, during the 24 h after irradiation, cells with lower red fluorescence intensity in the growing fraction reached G2 phase (green) and stopped there, whereas quiescent cells remained in G0 phase (red) with higher intensity. The green fraction also shifted to the right, indicating that intensity increased due to the time spent in G2 phase. Twenty‐four hours after irradiation, the majority of cells in the growing fraction became green; consequently, sorting by red and green fluorescence was assumed to almost perfectly separate growing and quiescent fractions. However, immediately after irradiation, a non‐negligible proportion of G1 cells were present in the growing fraction. Given that all red cells were sorted, this fraction still contained part of the growing fraction. To overcome this issue, only cells with high intensity of red fluorescence, presumably corresponding to G0 phase, were sorted to avoid contamination by the growing fraction.
Figure 4.
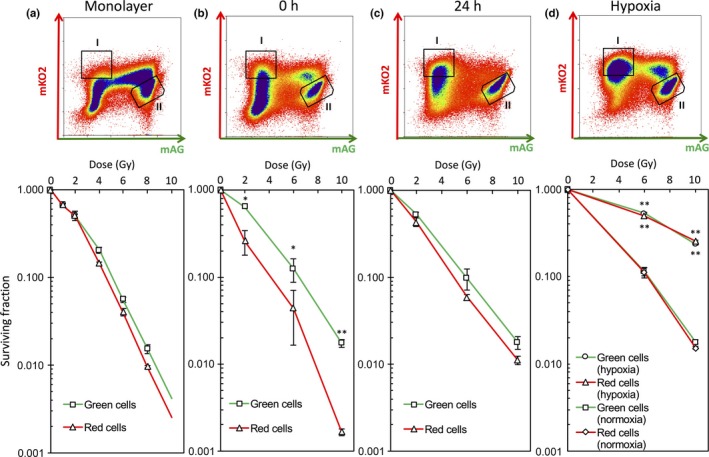
Isolation of outer and inner cells grown in spheroids and determination of their radiosensitivities. (a) Upper panel, FACS fractions of cells grown in monolayers sorted by flow cytometry: I, red cells; II, green cells. Lower panel, dose–survival curves for sorted red and green cells immediately after indicated doses of irradiation. Data represent mean ± SE of three independent determinants. (b) Upper panel, FACS fractions of cells grown in spheroids sorted by flow cytometry immediately after 10 Gy irradiation: I, red cells; II, green cells. Lower panel, dose–survival curves for red and green cells from spheroids obtained immediately after indicated doses of irradiation. Data represent mean ± SE of three independent experiments. *P < 0.05; **P < 0.01. (c) Upper panel, FACS fractions of cells grown in spheroids sorted by flow cytometry 24 h after 10 Gy irradiation: I, red cells; II, green cells. Lower panel, dose–survival curves for red and green cells 24 h after indicated doses of irradiation. Data represent mean ± SE of three independent experiments. Some error bars cannot be seen because they would be smaller than the symbols. (d) Upper panel, FACS fractions of cells grown in spheroids sorted by flow cytometry 24 h after 10 Gy of irradiation under severe hypoxia: I, red cells; II, green cells. Spheroids were subjected to severe hypoxia for 9 h and then irradiated at the indicated doses. After irradiation, spheroids were returned to normoxia and incubated for 24 h. The spheroids were then disaggregated and red and green cells were sorted by flow cytometry. Lower panel, dose–survival curves for red and green cells 24 h after indicated doses of irradiation under severe hypoxia. Data represent mean ± SE of triplicate determinants. Some error bars cannot be seen because they would be smaller than the symbols. **P < 0.01.
Determination of radiosensitivity in isolated quiescent and proliferating cells from spheroids following irradiation
We finally tried to determine the radiosensitivities of isolated cells as described above by a clonogenic assay. Parameters fitted to the LQ model are summarized in Table S1. Surprisingly, the radiosensitivity of red cells sorted immediately after irradiation was the same as that of monolayer‐cultured cells, and only green cells became markedly radioresistant (Fig. 4b, lower panel), clearly showing that this was due to the so‐called contact effect.8 However, the surviving fractions of red cells sorted 24 h after irradiation increased and became comparable to that of green cells (Fig. 4c, lower panel). This phenomenon is known as PLDR.3 One could argue that the radioresistance stems from cells that survived the massive cell death that occurred during the 24 h after irradiation. The percentage of cells in the dead fraction, as judged by DAPI‐positivity, did not significantly increase in the 24 h after irradiation (Fig. S3). Therefore, we were able to exclude this possibility and attribute the radioresistance to PLDR.
Radiosensitivity was the same between the outer and inner cells prepared from spheroids 24 h after irradiation. Next, we sought to determine whether such cells would show more radioresistance when irradiated under severe hypoxia. Because inner cells experienced mild hypoxia within the spheroid (Fig. 2b), we placed spheroids in a severely hypoxic condition (pO2 < 0.1% = 0.78 mmHg) and irradiated them. Remarkable radioresistance was observed in both outer and inner cells, which had comparable surviving fractions (Fig. 4d, lower panel). These results indicate that most of the inner cells were not in severely hypoxic conditions within spheroids, which do not significantly influence radiosensitivity.
Double‐strand break content in outer and inner cells of spheroids following irradiation
It is well‐established that DSB repair activity is closely associated with clonogenic radiosensitivity.20 Therefore, we examined the time course of DSB contents in outer and inner cells following irradiation (Fig. 5). Immunofluorescence staining for 53BP1 recognizes DSB sites and therefore a decrease in 53BP1 foci reflects DSB repair kinetics.21 Many 53BP1 foci were observed in outer cells 0.5 h after irradiation, but significantly fewer foci in inner cells. Mild hypoxia was possibly sufficient to reduce the DSB number in inner cells. Until 72 h after irradiation, the foci number gradually decreased and inner cells always showed a significantly lower number of foci. These results indicate that simple DSB yield or DSB rejoining does not explain the difference in clonogenic radiosensitivity between quiescent and proliferating cells.
Figure 5.
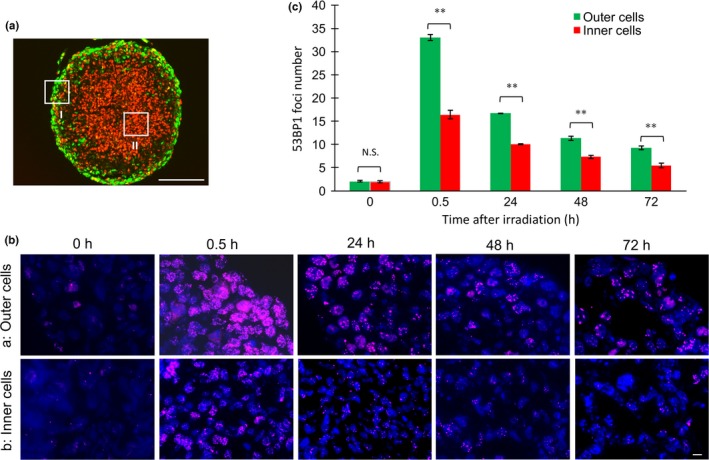
Time course of DNA double‐strand break contents in spheroids following irradiation. (a) Representative measured sites for outer (I) and inner (II) regions of spheroids after irradiation. Bar = 200 μm. (b) Immunofluorescence staining for 53BP1 at the indicated times after 10 Gy irradiation. Bar = 10 μm. (c) Quantitative analysis of 53BP1 foci number. Fifty cells were randomly selected from outer and inner regions and foci numbers were counted. Data represent mean ± SE of three independent experiments. **P < 0.01. N.S., not significant.
Determination of surviving cells in spheroids following irradiation
We next tried to identify cells surviving when the structure of spheroids is maintained following irradiation. For this purpose, long‐term observation of Fucci fluorescence was undertaken in the same way as Figure 3. Fucci fluorescence images at the indicated days after irradiation are shown in Figure 6(a). Like Fig. 3b, radiation‐induced G2 arrest kinetics in the outer region was observed again. Judging from the spheroid size, the growing outer cells were first released from G2 arrest followed by cell loss. Then, sequentially, from the outside towards the inside, red quiescent cells shifted to green growing cells followed by cell loss, and the spheroid gradually shrank. Forty‐five days after irradiation, the shift stopped and red cells, presumably having constituted the core of the spheroid, entered a dormant state (Fig. 6b). The cells survived until 76 days after irradiation, after which they were transferred to monolayer culture conditions. Cells started to regrow and showed clonogenicity (data not shown).
Figure 6.
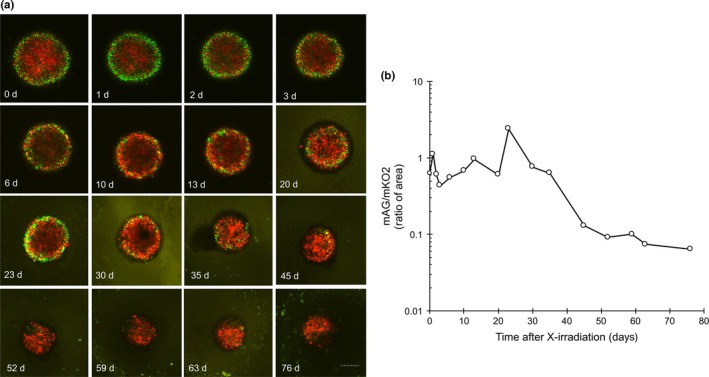
Long‐term observation of a spheroid following irradiation. (a) Confocal scanning fluorescence images of a spheroid at indicated times after irradiation. A spheroid was irradiated with 10 Gy and a plane at a depth of 100 μm from the bottom was observed at the indicated times up to 76 days (d) after irradiation. Images were acquired by time‐lapse imaging up to 3 days; thereafter, they were manually acquired every 3–4 days on a confocal scanning microscope. Bar = 200 μm. (b) Time course of ratio of monomeric Azami Green (mAG; green) to monomeric Kusabira Orange 2 (mKO2; red) area following 10 Gy irradiation. Areas of red or green fluorescence were quantitated using ImageJ 1.44 software. Ratios were plotted as a function of time after irradiation.
Discussion
In this study, we separately isolated quiescent and proliferating cells from spheroids and determined their radiosensitivities using SAS‐Fucci cells. Furthermore, this system enabled us to monitor long‐term changes in cell kinetics inside the spheroid following irradiation. Novel major findings are as follows: (i) green cells containing DNA‐synthesizing cells were concentrated in the outer layer, with a thickness of ~70 μm, whereas red quiescent cells were present inside the spheroid; (ii) the inside quiescent fraction was HIF‐1α‐positive but pimonidazole‐negative; (iii) proliferating cells, but not quiescent cells, showed more radioresistance compared to monolayer‐cultured cells due to the contact effect; (iv) quiescent cells, but not proliferating cells, showed PLDR 24 h after irradiation and the surviving fractions for the former reached the same level as those for the latter; (v) DSB contents were always significantly lower in quiescent cells within spheroids after irradiation; (vi) cell loss was observed after the shift from the quiescent to the proliferating stage within the spheroid following irradiation; and (vii) the central region of the spheroid entered a dormant stage and finally survived for at least 2.5 months.
The contact effect, the radioresistance observed in spheroids independent of hypoxia, has been known for more than 40 years;8, 9 however, its mechanisms remain elusive. An alteration in chromatin packaging influencing DNA repair efficiency is a possible promising candidate.8 The present study clearly shows that the contact effect occurs only in proliferating cells (Fig. 4a,b), consistent with the report that drugs stopping cell cycle progression attenuated the contact effect.22 Mild hypoxia was not sufficient for inducing hypoxia‐associated radioresistance in quiescent cells, but PLDR finally made them catch up with contact effect‐induced radioresistance in proliferating cells when disaggregated 24 h after irradiation (Fig. 4c). Notably, these phenomena were not simply correlated with DSB yield or DSB rejoining after irradiation (Fig. 5). Liu et al.,23 using the premature chromosome condensation method and FISH, reported that PLDR occurring in G0 cells is due to enhanced fidelity of DSB repair through non‐homologous end joining, but not due to enhanced rejoining. Taken together, a possible DSB repair mechanism might be postulated for the contact effect, as fidelity of DSB repair is somehow enhanced through alteration in chromatin packaging specifically occurring in growing cells within the spheroid.
By observing the long‐term cell cycle kinetics of the spheroid following irradiation, we found that cell loss occurred during the release from G2 arrest or recruitment from quiescent phase to growing phase (Fig. 6). Presumably, cell loss of outer cells subsequently caused reoxygenation of inner quiescent cells, thereby activating a switch from the quiescent to the proliferating stage,3 and in turn, cell death was induced. However, entering a dormant stage allowed cells to escape from the cycle, enabling them to survive. It is evident that this process was not reproduced in the clonogenic assay because the spheroid structure was broken after disaggregation and tumor environments were lost. However, the question as to why dormancy occurred in the spheroid after irradiation, remains to be addressed. This kind of dormancy is known to emerge in tumors after cancer therapy and is regarded as one of the mechanisms underlying the failure of cancer therapies.24, 25, 26, 27 Cancer stem cells are thought to be involved in it,24, 25 and it is intriguing to speculate the existence of such cancer stem cells at the center of the spheroid. Further study is required to shed light on this issue.
In this study, the Fucci system enabled us to separately determine the radiosensitivity of quiescent and proliferating cells grown as multicellular spheroids, and made it possible to comprehensively characterize the radiosensitivity of spheroids for the first time. Our study highlighted the importance of cell cycle kinetics occurring in tumor microenvironments following irradiation as a factor influencing tumor radiosensitivity.
Disclosure Statement
The authors have no conflict of interest.
Supporting information
Fig. S1. Two‐step cell sorting of SAS cells transduced with Fucci plasmids.
Fig. S2. Fluorescence images of a spheroid consisting of SAS‐Fucci cells, at varying depths from the bottom, obtained by confocal laser scanning microscopy.
Fig. S3. Fraction of dead cells following irradiation, as determined by FACS analysis.
Table S1. Parameters fitted to the LQ model regarding cell survival.
Acknowledgments
The authors thank Dr. A. Miyawaki and Dr. A. Sakaue‐Sawano for their permission to obtain Fucci plasmids through Riken BRC. This study was supported in part by the Japan Society for the Promotion of Science (Kakenhi grant nos. 26861569, 26293399, 16K20436, and 16K15784) to A.K. and M.M.
Cancer Sci 108 (2017) 704–712
Funding Information
Japan Society for the Promotion of Science
References
- 1. Terasima T, Tolmach LJ. Changes in x‐ray sensitivity of HeLa cells during the division cycle. Nature 1961; 190: 1210–1. [DOI] [PubMed] [Google Scholar]
- 2. Little JB, Hahn GM, Frindel E et al Repair of potentially lethal radiation damage in vitro and in vivo . Radiology 1973; 106: 689–94. [DOI] [PubMed] [Google Scholar]
- 3. Hall EJ, Giaccia AJ. Fractionated radiation and the dose‐rate effect In: Hall EJ, Giaccia AJ, ed. Radiobiology for the radiologist, 7th edn. Philadelphia: Lippincott Williams & Wilkins, 2012; 67–85. [Google Scholar]
- 4. Hall EJ, Giaccia AJ. Oxygen effect and reoxygenatin In: Hall EJ, Giaccia AJ, ed. Radiobiology for the radiologist, 7th edn. Philadelphia: Lippincott Williams & Wilkins, 2012; 86–103. [Google Scholar]
- 5. Hall EJ, Giaccia AJ. Model tumor system In: Hall EJ, Giaccia AJ, ed. Radiobiology for the radiologist, 7th edn. Philadelphia: Lippincott Williams & Wilkins, 2012; 356–71. [Google Scholar]
- 6. Santini MT, Rainaldi G. Three‐dimensional spheroid model in tumor biology. Pathobiology 1999; 67: 148–57. [DOI] [PubMed] [Google Scholar]
- 7. Weiswald LB, Bellet D, Dangles‐Marie V. Spherical cancer models in tumor biology. Neoplasia 2015; 17: 1–15. [DOI] [PMC free article] [PubMed] [Google Scholar]
- 8. Olive PL, Durand RE. Drug and radiation resistance in spheroids: cell contact and kinetics. Cancer Metastasis Rev 1994; 13: 121–38. [DOI] [PubMed] [Google Scholar]
- 9. Duramd RE, Sutherland RM. Dependence of the radiation response of an in vitro tumor model on cell cycle effect. Cancer Res 1973; 33: 213–9. [PubMed] [Google Scholar]
- 10. Sasaki T, Yamamoto M, Yamaguchi T, Sugiyama S. Development of multicellular spheroids of HeLa cells cocultured with fibroblasts and their responses to X‐irradiation. Cancer Res 1984; 44: 345–51. [PubMed] [Google Scholar]
- 11. Kubota N, Suziki M, Furusawa Y et al A comparison of biological effects of modulated carbon‐ions and fast neutrons in human osteosarcoma cells. Int J Radiat Oncol Biol Phys 1995; 33: 135–41. [DOI] [PubMed] [Google Scholar]
- 12. Sakaue‐Sawano A, Kurokawa H, Morimura T et al Visualizing spatiotemporal dynamics of multicellular cell cycle progression. Cell 2008; 132: 487–98. [DOI] [PubMed] [Google Scholar]
- 13. Kaida A, Sawai N, Sakaguchi K, Miura M. Fluorescence kinetics in HeLa cells after treatment with cell cycle arrest inducers visualized with Fucci (fluorescent ubiquitination‐based cell cycle indicator). Cell Biol Int 2011; 35: 359–63. [DOI] [PubMed] [Google Scholar]
- 14. Kaida A, Miura M. Visualizing the effect of hypoxia on fluorescence kinetics in living HeLa cells using the fluorescent ubiquitination‐based cell cycle indicator (Fucci). Exp Cell Res 2012; 318: 288–97. [DOI] [PubMed] [Google Scholar]
- 15. Kaida A, Miura M. Visualizing the effect of tumor microenvironments on radiation‐induced cell kinetics in multicellular spheroids consisting of HeLa cells. Biochem Biophys Res Commun 2013; 439: 453–8. [DOI] [PubMed] [Google Scholar]
- 16. Kaida A, Miura M. Unusual prolongation of radiation‐induced G2 arrest in tumor xenografts derived from HeLa cells. Cancer Sci 2015; 106: 1370–6. [DOI] [PMC free article] [PubMed] [Google Scholar]
- 17. Kaida A, Miura M. Differential dependence on oxygen tension during the maturation process between monomeric Kusabira Orange 2 and Azami Green expressed in HeLa cells. Biochem Biophys Res Commun 2012; 421: 855–9. [DOI] [PubMed] [Google Scholar]
- 18. Yeom CJ, Goto Y, Zhu Y, Hiraoka M, Harada H. Microenvironments and cellular characteristics in the micro tumor cords of malignant solid tumors. Int J Mol Sci 2012; 13: 13949–65. [DOI] [PMC free article] [PubMed] [Google Scholar]
- 19. Jankovic B, Aquino‐Parsons C, Raleigh JA et al Comparison between pimonidazole binding, oxygen electrode measurements, and expression of endogenous hypoxia markers in cancer of the uterine cervix. Cytometry B Clin Cytom 2006; 70: 45–55. [DOI] [PubMed] [Google Scholar]
- 20. Jeggo P, Lavin MF. Cellular radiosensitivity: how much better do we understand it? Int J Radiat Biol 2009; 85: 1061–81. [DOI] [PubMed] [Google Scholar]
- 21. Gupta A, Hunt CR, Chakraborty S et al Role of 53BP1 in the regulation of DNA double‐strand break repair pathway choice. Radiat Res 2014; 181: 1–8. [DOI] [PMC free article] [PubMed] [Google Scholar]
- 22. Olive PL. Cell proliferation as a requirement for development of the contact effect in Chinese hamster V79 spheroids. Radiat Res 1989; 117: 79–92. [PubMed] [Google Scholar]
- 23. Liu C, Kawata T, Shigematsu N et al A comparison of chromosome repair kinetics in G(0) and G(1) reveals that enhanced repair fidelity under noncycling conditions accounts for increased potentially lethal damage repair. Radiat Res 2010; 174: 566–73. [DOI] [PubMed] [Google Scholar]
- 24. Skvortsova I, Debbage P, Kumar V, Skvortsov S. Radiation resistance: cancer stem cells (CSCs) and their enigmatic pto‐survival signaling. Semin Cancer Biol 2015; 35: 39–44. [DOI] [PubMed] [Google Scholar]
- 25. Kllefel S, Schatton T. Tumor dormancy and cancer stem cells: two sides of the same coin? Adv Exp Med Biol 2013; 734: 145–79. [DOI] [PubMed] [Google Scholar]
- 26. Endo H, Okuyama H, Ohue M, Inoue M. Dormancy of cancer cells with suppression of AKT activitiy contributes to survival in chronic hypoxia. PLoS One 2014; 9: e98858. [DOI] [PMC free article] [PubMed] [Google Scholar]
- 27. Endo H, Okami J, Okuyama H, Nishizawa Y, Imamura F, Inoue M. The induction of MIG6 under hypoxic conditions is critical for dormancy in primary cultured lung cancer cells with activating EGFR mutations. Oncogene 2016. (in press). [DOI] [PubMed] [Google Scholar]
Associated Data
This section collects any data citations, data availability statements, or supplementary materials included in this article.
Supplementary Materials
Fig. S1. Two‐step cell sorting of SAS cells transduced with Fucci plasmids.
Fig. S2. Fluorescence images of a spheroid consisting of SAS‐Fucci cells, at varying depths from the bottom, obtained by confocal laser scanning microscopy.
Fig. S3. Fraction of dead cells following irradiation, as determined by FACS analysis.
Table S1. Parameters fitted to the LQ model regarding cell survival.


