

Abstract
Background
Recent whole-genome sequencing identified four molecular subtypes of gastric cancer (GC), of which the subgroup of Epstein–Barr virus-associated GC (EBVaGC) showed a significant enrichment of PIK3CA mutations. We here aimed to validate independently the enrichment of PIK3CA mutations in EBVaGC of a Central European GC cohort, to correlate EBV status with clinico-pathological patient characteristics and to test for a major issue of GC, intratumoral heterogeneity.
Patients and methods
In a first step, 484 GCs were screened for EBV and PIK3CA hot spot mutations of exon 9/20 using EBER in situ hybridization and pyrosequencing, respectively. Secondly, an extended sequencing of PIK3CA also utilizing next generation sequencing was carried out in all EBVaGCs and 96 corresponding lymph node metastases.
Results
Twenty-two GCs were EBER-positive, all being of latency type I. Intratumoral heterogeneity of EBER-positivity was found in 18% of EBVaGCs. Twenty-three GCs held PIK3CA mutations in hot spot regions of exon 9 or 20, being significantly more common in EBVaGCs (P < 0.001). Subsequent extended sequencing of PIK3CA of EBVaGCs showed that 14% harvested three to five different PIK3CA genotypes (including wildtype) in the same primary tumor, albeit in histologically and spatially distinct tumor areas, and that intratumoral heterogeneity of PIK3CA was also present in the corresponding lymph node metastases.
Conclusions
Our findings unravel issues of tumor heterogeneity and illustrate that the assessment of the EBV status in tissue biopsies might carry the risk of sampling errors, which may significantly hamper adequate molecular tumor classification in a more clinical setting. Moreover, this is the first report of intratumoral heterogeneity of PIK3CA mutations in GC, and our findings lead to the conclusion that PIK3CA mutant and -wildtype tumor subclones are skilled to metastasize independently to different regional lymph nodes.
Keywords: intratumoral heterogeneity, PI3K pathway, next generation sequencing, EBV, lymph node metastases, biomarker
Introduction
Gastric cancer (GC) is a prevalent and aggressive disease with a poor prognosis. Treatment options in patients with advanced GC are limited, and the advancements of targeted therapy with companion diagnostics are hitherto restricted to Her2/neu and complicated by GC’s marked intratumoral heterogeneity [1]. GC’s genetic complexity has recently been shown by whole-genome sequencing and comprehensive molecular profiling, and a molecular classification of GC was proposed, which categorizes four subtypes: Epstein–Barr virus-associated (EBVa), microsatellite unstable (MSI), chromosomal unstable (CIN) and genomically stable (GS) GCs [2]. EBVaGC showed an enrichment of PD-L1 overexpression [3] and a strong prediction for PIK3CA mutations. PIK3CA regulates the PIK3/Akt pathway and is frequently mutated in various cancer entities. Additionally, PIK3CA alterations are suggested to be predictive for a therapy with mTOR inhibitors, which makes PIK3CA an interesting target in the search for potential predictive GC biomarkers. However, most studies on larger patient series exploring EBV infection were carried out in Asian patient populations, which are known to hold different gene signatures [4]. We here aimed to validate independently the enrichment of PIK3CA mutations in EBVaGCs in a large Central European patient cohort, paying special attention to one major issue of GC, which can deprive GC patients of a suitable targeted therapy: intratumoral heterogeneity.
Materials and methods
Ethics statement
This project was approved by the local ethics committee of the University Hospital in Kiel, Germany (D453/10). All procedures were in accordance with the Helsinki Declaration.
Study population
From our archive, we retrieved tissue of patients who had undergone total or partial gastrectomy for adenocarcinomas of the stomach or esophago-gastric junction. Follow-up data were retrieved from the Epidemiological Cancer Registry Schleswig–Holstein, Germany, hospital records and general practitioners. Patients were included if histology confirmed an adenocarcinoma of the stomach or esophago-gastric junction. Patients were excluded if GC occurred in the gastric remnant after partial gastrectomy, or perioperative chemotherapy was administered.
Histology and TNM classification
Tissue samples had been fixed in formalin and embedded in paraffin (FFPE). Sections were stained with hematoxylin and eosin (H&E). Tumors were classified according to Laurén [5]. pTNM stage was determined according to the 7th edition of the Union for International Cancer Control (UICC) guidelines [6].
Immunohistochemistry and virtual microscopy
Immunohistochemical stainings were carried out with a BondMax automated slide staining system (Leica Microsystems, Wetzlar, Germany) and antibodies directed against EBNA2, LMP1 and ZEBRA. For virtual microscopy with area analysis, tissue slides were scanned using a Leica SCN400 microscopic scanner (Leica Biosystems, Nussloch, Germany; supplementary File S1, available at Annals of Oncology online).
Epstein–Barr virus testing
EBV encoded RNA was detected using the in situ hybridization (ISH) EBER probe and the BondMax-detection system (both Leica Microsystems) according to manufacturer’s instructions.
Assessment of further clinico-pathological characteristics
The MSI status was assessed by immunohistochemistry with antibodies directed against MLH1, PMS2, MSH2 and MSH6. For cases with reduced or absent nuclear staining, a subsequent molecular comparison of the allelic profiles of the mononucleotide repeat markers BAT-25, BAT-26, NR-21, NR-24, and NR-27 in tumor and corresponding normal tissue was carried out. The KRAS-mutational status (codon 12 and 13), Her2/neu- and PD-L1 status were assessed for the entire cohort as previously described [3, 7, 8].
PIK3CA mutational analysis
DNA isolation
Genomic DNA was extracted from FFPE tissue using the QIAamp DNA mini kit (QIAGEN, Hilden, Germany). Tissue sections were manually microdissected prior to DNA isolation to ensure a tumor component >80%. The integrity and amplifiability of the isolated DNA was evaluated by a qualitative size range PCR assay.
Screening of the entire gastric cancer cohort using pyrosequencing
Firstly, a hot spot pyrosequencing mutational analysis of exons 9 and 20 of the PIK3CA gene was performed on a PyroMark Q24 instrument (QIAGEN) for the entire cohort (N = 484; Figure 1). Briefly, fragments of the gene were amplified by PCR. The resulting PCR products were sequenced using sequencing primers, which cover the most common exon 9 mutations (p.E542K, p.E545K) and various exon 20 mutations [9] (supplementary File S2, available at Annals of Oncology online).
Figure 1.

Study design. In a first step, the entire GC cohort (n = 484) was screened for EBV association and the presence of PIK3CA hot spot mutations of exon 9 and exon 20 using pyrosequencing. After validation of the significant enrichment of PIK3CA mutations in EBVaGCs, an extended PIK3CA mutational analysis was carried out for these cases in order to detect additional non-hot spot mutations. For 8 cases, only formalin fixed and paraffin embedded specimens were available, and Sanger sequencing of exon 1 and 9 and extended pyrosequencing of exon 20 was carried out. For 14 cases with available frozen, unfixed specimens (‘frozen’), an additional mutational analysis was done using the Illumina TruSight Tumor 26 panel on the Illumina MiSeq System.
In-depth PIK3CA mutational and validation analysis using Sanger and next generation sequencing
In order to detect additional nonhot spot mutations of the 22 EBVaGCs, a further PIK3CA mutational analysis including Sanger sequencing of FFPE samples (N = 22) and next generation sequencing (NGS) of corresponding frozen tissue samples (N = 14) was carried out (Figure 1). In 8 cases, frozen tissue samples were not available, and DNA quality of FFPE samples was insufficient for NGS. Genomic DNA of the frozen tissue samples was extracted using the QIAamp DNA mini kit and pre-qualified using qPCR (KAPA Biosystems Inc., Wilmington) and QC Primer (Illumina, San Diego). 28 NGS libraries were prepared using the Illumina TruSight® Tumor 26 workflow and sequenced on the Illumina MiSeq System (PIK3CA exon 1, 2, 7, 9, 20). The Illumina VariantStudio software was used for data analysis.
Detected PIK3CA mutations in exon 1, 9 and 20 (NGS of frozen specimens) and in exon 1 and 9 (Sanger sequencing of FFPE specimens) were validated by Sanger (exon 1 and 9) or pyrosequencing (exon 20), respectively. Primer sequences used for amplification are shown in supplementary File S2, available at Annals of Oncology online. In case of poor DNA quality, FFPE samples were reanalysed by pyrosequencing.
After NGS revealed deviating mutations between corresponding frozen and FFPE samples in three cases, the H&E stained sections of all FFPE tumor specimens were re-examined regarding morphological intratumoral heterogeneity. If present, morphological heterogeneous tumor areas were separately microdissected, DNA was isolated anew, and mutational analysis was repeated separately. In order to confirm the correspondence between frozen and FFPE samples, the AmpFLSTR® Identifiler® Plus PCR Kit (ThermoFisher, Waltham) was used following the manufacturer’s instructions, analysed on a 3500 Genetic Analyzer (LifeTechnologies) and evaluated with GeneMapper software (ThermoFisher).
Mutational analysis of lymph node metastases
Ninety-six lymph node metastases of 12 EBVaGCs were separately microdissected, and Sanger sequencing of exon 1 and hot spot pyrosequencing of exons 9 and 20 was performed.
Statistical methods
The statistical methods are described in supplementary File S3, available at Annals of Oncology online.
Results
A total of 484 patients fulfilled all study criteria.
EBV-RNA was found in 22 (5% of 484 valid results) GCs, of which 4 (18%) showed a heterogeneous EBER positivity (Figure 2; supplementary Figure S1, available at Annals of Oncology online). All 22 EBVaGCs were immunonegative for EBNA2, LMP1 and ZEBRA, and were classified as latency type I neoplasms [10]. Correlations with clinico-pathological characteristics are shown in Table 1.
Figure 2.
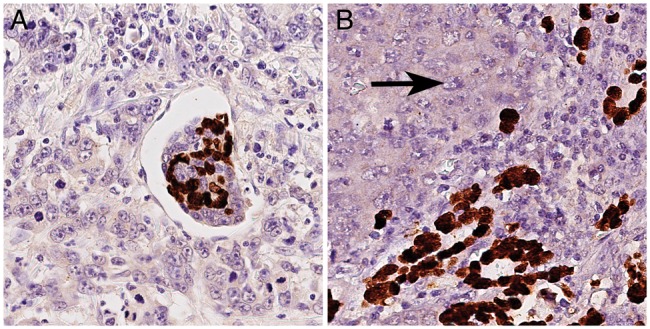
Intratumoral heterogeneity of EBER-positivity. 4 of 22 EBVaGCs (18%; Table 2) showed intratumoral heterogeneity of EBER-positivity with a juxtaposition of EBER-negative and EBER-positive tumor areas. (A) illustrates the intermixture of EBER-positive and EBER-negative tumor cells within angioinvasion of a EBVaGC. EBER-heterogeneity was also observed within corresponding lymph node metastases (B; left: EBER-negative tumor cells (arrow); right: EBER-positive tumor cells). EBER-ISH, magnifications ×400.
Table 1.
Clinico-pathological patient characteristics of the gastric cancer cohort and correlation with Epstein–Barr virus (EBV) infection
| Characteristic | Valid [N] | Total | EBV negative [N (%)] | EBV positive [N (%)] | P value | |||
|---|---|---|---|---|---|---|---|---|
| Gender | 484 | 0.003 | ||||||
| Female | 182 | (37.6) | 180 | (98.9) | 2 | (1.1) | ||
| Male | 302 | (62.4) | 282 | (93.4) | 20 | (6.6) | ||
| Age | 465 | 0.828 | ||||||
| <68 years | 236 | (49.3) | 226 | (95.8) | 10 | (4.2) | ||
| ≥68 years | 243 | (50.7) | 231 | (95.1) | 12 | (4.9) | ||
| Laurén phenotype | 484 | 0.005 | ||||||
| Intestinal | 256 | (52.9) | 242 | (94.5) | 14 | (5.5) | ||
| Diffuse | 148 | (30.6) | 147 | (99.3) | 1 | (0.7) | ||
| Mixed | 28 | (5.8) | 27 | (96.4) | 1 | (3.6) | ||
| Unclassified | 52 | (10.7) | 46 | (88.5) | 6 | (11.5) | ||
| Localization | 472 | 1.000 | ||||||
| Proximal | 149 | (31.6) | 143 | (96.0) | 6 | (4.0) | ||
| Distal | 323 | (68.4) | 310 | (96.0) | 13 | (4.0) | ||
| T-category | 483 | 0.296 | ||||||
| T1a | 12 | (2.5) | 12 | (100) | 0 | (0.0) | ||
| T1b | 46 | (9.5) | 45 | (97.8) | 1 | (2.2) | ||
| T2 | 56 | (11.6) | 54 | (96.4) | 2 | (3.6) | ||
| T3 | 193 | (39.8) | 183 | (94.8) | 10 | (5.2) | ||
| T4a | 134 | (27.8) | 130 | (97.0) | 4 | (3.0) | ||
| T4b | 42 | (8.7) | 37 | (88.1) | 5 | (11.9) | ||
| N-category | 481 | 0.532 | ||||||
| N0 | 136 | (28.3) | 132 | (97.1) | 4 | (2.9) | ||
| N1 | 71 | (14.7) | 66 | (93.0) | 5 | (7.0) | ||
| N2 | 83 | (17.3) | 80 | (96.4) | 3 | (3.6) | ||
| N3a/b | 191 | (39.7) | 181 | (94.8) | 10 | (5.2) | ||
| Stage (7th ed.) | 481 | 0.298 | ||||||
| IA | 45 | (9.4) | 44 | (97.8) | 1 | (2.2) | ||
| IB | 35 | (7.3) | 34 | (97.1) | 1 | (2.9) | ||
| IIA | 56 | (11.6) | 55 | (98.2) | 1 | (1.8) | ||
| IIB | 51 | (10.6) | 45 | (88.2) | 6 | (11.8) | ||
| IIIA | 55 | (11.4) | 54 | (98.2) | 1 | (1.8) | ||
| IIIB | 80 | (16.6) | 77 | (96.2) | 3 | (3.8) | ||
| IIIC | 69 | (14.3) | 64 | (92.8) | 5 | (7.2) | ||
| IV | 90 | (18.7) | 86 | (95.6) | 4 | (4.4) | ||
| Her2/neu status | 441 | 1.000 | ||||||
| Negative | 406 | (92.1) | 388 | (95.6) | 18 | (4.4) | ||
| Positive | 35 | (7.9) | 34 | (97.1) | 1 | (2.9) | ||
| MSI status | 466 | 0.388 | ||||||
| MSS | 432 | (92.7) | 411 | (95.1) | 21 | (4.9) | ||
| MSI | 34 | (7.3) | 34 | (100) | 0 | (0.0) | ||
| PD-L1 in | 448 | <0.001 | ||||||
| tumor cells | ||||||||
| Negative | 340 | (75.9) | 338 | (99.4) | 2 | (0.6) | ||
| Positive | 108 | (24.1) | 90 | (83.3) | 18 | (16.7) | ||
| PD-L1 in | 448 | 0.003 | ||||||
| immune cells | ||||||||
| Negative | 286 | (63.8) | 280 | (97.9) | 6 | (2.1) | ||
| Positive | 162 | (36.2) | 148 | (91.4) | 14 | (8.6) | ||
| KRAS | 477 | 0.558 | ||||||
| Wildtype | 460 | (96.4) | 439 | (95.4) | 21 | (4.6) | ||
| Mutation | 17 | (3.6) | 16 | (94.1) | 1 | (5.9) | ||
| PIK3CA Exon 9 or 20a | 477 | <0.001 | ||||||
| Wildtype | 454 | (95.4) | 439 | (96.7) | 15 | (3.3) | ||
| Mutation | 23 | (4.8) | 16 | (69.6) | 7 | (30.4) | ||
| Tumor-specific survival [months] | 437 | 0.712 | ||||||
| Events (dead) | 301 | (68.9) | 285 | (94.7) | 16 | (5.3) | ||
| Alive | 136 | (31.1) | 130 | (95.6) | 6 | (4.4) | ||
| Median survival | 16.8±1.5 | 12.8±10.6 | ||||||
| 95% CI | 13.9–19.6 | 0.0–33.6 | ||||||
P values that remain significant after multiple testing procedure are highlighted in bold.
After initial hot spot pyrosequencing.
MSS, microsatellite stable; MSI, microsatellite unstable; CI, confidence interval.
Prevalence of PIK3CA hot spot mutations
For 7 of 484 cases, DNA was insufficient for a PIK3CA mutational analysis. These 7 cases were EBV negative. Pyrosequencing of the remaining GC cohort (N = 477) using FFPE tissue (Figure 1 and Table 1) revealed that 23 GCs (5%) had a PIK3CA mutation in exon 9 (N = 14; 59%) or exon 20 (N = 9; 41%; supplementary Table S1, available at Annals of Oncology online). Intratumoral heterogeneity of PIK3CA mutations as described below was observed in 2 of 16 non-EBVaGCs (supplementary Table S1, available at Annals of Oncology online). EBVaGCs carried significantly more commonly PIK3CA mutations compared with EBV-negative GCs (P < 0.001; Table 1). Correlations with clinico-pathological patient characteristics are shown in supplementary Table S2, available at Annals of Oncology online.
EBV- and PIK3CA-status alone or in combination had no significant effect on overall or tumor-specific survival (Figure 3A; supplementary Figure S2, available at Annals of Oncology online).
Figure 3.

Kaplan–Meier curves depicting patients’ survival according to EBV-infection status and PIK3CA mutational status (A). EBV- and PIK3CA-status had no significant effect on tumor-specific survival (P = 0.712 for EBV; P = 0.519 for PIK3CA). Comparison of COSMIC data with PIK3CA mutations of EBVaGC (B): This figure illustrates that PIK3CA mutations of EBVaGCs are distributed within all PIK3CA domains. Comparison of hot spot pyrosequencing versus NGS for the detection of PIK3CA mutations in EBVaGC (C): EBER-ISH detected 22 EBVaGCs, of which 7 cases held PIK3CA mutations in exon 9 or 20 after pyrosequencing of hot spot regions (left). The subsequent extended PIK3CA mutational analysis revealed that 5 EBVaGCs held three to five PIK3CA genotypes (including wildtype) and detected two additional PIK3CA mutated EBVaGCs (right). Both cases held PIK3CA mutations within the hot spot region of exon 9, which could be detected by pyrosequencing after minor modulation of the primer design. The numbers in brackets refer to the case number in Table 2.
Further PIK3CA mutational analysis of EBVaGCs and evaluation of intratumoral heterogeneity
After EBER-ISH and pyrosequencing revealed the significant enrichment of PIK3CA mutations in EBVaGCs, a subsequent in-depth PIK3CA mutational analysis with repeated validation analyses were carried out on all EBVaGCs in order to detect additional non-hot spot mutations. For 8 cases with only FFPE specimens available, Sanger sequencing of exon 1 and 9 was carried out and pyrosequencing of exon 20 was repeated.
It turned out that two cases (no. 1 and 18; Table 2) had a mutation in exon 9 (p.E545A and p.E545G, respectively) that was not detected with initial pyrosequencing but with Sanger sequencing.
Table 2.
PIK3CA mutations of Epstein-Barr virus-associated gastric carcinomas
| Case | Specimen | Screening of study cohort for hot spot mutations by pyrosequencing (FFPE) |
In-depth mutational analysis of EBVaGC MiSeq (frozen) |
Validation and analysis of heterogeneity by Sanger or pyrosequencinga (FFPE/frozen) |
Analysis of lymph node metastases |
|||||||||
|---|---|---|---|---|---|---|---|---|---|---|---|---|---|---|
| Exon 9 | Exon 20 | Exon 1 | Exon 7 | Exon 9 | Exon 20 | Exon 1b | Exon 9b | Exon 20c | Number of analysed lymph node metastases | Exon 1b | Exon 9c | Exon 20c | ||
| 1d | FFPE | wt | wt | – | – | – | – | p.R88Q | p.E545A | wt | N=2 | 2× p.R88Q | 2× p.E545A | 2× wt |
| 2 | FFPE | wt | p.H1047R | – | – | – | – | wt | Wt | p.H1047R | – | – | – | – |
| 3 | FFPE | wt | wt | – | – | – | – | wt | Wt | wt | N=5 | 2× wt, 3× na | 5× wt | 5× wt |
| 4e | FFPE | na | wt | – | – | – | – | na | Na | wt | N=3 | 1× wt, 2× na | 3× wt | 3× wt |
| 5 | FFPE | wt | wt | – | – | – | – | wt | Wt | wt | N=2 | 2× wt | 2× wt | 2× wt |
| 6 | FFPE | wt | wt | – | – | – | – | wt | Wt | wt | – | – | – | – |
| 7 | FFPE | wt | wt | – | – | – | – | wt | Wt | wt | N=4 | 4× wt | 4× wt | 4× wt |
| 8 | FFPE | wt | wt | – | – | – | – | na | Na | wt | – | – | – | – |
| 9e | FFPE | wt | wt | – | – | – | – | wt | – | – | N=6 | 6× wt | 6× wt | 6× wt |
| frozen | – | – | wt | wt | wt | wt | wt | Wt | – | – | – | – | – | |
| 10 | FFPE | p.E542K | wt | – | – | – | – | wt | – | – | N=8 | 7× wt, 1× na | 8× wt | 8× wt |
| frozen | – | – | wt | wt | p.E542K | wt | wt | p.E542K | – | – | – | – | – | |
| 11e | FFPE | p.E545K | wt | – | – | – | – | wt | – | – | – | – | – | – |
| frozen | – | – | wt | wt | p.E545K | wt | wt | p.E545K | – | – | – | – | – | |
| 12 | FFPE | wt | wt | – | – | – | – | wt | – | – | N=2 | 2× wt | 2× wt | 2× wt |
| frozen | – | – | wt | wt | wt | wt | wt | Wt | – | – | – | – | – | |
| 13 | FFPE | wt | wt | – | – | – | – | wt | – | – | – | – | – | – |
| frozen | – | – | wt | wt | wt | wt | wt | Wt | – | – | – | – | – | |
| 14 | FFPE | p.E545K | wt | – | – | – | – | wt | – | – | – | – | – | – |
| frozen | – | – | wt | wt | p.E545K | wt | wt | p.E545K | – | – | – | – | – | |
| 15e | FFPE | wt | wt | – | – | – | – | wt | – | – | N=15 | 15× wt | 15× wt | 15× wt |
| frozen | – | wt | wt | wt | wt | wt | Wt | – | – | – | – | – | ||
| 16 | FFPE | wt | wt | – | – | – | – | wt | – | – | – | – | – | – |
| frozen | – | – | wt | wt | wt | wt | wt | Wt | – | – | – | – | – | |
| 17 | FFPE | wt | wt | – | – | – | – | wt | – | – | – | – | – | – |
| frozen | – | – | wt | wt | wt | wt | wt | Wt | – | – | – | – | – | |
| 18d | FFPE | wt | wt | – | – | – | – | wt | p.E545G | – | N=14 | 14× wt | 14× p.E545G | 14× wt |
| frozen | – | – | wt | wt | p.E545G | p.D1017H | wt | p.E545G | – | – | – | – | – | |
| 19 | FFPE | wt | wt | – | – | – | – | wt | – | – | – | – | – | – |
| frozen | – | – | wt | wt | wt | wt | wt | Wt | – | – | – | – | – | |
| 20f | FFPE 1 | p.E545K | wt | – | – | – | – | wt | p.E545K | – | – | – | – | – |
| FFPE 1A | – | – | – | – | – | – | – | Wt | ||||||
| FFPE 1B | – | – | – | – | – | – | – | p.E545K | ||||||
| frozen | – | – | wt | p.E453K | p.E545K+ p.E542K | wt | wt | p.E545K+ p.E542K | – | – | – | – | – | |
| 21f | FFPE 1 | – | – | – | – | – | – | wt | – | wt | N=10 | 6× p.R88Q 4× wt | 10× wt | 10× wt |
| FFPE 2 | – | – | – | – | – | – | p.R88Q | – | p.H1047R | |||||
| FFPE 3 | wt | p.H1047R | – | – | – | – | p.R88Q | Wt | p.H1047R | |||||
| frozen | – | – | p.R88Q | wt | wt | wt | p.R88Q | Wt | wt | – | – | – | – | |
| 22f | FFPE 1 | p.E545K | wt | – | – | – | – | wt | p.E545K | wt | N=25 | 17× wt 8× na | 25× wt | 6× p.N1044S 19× wt |
| FFPE 1A | – | – | – | – | – | – | wt | Wt | wt | |||||
| FFPE 1B | – | – | – | – | – | – | wt | p.E545K | wt | |||||
| FFPE 2A | – | – | – | – | – | – | wt | Wt | wt | |||||
| FFPE 2B | – | – | – | – | – | – | wt | Wt | p.N1044S | |||||
| frozen | – | – | p.E81K | wt | wt | p.Y1021F | p.E81K | Wt | wtg | – | – | – | – | |
Repetition of those cases with intratumoral phenotypic heterogeneity or divergent mutations between pyro- and Sanger sequencing versus NGS.
Validated with Sanger sequencing.
Validated with pyrosequencing.
Cases with additional exon 9 hot spot mutations after modification of the primer design.
Cases with intratumoral heterogeneity of EBER-postivity.
Cases with intratumoral heterogeneity and divergent mutations between FFPE and frozen tissue.
Wildtype for p.N1044S.
wt, wildtype; na, not analysable; FFPE, formalin-fixed paraffin embedded.
For 14 cases, matched frozen tissue specimens were available, and NGS including PIK3CA mutational analysis of exon 1, 2, 7, 9 and 20 was applied. The PIK3CA mutations discovered are illustrated in Figure 3B.
Deviating mutations between matched FFPE and frozen specimens were observed in three EBVaGCs (no. 20, 21, 22). The re-examination of the tumor morphology revealed that each of the three cases held two to four morphologic heterogeneous tumor areas, which were separately microdissected and sequenced anew. These three EBVaGCs harvested three to five different PIK3CA genotypes (including wildtype), and each case held a minor PIK3CA wildtype component (accounting for 11–22% of the overall tumor section) and a dominant PIK3CA mutated component (Table 2 and Figure 4; supplementary Figure S3, available at Annals of Oncology online). Moreover, the corresponding lymph node metastases of two of these cases (no. 21, 22) were partly PIK3CA wildtype and partly PIK3CA mutated, carrying the same mutations as the subclones of the heterogeneous primary tumor (supplementary Table S3, available at Annals of Oncology online). The 61 lymph node metastases of the remaining 10 cases were either PIK3CA wildtype or PIK3CA mutant, respectively, corresponding with the nonheterogeneous primary tumor, according to matched FFPE and frozen samples (Table 2).
Figure 4.

Intratumoral heterogeneity of PIK3CA mutations in EBVaGC. Three cases held divergent mutations between corresponding FFPE and frozen specimens and two to four morphologically divergent tumor areas, which were subsequently sequenced anew separately. Case no. 22 had four morphologically distinct tumor areas on two different tumor slides, which were all EBV positive. On the first slide, area ‘1A’ accounted for 14% and was PIK3CA wildtype (blue color) and Her2/neu positive; area ‘1B’ accounted for 86% of the tumor section and was PIK3CA mutated in exon 9 (p.E545K; red color) and Her2/neu negative. On the second slide of the same case, area ‘2A’ accounted for 22% of the tumor section and was PIK3CA wildtype (blue color) and Her2/neu negative; area ‘2B’ accounted for 78%, had a mutation in exon 20 (p.N1044S; red color) and was Her2/neu negative. Specimen 1A and 1B showed divergent tumor morphology (1A: trabecular to solid growth pattern; 1B: glandular growth pattern) and a divergent PIK3CA mutational status. Specimen 1B and 2A showed concordant tumor morphology with a glandular growth pattern but divergent PIK3CA mutations. Magnifications: first line overviews; all other lines ×400.
There was no correlation between intratumoral heterogeneity of the EBV status and PIK3CA mutational status.
Hot spot pyrosequencing versus NGS
Hot spot pyrosequencing detected seven EBVaGCs with PIK3CA mutations in exon 9 or 20. Two additional mutated cases (case no. 1 and 18) carried PIK3CA mutations in exon 9 (p.E545A and p.E545G), which were located in the hot spot region but initially not detected by pyrosequencing due to an unfavorable primer design. Both mutations were detectable at a second attempt with pyrosequencing after modulation of the sequencing primer (supplementary File S2, available at Annals of Oncology online). Apart from these two cases, Sanger and NGS revealed additional PIK3CA mutations within cases with exon 9 or exon 20 mutations, but no additional PIK3CA mutated EBVaGCs (Figure 3C). Multiple different (three to five) PIK3CA genotypes were found in five EBVaGCs.
Additional mutations in other genes including PTEN, KRAS, TP53, SMAD4, MET and CTNNB1 are shown in supplementary Table S4, available at Annals of Oncology online.
Discussion
Comprehensive molecular characterization of solid organ tumors holds the promise to open new avenues for future diagnostics and precision medicine. However, these data necessitate validation studies of independent patient cohorts, to make the novel findings more robust for future applications in the clinical context.
Our study of an independent Central European cohort aimed to confirm the specific phenotypic and genotypic characteristics of EBVaGC, proposed by recent deep sequencing data that lead to the categorization of four molecular GC subtypes [2, 11]. The frequency of EBV infection in our cohort was comparatively lower (5%) than in Asian patients. Nevertheless, the clinico-pathological characteristics of our EBVaGCs were consistent with literature data of Asian patients [12].
Recently, the valid identification of EBVaGC became particularly important as it turned out that EBVaGCs express the immune checkpoint molecules PD-L1 and PD-1 [3, 13]. Currently, more than 200 studies worldwide focus on PD-L1/PD-1 immune checkpoint signaling, including 19 studies for GC [14]. As there is some evidence that PD-L1 expression is associated with response to PD-L1/PD-1 pathway inhibition [15], EBVaGCs seem to be particularly suitable for an anti-PD-L1/PD-1 immune therapy. Thus, detecting EBVaGCs may have clinical implications in the near future.
Gastric cancer harbors intratumoral EBV heterogeneity
Although the exact interrelation between GC and EBV remains unclear, it is generally accepted that EBVaGC is a monoclonal proliferation of a single cell persistently infected with EBV [10]. However, using the gold standard method, EBER-ISH, four cases of our cohort showed intratumoral heterogeneity of the EBV status. The juxtaposition of EBER-positive and EBER-negative areas within the same tumor is an uncommon finding, and it has not yet been fully resolved whether EBER negativity in EBER-ISH indicates a real loss of EBV infection or just a lack of EBV transcription.
Nevertheless, the intratumoral heterogeneity of EBER-positivity points to a concrete potential risk of sampling error in tissue based diagnostics: A significant number of GC patients are diagnosed at an advanced, inoperable stage where only biopsies are available for diagnosis and subsequent biomarker testing. Hence, clinicians and pathologists need to be aware that the analysis of biopsy samples carries the risk of a nonrepresentative, i.e. false-negative EBER-ISH test results, which might hamper correct classification of the GC subtype, and, in turn, might influence e.g. the selection of suitable patients for an anti-PD-L1/PD-1 immune therapy.
Gastric cancer harbors intratumoral PIK3CA heterogeneity
Whole genome sequencing provided evidence of a significant association between EBV-positivity and PIK3CA mutations, which we confirmed independently in our cohort: 5% of all GCs and 32% of EBVaGCs carried PIK3CA mutations (P < 0.001). PIK3CA mutations were not restricted to exon 9 and 20. Using NGS, we found 12 different PIK3CA mutations in 9 EBVaGCs. In addition, five cases held multiple concomitant PIK3CA genotypes, which occurred in combination with PIK3CA hot spot mutations of exon 9 and 20. Moreover, re-examination of the tissue specimens revealed that three EBVaGCs showed up to four morphologically divergent tumor areas with spatial divergence of PIK3CA mutations, which were associated with divergent tumor morphology, although not in a systematic manner: The phenotype itself did not correlate with a particular PIK3CA mutation and thus does not aid in the recognition of PIK3CA-mutant GCs/subclones.
Interestingly, the intratumoral heterogeneity also affected the corresponding lymph node metastases: Two cases with intratumoral PIK3CA heterogeneity within the primary tumor had lymph node metastases of which some were PIK3CA wildtype, while others showed the same mutations like the primary tumor. This leads to the conjecture that PIK3CA-mutant and -wildtype GC tumor subclones are skilled to metastasize independently to different regional lymph nodes.
Regarding the putative tumor biological impact of PIK3CA mutations in EBVaGC, the spatial fraction of the PIK3CA mutated tumor area was significantly larger and deeper infiltrative than the wildtype tumor area, which indicates that the PIK3CA mutated tumor clone might be the biologically more aggressive or dominant part. However, our data and previous studies were unable to find any correlation between the PIK3CA-genotype and patient outcome [16].
The occurrence of multiple different PIK3CA mutations within one tumor entity is regarded as a rare event, and its impact remains currently unclear [17]. However, it provides evidence for further subclone formation in EBVaGC. The juxtaposition of PIK3CA-mutant and PIK3CA-wildtype subclones was described for colorectal, breast and lung cancer [18, 19], and now also applies to GC. This finding may have implications for the interpretation of any sequencing data obtained from a single tissue specimen: We detected intratumoral heterogeneity by sequencing different specimens (FFPE and fresh frozen) obtained from the same primary tumor, and by the assessment of histologically distinct tumor areas.
Conclusion
Our work illustrates that GC intratumoral heterogeneity also applies to EBV association and PIK3CA mutations, and that it may significantly hamper adequate molecular tumor classification. Thus, any genotyping of GC should spend special attention to intratumoral heterogeneity, particularly if there is already morphological evidence on H&E-stained sections.
Key Message
This study unravels issues of intratumoral heterogeneity of Epstein–Barr virus association in gastric cancer (GC), which may significantly hamper adequate molecular classification in a clinical setting. Moreover, this is first report of intratumoral PIK3CA heterogeneity in GC: PIK3CA-mutant and -wildtype tumor subclones metastasize independently to different regional lymph nodes.
Funding
CR was supported by grants of the German Research Foundation (grant no. Ro 1173/11 and Ro 1173/12) and the Federal Ministry of Education and Research (P2N).
Disclosure
The authors have declared no conflicts of interest.
Supplementary Material
References
- 1. Yuan DD, Zhu ZX, Zhang X, Liu J.. Targeted therapy for gastric cancer: current status and future directions. Oncol Rep 2016; 35: 1245–1254. [DOI] [PubMed] [Google Scholar]
- 2. The Cancer Genome Atlas Research Network. Comprehensive molecular characterization of gastric adenocarcinoma. Nature 2014; 513: 202–209. [DOI] [PMC free article] [PubMed] [Google Scholar]
- 3. Böger C, Behrens HM, Mathiak M. et al. PD-L1 is an independent prognostic predictor in gastric cancer of Western patients. Oncotarget 2016; 7: 24269–24283. [DOI] [PMC free article] [PubMed] [Google Scholar]
- 4. Lin SJ, Gagnon-Bartsch JA, Tan IB. et al. Signatures of tumour immunity distinguish Asian and non-Asian gastric adenocarcinomas. Gut 2015; 64: 1721–1731. [DOI] [PMC free article] [PubMed] [Google Scholar]
- 5. Lauren T. The two histologic main types of gastric carcinoma: diffuse and so-called intestinal-type carcinoma. Acta Pathol Microbiol Scand 1965; 64: 31–49. [DOI] [PubMed] [Google Scholar]
- 6. Sobin LH, Gospodarowicz M, Wittekind C.. TNM Classification of Malignant Tumours, 7th edition.Weinheim: Wiley-VCH; 2009. [Google Scholar]
- 7. Warneke VS, Behrens HM, Böger C. et al. Her2/neu testing in gastric cancer: evaluating the risk of sampling errors. Ann Oncol 2013; 24: 725–733. [DOI] [PMC free article] [PubMed] [Google Scholar]
- 8. Warneke VS, Behrens HM, Haag J. et al. Prognostic and putative predictive biomarkers of gastric cancer for personalized medicine. Diagn Mol Pathol 2013; 22: 127–137. [DOI] [PubMed] [Google Scholar]
- 9. Baker CL, Vaughn CP, Samowitz WS.. A PIK3CA pyrosequencing-based assay that excludes pseudogene interference. J Mol Diagn 2012; 14: 56–60. [DOI] [PubMed] [Google Scholar]
- 10. Chen JN, He D, Tang F, Shao CK.. Epstein-Barr virus-associated gastric carcinoma: a newly defined entity. J Clin Gastroenterol 2012; 46: 262–271. [DOI] [PubMed] [Google Scholar]
- 11. Wang K, Yuen ST, Xu J. et al. Whole-genome sequencing and comprehensive molecular profiling identify new driver mutations in gastric cancer. Nat Genet 2014; 46: 573–582. [DOI] [PubMed] [Google Scholar]
- 12. Fukayama M, Ushiku T.. Epstein-Barr virus-associated gastric carcinoma. Pathol Res Pract 2011; 207: 529–537. [DOI] [PubMed] [Google Scholar]
- 13. Dong M, Wang HY, Zhao XX. et al. Expression and prognostic roles of PIK3CA, JAK2, PD-L1 and PD-L2 in EBV-associated gastric carcinoma. Hum Pathol 2016; 53: 25–34. [DOI] [PubMed] [Google Scholar]
- 14. Moehler M, Delic M, Goepfert K. et al. Immunotherapy in gastrointestinal cancer: recent results, current studies and future perspectives. Eur J Cancer 2016; 59: 160–170. [DOI] [PubMed] [Google Scholar]
- 15. Topalian SL, Hodi FS, Brahmer JR. et al. Safety, activity, and immune correlates of anti-PD-1 antibody in cancer. N Engl J Med 2012; 366: 2443–2454. [DOI] [PMC free article] [PubMed] [Google Scholar]
- 16. Lee H, Hwang IS, Choi IJ. et al. Are PIK3CA mutation and amplification associated with clinicopathological characteristics of gastric cancer? Asian Pac J Cancer Prev 2015; 16: 4493–4496. [DOI] [PubMed] [Google Scholar]
- 17. Dogruluk T, Tsang YH, Espitia M. et al. Identification of variant-specific functions of PIK3CA by rapid phenotyping of rare mutations. Cancer Res 2015; 75: 5341–5354. [DOI] [PMC free article] [PubMed] [Google Scholar]
- 18. Kalinsky K, Heguy A, Bhanot UK. et al. PIK3CA mutations rarely demonstrate genotypic intratumoral heterogeneity and are selected for in breast cancer progression. Breast Cancer Res Treat 2011; 129: 635–643. [DOI] [PubMed] [Google Scholar]
- 19. Braxton DR, Zhang R, Morrissette JD. et al. Clinicopathogenomic analysis of mismatch repair proficient colorectal adenocarcinoma uncovers novel prognostic subgroups with differing patterns of genetic evolution. Int J Cancer 2016; 139: 1546–1556. [DOI] [PubMed] [Google Scholar]
Associated Data
This section collects any data citations, data availability statements, or supplementary materials included in this article.