

Abstract
The taste of sugar elicits cephalic-phase insulin release (CPIR), which limits the rise in blood glucose associated with meals. Little is known, however, about the gustatory mechanisms that trigger CPIR. We asked whether oral stimulation with any of the following taste stimuli elicited CPIR in mice: glucose, sucrose, maltose, fructose, Polycose, saccharin, sucralose, AceK, SC45647, or a nonmetabolizable sugar analog. The only taste stimuli that elicited CPIR were glucose and the glucose-containing saccharides (sucrose, maltose, Polycose). When we mixed an α-glucosidase inhibitor (acarbose) with the latter three saccharides, the mice no longer exhibited CPIR. This revealed that the carbohydrates were hydrolyzed in the mouth, and that the liberated glucose triggered CPIR. We also found that increasing the intensity or duration of oral glucose stimulation caused a corresponding increase in CPIR magnitude. To identify the components of the glucose-specific taste-signaling pathway, we examined the necessity of Calhm1, P2X2+P2X3, SGLT1, and Sur1. Among these proteins, only Sur1 was necessary for CPIR. Sur1 was not necessary, however, for taste-mediated attraction to sugars. Given that Sur1 is a subunit of the ATP-sensitive K+ channel (KATP) channel and that this channel functions as a part of a glucose-sensing pathway in pancreatic β-cells, we asked whether the KATP channel serves an analogous role in taste cells. We discovered that oral stimulation with drugs known to increase (glyburide) or decrease (diazoxide) KATP signaling produced corresponding changes in glucose-stimulated CPIR. We propose that the KATP channel is part of a novel signaling pathway in taste cells that mediates glucose-induced CPIR.
Keywords: sugar, glucose, artificial sweetener, taste, cephalic-phase insulin release, KATP channel, mice
during and after a meal, nutrients surge into the body and disrupt the internal milieu. To limit this homeostatic challenge, mammals activate a variety of autonomic and endocrine responses called cephalic-phase responses (CPRs) (51, 69). The best-characterized CPR is cephalic-phase insulin release (CPIR). It is elicited preabsorptively and attenuates postprandial hyperglycemia in humans (10, 57), rats (6, 25, 36, 44, 52), and mice (19). Orosensory input is thought to activate preganglionic parasympathetic neurons within the dorsal motor nucleus of the vagus (DMNV) in the medulla oblongata, resulting in the release of neurotransmitters (e.g., acetylcholine) onto pancreatic β-cells and secretion of insulin (6, 17). Little is known, however, about the nature of the orosensory pathways that elicit CPIR.
Taste input from sugars and artificial sweeteners is sufficient to elicit CPIR in humans (31) and rats (59). It is possible that these sweeteners elicit CPIR by binding to the T1r2+T1r3 sweet taste receptor. In response to sweeteners, T1r2+T1r3 activates a signaling pathway involving inositol 1,4,5 trisphosphate and a voltage-gated ATP-release channel (calcium homeostasis modulator 1 or Calhm1) (12). The released ATP binds to the P2X2+P2X3 receptor on primary taste neurons, initiating gustatory nerve input to the brain (15). Many investigators infer that this is the only taste signaling pathway for sweeteners because genetic deletion of T1r2+T1r3, Calhm1, or P2X2+P2X3 eliminates the taste-mediated attraction of mice to sugars and artificial sweeteners (19, 56, 63, 71). However, there is evidence that mice lacking the T1r3 subunit of T1r2+T1r3 display a normal taste-mediated CPIR to glucose (19).
Mammalian taste cells have at least two T1r2+T1r3-independent mechanisms for sensing glucose: the Na+-glucose cotransporter 1 (SGLT1) and the ATP-gated K+ (KATP) channel. SGLT1 functions as a glucosensor in some enteroendocrine cells (24). Because it transports Na+ together with glucose, it produces an electrogenic signal that increases in direct proportion to glucose transport. Likewise, the KATP channel functions as part of a glucosensor in pancreatic β-cells (4). It consists of an inwardly rectifying K+ channel (Kir6) and a regulatory sulfonylurea receptor (Sur1). Pancreatic β-cells use glucokinase to link glucose influx to ATP production and KATP channels to link ATP production to membrane depolarization (3). Given that SGLT1 and the KATP channel are both expressed in T1r2+T1r3-positive taste cells of mice (40, 61, 68), either mechanism could activate glucose-dependent signaling in taste cells and ultimately generate CPIR.
We reported previously that oral stimulation with sucrose elicits CPIR in mice (19). This observation would appear to contradict a role of SGLT1 and KATP channels in taste-mediated CPIR. However, given that α-glucosidases are expressed in taste cells (54), it is possible that these enzymes hydrolyze sucrose into glucose and fructose within the oral cavity. If so, then the liberated glucose could activate SGLT1 or KATP channels in taste cells and thereby trigger CPIR.
Here, we investigated the gustatory mediation of CPIR in mice. We found that 1) the early rise in plasma insulin concentration following a glucose drink precedes the rise in blood glucose; 2) oral stimulation with glucose is both necessary and sufficient to elicit CPIR; 3) CPIR magnitude increases with intensity and duration of oral glucose stimulation; 4) three taste signaling components (SGLT1, Calhm1, and the P2X2+P2X3 receptor) are not necessary for taste-mediated CPIR; 5) functional KATP channels are necessary for taste-mediated CPIR but not for taste-mediated behavioral attraction to sugars; and 6) pharmacological manipulation of the KATP channel modulates CPIR magnitude in a predictable manner.
METHODS
Animals and housing conditions.
C57BL/6 (B6) mice were purchased from the Jackson Laboratories (Bar Harbor, ME). The gene knockout (KO) mice and their wild-type controls (WT) were generously donated by different individuals and institutions. We obtained the Calhm1 KO mice and their WT controls (56) from Philippe Marambaud (The Feinstein Institute for Medical Research; Manhasset, NY). The SGLT1 KO mice (21) were provided by Hermann Koepsell (University of Würzburg; Würzburg, Germany); we used B6 mice as the WT given that the genetic background of the KO mice is > 99% B6. The Sur1 KO mice and their WT controls (47) were obtained from Robert Margolskee (Monell Chemical Senses Center; Philadelphia, PA). The P2X2+P2X3Double−/− KO (P2X-dbl KO) mice (15) were obtained from Afferent Pharmaceuticals (San Mateo, CA) and the P2X2+P2X3Double+/+ WT controls (P2X-dbl WT) from Thomas Finger (University of Colorado; Denver, CO). To minimize experiential effects, each mouse was tested once, unless stated otherwise.
Approximately equal numbers of males and females of each genotype were used in the individual experiments. Samples sizes are provided in the figures or figure legends. The mice were naïve to the taste stimuli before testing. All mice (except the P2X-dbl WT and KO mice) were 7–10 wk old and weighed 21–27 g at the onset of testing. The P2X-dbl WT and KO mice were 20–40 wk old and weighed 21–32 g. We maintained the mice in a vivarium with controlled temperature and humidity on a 12:12-h light-dark cycle. They were housed individually in polycarbonate tub cages (27.5 × 17 × 12.5 cm) with Bed-O’Cobs bedding (Andersons; Maumee, OH) and Nestlet cotton pads (Ancare; Bellmore, NY). The mice had unlimited access to tap water and chow (5001, PMI Nutrition International, Brentwood, MO), except where noted otherwise. The chow diet (according to the manufacturer) contained five carbohydrates at the following concentrations (by weight): starch (31.9%), sucrose (3.7%), lactose (2.0%), fructose (0.4%), and glucose (0.2%); the percent kilocalories from carbohydrates was 57%. Mice obtained water from sipper spouts (with a 1.5-mm hole) attached to water bottles placed on the wire cage-top.
All animal protocols were approved by the Institutional Animal Care and Use Committee of Columbia University and conducted in accordance with the National Institutes of Health guidelines for the care and use of laboratory animals.
Taste solutions.
All taste stimuli were dissolved in deionized water (unless indicated otherwise) and presented to mice at room temperature. The type and concentration of taste stimuli used in a given experiment are described below. All chemicals were purchased from Sigma-Aldrich (St. Louis, MO), except SC45647, sucralose, and Polycose. SC45647 was donated by Grant E. Dubois (Almendra, Roswell, GA); sucralose was donated by Tate & Lyle (Dayton, OH); and Polycose (Ross Laboratories; Columbus, OH) was purchased from amazon.com. According to the manufacturer, Polycose is a corn starch hydrolysate, which contains (by weight) 2% glucose, 7% maltose, 55% maltooligosaccharides, and 36% maltopolysaccharides.
Training and testing in gustometer.
Brief-access lick tests and oral stimulation procedures were conducted in a gustometer (Davis MS160-Mouse; DiLog Instruments, Tallahassee, FL). Before taste tests in the gustometer, each mouse was subjected to three training sessions with water. This served to familiarize each mouse with the gustometer and train it to obtain water from the sipper tube. Each training session began when the mouse took its first lick and lasted 30 min. On training day 1, the mouse could drink freely from a single sipper tube throughout the session. On training days 2 and 3, the mouse could only drink from a sipper tube during sequential 5-s trials. To motivate licking for the water, mice were deprived of water for 22.5 h before each testing session. Afterward, each mouse was returned to its home cage and given 1 h of ad libitum access to water and food; then, it was deprived of water for another 22.5 h but had libitum access to food. Once training was complete, the mouse was given at least one recovery day.
Water- and food-restriction or deprivation protocols.
To motivate licking during the brief-access taste tests in experiments 2 and 7, we used a food- and water-restriction protocol. This involved placing each mouse in a new cage with fresh bedding 23.5 h before each test session and limiting its rations to a 1-g chow pellet (F0173, Bio-Serv) and 2 ml of water. This deprivation schedule causes B6 mice to exhibit concentration-dependent increases in lick rate for preferred taste stimuli (18).
To motivate licking by the B6 and KO mice during the CPIR tests in experiments 1, 3, 4, 5, 6, and 8, we deprived the mice of water for 23-h before testing. Furthermore, to limit the quantity of food in their stomach, we food deprived the mice for 6 h before testing.
Oral stimulation procedure for eliciting CPIR.
For each mouse, we obtained a baseline blood sample between 2:00 and 4:00 PM. Immediately afterward, we put the mouse in the gustometer and permitted it a maximum of 3 min to take its requisite number of licks from the taste stimulus (see below). Most mice completed licking within 60 s. Once they did so, a shutter blocked access to the drinking spout and the mouse was transferred to a cage (without food and water) for blood sampling. If a mouse did not take the requisite number of licks within 3 min, then it was removed from the experiment. We collected additional blood samples at specific time points (see below).
Tail blood sampling.
In experiments 3, 4, 5, 6, and 8, we snipped the distal 1 mm of the tail, obtained a single drop of blood from the severed tail vein, and then determined blood glucose concentration with a handheld glucometer (OneTouch Ultra; Milpitas, CA). For repeated samples, we wiped the tail tip with a moist towel to reinitiate blood flow. For the plasma insulin measurements, we obtained blood from the same tail but had to gently stroke the tail lengthwise to obtain the necessary volume of blood (30 µl) for each time sample.
In experiment 1, we collected blood samples from the submandibular vein, using a technique described elsewhere (20). In brief, we used a lancet to sever the submandibular vein. This technique permitted us to collect >30 µl of blood rapidly (i.e., within 5 s), and thus obtain blood samples at precise time points after the mouse initiated licking. To validate the use of blood samples from different body regions, we compared blood samples taken concurrently from the tail and the submandibular vein of 12 mice. All mice had been maintained on ad lib food and water before testing. Despite large differences in blood glucose concentration across mice (109–212 mg/dl), there was no significant difference in glucose concentration between the tail and submandibular vein samples [mean difference = 4.1 mg/dl; paired t value = 0.69, degrees of freedom (df) = 11, P > 0.53].
The blood samples for the insulin assays were collected in 30-µl EDTA-coated capillary tubes (Innovative Medical Technologies; Shawnee Mission, KS). They were initially stored in ice and were centrifuged later for 3 min at 5,000 rpm. The decanted plasma was stored at −80°C until analysis with the Ultra-Sensitive Mouse Insulin ELISA (Crystal Chem; Downers Grover, IL).
Experiment 1: time course of change in plasma insulin and blood glucose concentration.
Here, we asked how long it took for plasma insulin and blood glucose concentrations to increase once a mouse initiated licking for a 1 M glucose solution. Previous studies in rats reported that plasma insulin concentrations rose more quickly that did blood glucose concentrations (6, 49, 53). Each mouse took a weight-specific number of licks (i.e., 4.3 licks/g mouse), as in our previous study (19). They usually completed these licks within 60 s.
For each mouse, we collected two blood samples and measured the concentration of plasma insulin and blood glucose in each. The baseline blood sample was taken from the tail. Immediately after taking this sample, we placed the mouse in the gustometer and permitted it to complete its weight-specific number of licks (4.3/g mouse) for 1 M glucose. The second blood sample was taken from the submandibular vein 1, 2, 3, 4, or 5 min after the mouse initiated licking. To be included in the experiment, the mouse had to complete its requisite number of licks before we took the second blood sample.
We calculated the difference in plasma insulin (or blood glucose) concentration between the first and second blood samples, separately for each mouse. We refer to these differences as the Δ plasma insulin or Δ blood glucose concentration. To determine how many minutes elapsed before the Δ plasma insulin and blood glucose concentrations rose significantly above baseline, we used a one-sample t-test, separately for each time point. In this and all subsequent statistical comparisons, we set the α level at 0.05.
Experiment 2: determination of isoacceptable concentrations of taste stimuli.
Here, we sought to identify isoacceptable concentrations of 10 taste stimuli. To this end, we measured licking response of B6 mice to a range of concentrations of glucose (0.03, 0.1, 0.2, 0.3, 0.6, and 1.0 M); sucrose (0.03, 0.1, 0.2, 0.3, 0.6, and 1.0 M); fructose (0.03, 0.1, 0.2, 0.3, 0.6, and 1.0 M); maltose (0.03, 0.1, 0.2, 0.3, 0.6, and 1.0 M); saccharin (0.3, 1, 3, 10, and 30 mM); sucralose (0.3, 1, 3, 10, and 30 mM); SC4567 (0.03, 0.1, 0.3, 1, 3, and 10 mM); Ace K (0.003, 0.03, 0.3, 3, and 30 mM); Polycose (1, 2, 4, 8, 16, and 32%); and α-methyl-d-glucopyranoside (MDG) (0.03, 0.1, 0.3, and 1.0 M), a nonmetabolizable sugar analog that is transported by SGLT1 (21). All of these chemicals have been reported to bind to the T1r2+T1r3 receptor (12), except the latter two. MDG has an attractive taste to B6 (29, 46) but not to T1r3 KO mice, indicating that it binds to the T1r2+T1r3 receptor (J. Glendinning, unpublished data). Polycose (a maltodextrin) has an attractive nonsweet taste to rodents, which is mediated by a non-T1r2+T1r3 receptor (42, 62, 72).
Each mouse was subjected to a brief-access taste test (18) with all concentrations of a given tastant. A trial began when the mouse took its first lick from the sipper tube and ended 5 s later when the shutter closed. After a 7.5-s pause, the mouse was presented a different concentration of the same taste stimulus. In this manner, the mouse could initiate up to 144 trials across the 30-min test session. We treated the different concentrations of each taste stimulus as a block and randomized (without replacement) their order of presentation within the block so that each concentration was presented once before the next block began.
Next, we calculated a standardized lick ratio (SLR), separately for each mouse and taste stimulus, using a procedure described elsewhere (18). In brief, we determined each mouse’s local lick rate (expressed as licks/s) during the first training session with water. First, we determined the mean interlick interval (ILI) in milliseconds, based on the population of ILIs <200 ms, and then took the reciprocal of this mean. Next, we multiplied the local lick rate by a scaling factor of 5, resulting in an estimate of the maximal number of licks that the mouse could generate if it licked continuously across the 5-s trial. Finally, we calculated the SLR by dividing average number of licks per trial for a taste stimulus (e.g., 1 M glucose) by the maximal potential lick rate per trial. An SLR approaching 0.0 indicates that the taste stimulus elicited only sporadic licking, whereas one approaching 1.0 indicates that it elicited nearly continuous licking across each 5-s trial.
We defined the isoacceptable concentration of each taste stimulus as the lowest concentration that elicited a mean SLR > 0.70. While this approach did not necessarily identify concentrations of each stimulus that were exactly matched for sweetness intensity or palatability, it did permit us to identify a concentration of each taste stimulus that was highly attractive to the B6 mice.
Experiment 3: do all of the taste stimuli elicit CPIR in B6 mice?
The mice took a body weight-specific number of licks for each taste stimulus solution (i.e., 4.3 licks/g mouse). We took tail blood samples at baseline (i.e., 0 min) and then 5, 15, 30, and 60 min after the mouse initiated licking. We tested for time-dependent changes in plasma insulin and blood glucose levels with repeated-measures ANOVA (and Dunnett’s post hoc test) separately for each taste stimulus. We also calculated Δ plasma insulin (i.e., the change in plasma insulin between time 0 and 5 min after initiating licking) as a measure of CPIR magnitude. We analyzed CPIR magnitude in two ways. We used a one-sample t-test to determine which taste stimuli elicited a CPIR; i.e., a Δ plasma insulin concentration that was significantly greater than zero. For those taste stimuli that elicited a CPIR, we compared CPIR magnitudes with one-way ANOVA and Tukey-type multiple comparison test.
Experiment 4: does acarbose prevent sucrose, maltose, and Polycose from eliciting CPIR?
Because amylase and α-glucosidases are present in the oral cavity (54), it is likely that they liberated glucose from the glucose-containing carbohydrates that were tested in experiment 3 (i.e., sucrose, maltose, and Polycose). If so, then it is possible that this liberated glucose (and not the larger carbohydrate molecules) elicited CPIR. To test this hypothesis, we had the mice take a weight-specific number of licks (4.3/g mouse) for the isoacceptable concentration of each carbohydrate, with or without acarbose (Sigma-Aldrich).
We used acarbose because it prevents amylase and α-glucosidases from hydrolyzing carbohydrates and thereby liberating glucose (30, 37, 39). We selected 5 mM acarbose for two reasons. First, it effectively blocks the hydrolytic action of amylase and α-glucosidases in human saliva (34). Second, a prior study demonstrated that a 5.6 mg/kg dose of acarbose prevents the rise in blood glucose that typically follows a 0.5 g/kg intraduodenal infusion of sucrose in rats (37). In this prior study, the ratio of the acarbose dose to the sucrose dose was ~11:1 (i.e., 5.6/0.5). In the present study, the ratio of the acarbose dose (0.51 mg/kg) to the sucrose dose (0.05 g/kg) was ~10:1. Based on the similarity of these ratios, we predicted that 5 mM acarbose should effectively block hydrolysis of sucrose, maltose, and Polycose in the oral cavity and the small intestine of mice.
We took tail blood samples at baseline (i.e., 0 min) and 5, 15, 30, and 60 min after the mice initiated licking for each taste stimulus, and we measured both plasma insulin and blood glucose concentration. We defined CPIR as described above and compared CPIR across treatment levels (+ or – acarbose), separately for each carbohydrate with an unpaired t-test. We tested for an effect of acarbose treatment on plasma insulin and blood glucose dynamics across time with a mixed-model ANOVA and Sidak’s multiple comparison test. We also compared plasma insulin and blood glucose values at each time point (relative to baseline) with Dunnett’s multiple comparison test, separately for each carbohydrate and treatment level.
Experiment 5: does CPIR increase with intensity and duration of oral glucose stimulation?
We tested the prediction that CPIR magnitude would increase with intensity of oral glucose stimulation and duration of stimulation. To vary stimulus intensity, we offered B6 mice different concentrations of glucose (i.e., 0, 0.1, 0.3, 0.6, 1, or 3 M) and allowed them to take a mass-specific number of licks for each glucose solution (4.3 licks/g mouse). To vary stimulation duration, we allowed B6 mouse to take 0, 50, 100, or 200 licks for a 1 M glucose solution. In each case, we collected plasma insulin both at baseline and 5 min after initiating licking.
We used one-way ANOVA (and a Tukey-type multiple comparison) to determine whether CPIR increased with glucose concentration or number of licks. In addition, we used a one-sample t-test to determine whether the CPIR was significantly >0, separately for each glucose concentration and lick number.
Experiment 6: which taste signaling proteins are necessary for CPIR?
Previously, we established that T1r3 KO mice exhibit normal CPIR following oral stimulation with 1 or 2.8 M glucose. This established that the T1r3 subunit of T1r2+T1r3 receptor does not contribute to CPIR. Here, we examined the necessity of additional taste signaling proteins to CPIR. In each case, we compared mice with a global gene deletion to their appropriate WT control. The KO mice lacked the voltage-gated ATP-release channel (Calhm1), the P2X2+P2X3 receptor for ATP, the sulfonylurea receptor 1 (Sur1), or the Na+-dependent glucose transporter 1 (SGLT1).
All mice, except the SGLT1 KO and WT controls, were maintained on the normal chow diet. The SGLT1 KO mice were maintained on a low-carbohydrate diet from weaning (percent kcal from carbohydrate = 2.2%, from fat = 39.3% and from protein = 58.5%; Envigo, Indianapolis, IN), owing to compromised glucose transport in the small intestine (46). We maintained the B6 WT mice on the same low-carbohydrate diet for 4 wk before testing.
The mice took a weight-specific number of licks (4.3 licks/g mouse) for 2.8 M glucose. We used this high glucose concentration to minimize the risk of a type 2 error. We were concerned that if the KO mice had reduced taste sensitivity to glucose, then we may fail to observe a CPIR simply because the 1 M concentration (which was used in many of the other experiments) might produce a weak response. We obtained tail blood samples at baseline (i.e., 0 min) and 5, 15, 30, and 60 min after the mouse initiated licking for the glucose solution. At each time point, we collected plasma insulin and blood glucose samples. We tested for time-dependent changes in plasma insulin and blood glucose with a mixed-model ANOVA, separately for each type of mouse. Genotype (i.e., KO vs. WT) was a between factor and time a within factor. We also calculated Δ plasma insulin (i.e., the change in plasma insulin concentration between time 0 and 5 min after initiating licking) as a measure of CPIR magnitude. We compared each KO and its associated WT group with a t-test.
Experiment 7: is Sur1 necessary for normal taste-mediated licking for sugars?
To determine the necessity of the KATP pathway in taste cells for taste-mediated behavioral attraction to sugars, we compared licking responses of Sur1 KO and WT mice to a range of concentrations of glucose (0.03, 0.1, 0.3, 0.6, and 1.0 M) and sucrose (0.03, 0.1, 0.2, 0.3, 0.6, and 1.0 M). We selected these sugars because they elicited the strongest CPIR. Each mouse was tested with both sugars. To control for order effects, we counterbalanced the testing sequence of each sugar across mice. We employed the same gustometer training and testing procedures as described above. We used a mixed-model ANOVA to compare SLR across genotypes, separately for each sugar. We treated genotype as a within factor and concentration as a between factor.
Experiment 8: does pharmacological manipulation of KATP channel alter CPIR?
For the glyburide test, the experimental solution contained 150 μM glyburide, 0.33% DMSO, and 0.5 M glucose, whereas the control solution contained 0.33% DMSO and 0.5 M glucose. We used a relatively low glucose concentration (i.e., 0.5 M) to minimize the chances of a ceiling effect compromising our results. For the diazoxide test, the experimental solution contained 250 μM diazoxide, 0.66% DMSO, and 1.0 M glucose, whereas the control solution contained 0.66% DMSO and 1.0 M glucose. We used a relatively high glucose concentration (1.0 M) to minimize the chances of a floor effect compromising our results. We selected the indicated concentrations of glyburide and diazoxide based on pilot studies and the literature (23).
After training the mice to lick in the gustometer, we subjected them to CPIR testing. We used different mice in the glyburide and diazoxide tests. For a given test, we ran each mouse through two trials, each on separate days. In one trial, the mouse received the experimental solution; in the other trial, it received the control solution. We counterbalanced the order in which the experimental and control solutions were tested (i.e., day 1 or 2) across mice. During each trial, we collected plasma insulin at baseline (0 min) and 5 min after the mice initiated licking for the experimental or control solution. All mice had to complete 200 licks within a 3-min period to be included. We compared plasma insulin responses to licking for the control versus experimental solutions with paired t-tests, separately for the glyburide and diazoxide tests.
RESULTS
Experiment 1: time course of change in plasma insulin and blood glucose concentration.
Licking for 1.0 M glucose caused a marked increase in both plasma insulin and blood glucose, but over different time frames (Fig. 1). Whereas there was a trend for the Δ plasma insulin concentration to rise above zero within 2 min (one sample t-value = 2.42, df = 6, P = 0.052), it did not do so significantly until 3 min had elapsed (one sample t-value = 6.87, df = 7, P < 0.0003). In contrast, the Δ blood glucose concentration did not rise significantly above zero until 4 min had elapsed (one sample t-value = 4.77, df = 6, P < 0.004). Given that there was virtually no change in blood glucose concentration during the initial 3 min of the test, it follows that the early rise in plasma insulin could not have been elicited by a change in blood glucose concentration. Thus we infer that the early rise in plasma insulin reflects a cephalic-phase response.
Fig. 1.

Plasma insulin (A) concentration increased more rapidly than did plasma glucose (B) concentration after mice initiated licking for 1.0 M glucose (experiment 1). Each mouse took a weight-specific number of licks (4.3/g mouse). We represent scores from individual mice as a circle, and the mean score as a horizontal line. We use closed circles to indicate the time points when the mean change in plasma insulin (or blood glucose) was significantly greater than zero (P < 0.004; one-sample t-test), and open circles to indicate the time points when it was not significantly greater than zero (P > 0.05).
Experiment 2: determination of isoacceptable concentrations of tastants.
To compare the different artificial sweeteners and carbohydrates in terms of their ability to elicit CPIR, we determined isoacceptable concentrations of each (Fig. 2). We found that the SLRs increased significantly with concentration for each taste stimulus (in all RM ANOVAs, P < 0.001). Whereas SLR rose monotonically with concentration for most stimuli, that for SC45647 did so until 3 mM but then decreased significantly at the 10 mM concentration (paired t-value = 6.2, df = 8, P < 0.001). We labeled the isoacceptable concentration of each taste stimulus in Fig. 2 with an asterisk.
Fig. 2.

The B6 mice exhibited robust concentration-dependent increases in licking for all of the taste stimuli (experiment 2). We present licking responses as standardized lick ratios (SLR) (means ± SE). We defined the isoacceptable concentration of each taste stimulus as the lowest concentration that elicited an SLR > 0.7 (dashed line). We identify the isoacceptable concentrations with an asterisk. We tested the following number of mice with each taste stimulus: glucose (n = 9), sucrose (n = 11), maltose (n = 9), Polycose (n = 10), fructose (n = 10), α-methyl-d-glucopyranoside (MDG; n = 8), acesulfame potassium (Ace K; n = 12), sucralose (n = 11), saccharin (n = 10), and SC45647 (n = 9).
Experiment 3: which taste stimuli elicit CPIR in B6 mice?
We measured changes in plasma insulin and blood glucose after mice took a weight-specific number of licks for isoacceptable concentrations of four sugars (glucose, sucrose, maltose, fructose), a maltodextrin (Polycose), a nonmetabolizable glucose analog (MDG), and four artificial sweeteners (saccharin, sucralose, Ace K, and SC45647). We defined CPIR as a significant elevation in plasma insulin (relative to baseline) within 5 min of initiating licking for the stimulus. This definition was based on a prior study of B6 mice, which reported that glucose triggers a rapid (within 5 min) rise in plasma insulin when it is ingested orally but not when it is infused intragastrically (19).
Four of the taste stimuli (glucose, sucrose, maltose, and Polycose) elicited CPIR, whereas the other six (fructose, MDG, saccharin, sucralose, Ace K, and SC45647) did not (Fig. 3). The CPIR elicited by glucose was significantly larger than that elicited by maltose and Polycose, but the CPIR elicited by sucrose did not differ from that elicited by the other three carbohydrates according to an ANOVA (F3,32 = 6.7, P < 0.002) and Tukey-type multiple comparison.
Fig. 3.

Some, but not all, taste stimuli elicited cephalic-phase insulin release (CPIR) in B6 mice (experiment 3). We defined CPIR as a significant increase in plasma insulin concentration (i.e., Δ plasma insulin concentration) within 5 min of initiating licking for the taste stimulus, based on a one-sample t-test (P < 0.05). For each stimulus, we represent scores from each mouse as a circle, and the mean score as a horizontal line. We use closed circles for taste stimuli that elicited CPIR (i.e., glucose, sucrose, maltose, and Polycose), and open circles for taste stimuli that did not elicit CPIR. We compare mean CPIR magnitude across glucose, sucrose, maltose, and Polycose with a Tukey-type multiple comparison test. The means that differ significantly from one another lack a shared letter (i.e., a, b, or c) above them (P < 0.05). We use the following abbreviations for each taste stimulus: glucose (Gluc), sucrose (Sucro), maltose (Malt), Polycose (Poly), fructose (Fruc), α-methyl-d-glucopyranoside (MDG), saccharin (Sacc), acesulfame potassium (Ace K), sucralose (Sucra), and SC45647 (SC).
We also examined the extent to which ingestion of isoacceptable concentrations of each taste stimulus increased plasma insulin over the 60-min sampling period (Fig. 4). Only four of the taste stimuli (glucose, sucrose, maltose, and Polycose) caused a significant increase in plasma insulin concentration over time (Table 1). Glucose and sucrose elicited substantially larger and more protracted elevations in plasma insulin than did maltose and Polycose.
Fig. 4.

Some taste stimuli caused larger changes in plasma insulin and blood glucose dynamics than did others (experiment 3). Each B6 mouse took a mass-specific number of licks (4.3 licks/g mouse) for the isoacceptable concentration of each taste stimulus. In each panel, we indicate baseline (B) measurements with an open circle, and subsequent changes in plasma insulin or blood glucose with closed circles (means ± SE). *Time points at which the plasma insulin or blood glucose concentrations were significantly greater than baseline (P < 0.05, Dunnett’s multiple comparisons test). See Table 1 for further analysis of these results. The taste stimulus abbreviations and number of mice tested were as follows: glucose (Gluc; n = 9), sucrose (Sucro; n = 6), maltose (Malt; n = 8), Polycose (Poly; n = 8), fructose (Fruc; n = 6), MDG (n = 7), saccharin (Sacc; n = 8) Ace K (n = 8), sucralose (Sucra; n = 8), and SC45647 (SC; n = 8).
Table 1.
Did licking for different taste stimuli alter plasma insulin and blood glucose dynamics in B6 mice (experiment 3)?
| Taste Stimulus | Blood Measurement | F Ratio | df | P Value |
|---|---|---|---|---|
| Glucose | Plasma insulin | 7.9 | 4,32 | 0.0001 |
| Blood glucose | 42.0 | 4,32 | <0.0001 | |
| Sucrose | Plasma insulin | 10.8 | 4,20 | <0.004 |
| Blood glucose | 25.7 | 4,20 | <0.0001 | |
| Maltose | Plasma insulin | 13.8 | 4,28 | <0.0001 |
| Blood glucose | 23.3 | 4,28 | <0.0001 | |
| Polycose | Plasma insulin | 5.0 | 4,28 | <0.004 |
| Blood glucose | 68.6 | 4,28 | <0.0001 | |
| Fructose | Plasma insulin | 2.0 | 4,20 | 0.17 |
| Blood glucose | 17.9 | 4,20 | <0.001 | |
| MDG | Plasma insulin | 1.2 | 4,24 | 0.34 |
| Blood glucose | 0.7 | 4,28 | 0.51 | |
| Ace K | Plasma insulin | 0.3 | 4,28 | 0.77 |
| Blood glucose | 1.7 | 4,28 | 0.23 | |
| Sucralose | Plasma insulin | 0.8 | 4,28 | 0.54 |
| Blood glucose | 2.2 | 4,28 | 0.16 | |
| Saccharin | Plasma insulin | 1.7 | 4,28 | 0.21 |
| Blood glucose | 0.7 | 4,28 | 0.63 | |
| SC45647 | Plasma insulin | 0.2 | 4,28 | 0.91 |
| Blood glucose | 2.6 | 4,28 | 0.14 |
We used repeated-measure ANOVA to test for time-dependent changes in plasma insulin or blood glucose concentration, separately for each taste stimulus. The actual results are in Fig. 4. df, degrees of freedom.
Five taste stimuli (i.e., glucose, sucrose, maltose, Polycose, and fructose) caused blood glucose to rise significantly (Table 1) above baseline at the 5-, 15-, and 30-min time points (Fig. 3). Fructose produced the smallest increase in blood glucose. Polycose caused the largest and most sustained increase in blood glucose, remaining significantly above baseline 60 min after initiating licking. This stems in part from the fact that the 30% Polycose solution (once digested) yielded more glucose molecules than the other carbohydrate solutions.
Experiment 4: does acarbose prevent sucrose, maltose, and Polycose from eliciting CPIR?
We found that acarbose treatment blocked CPIR in response to sucrose, Polycose, and to a lesser extent, maltose (Fig. 5). That acarbose prevented digestion of sucrose and Polycose (and maltose to a lesser extent) is demonstrated by the plasma glucose data (see below). The absence of CPIR following acarbose treatment reveals that free glucose is necessary for eliciting CPIR.
Fig. 5.
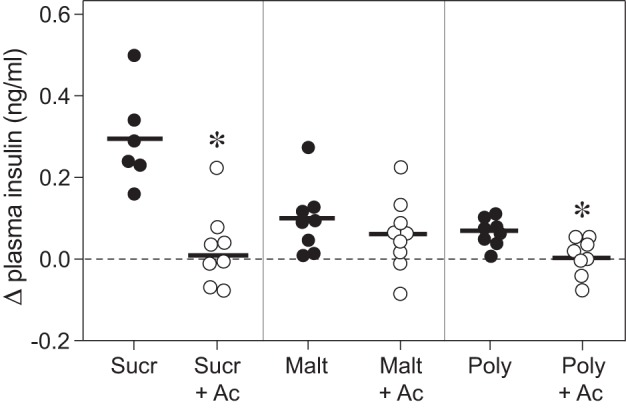
Acarbose prevented sucrose, maltose, and Polycose from eliciting CPIR (experiment 4). We defined CPIR as a significant increase in plasma insulin concentration (i.e., Δ plasma insulin concentration) within 5 min of initiating licking for the taste stimulus, based on a one-sample t-test (P < 0.05). All B6 mice took a weight-specific number of licks (4.3 licks/g mouse) for isoacceptable concentrations of each carbohydrate solution. For each stimulus, we represent the scores from each mouse as a circle, and the mean score as a horizontal line. We use open circles for taste stimuli that elicited a significant CPIR, and closed circles for solutions that did not. *Mean Δ plasma insulin concentration elicited by the carbohydrate + 5 mM acarbose solution was significantly less than that elicited by the corresponding carbohydrate alone (P < 0.004, unpaired t-test). Abbreviations for each experimental solution are as following: sucrose (Sucr), sucrose + acarbose (Sucr+Ac), maltose (Malt), maltose + acarbose (Malt+Ac), Polycose (Poly), and Polycose + acarbose (Poly+Ac).
We determined whether acarbose altered plasma insulin over the 60-min sampling period. For sucrose, there was a significant main effect of acarbose and significant interaction of acarbose × time on both plasma insulin and blood glucose (Table 2, Fig. 6). The absence of any rise in blood glucose over the 60-min sampling period indicates that the acarbose completely inhibited the ability of α-glucosidases to hydrolyze sucrose in the mouth and gut. In fact, blood glucose dropped significantly below baseline at 30 min. Acarbose also prevented any detectable rise in plasma insulin over the 60-min sampling period.
Table 2.
Did acarbose alter plasma insulin or blood glucose response to oral stimulation with sucrose, maltos, or Polycose (experiment 4)?
| Carbohydrate | Blood Measurement |
Treatment Level |
F Ratio | df | P Value |
|---|---|---|---|---|---|
| Sucrose | Plasma insulin | Acarbose | 27.0 | 1,13 | 0.0002 |
| Time | 4.7 | 4,52 | 0.003 | ||
| Interaction | 7.0 | 4,52 | 0.0001 | ||
| Blood glucose | Acarbose | 40.0 | 1,13 | <0.0001 | |
| Time | 34.7 | 4,52 | <0.0001 | ||
| Interaction | 24.1 | 4,52 | <0.0001 | ||
| Maltose | Plasma insulin | Acarbose | 8.0 | 1,15 | 0.02 |
| Time | 12.2 | 4,60 | <0.0001 | ||
| Interaction | 5.2 | 4,60 | 0.002 | ||
| Blood glucose | Acarbose | 0.09 | 1,15 | 0.77 | |
| Time | 6.6 | 4,60 | 0.004 | ||
| Interaction | 5.0 | 4,60 | 0.002 | ||
| Polycose | Plasma insulin | Acarbose | 9.2 | 1,15 | 0.009 |
| Time | 4.3 | 4,60 | 0.004 | ||
| Interaction | 4.7 | 4,60 | 0.002 | ||
| Blood glucose | Acarbose | 23.2 | 1,15 | 0.0002 | |
| Time | 10.4 | 4,60 | <0.0001 | ||
| Interaction | 39.8 | 4,60 | <0.0001 |
Actual data are presented in Fig. 6. We show results of mixed-model ANOVAs.
Fig. 6.

Acarbose attenuated the plasma insulin (top row) and blood glucose (bottom row) response (means ± SE) to licking for sucrose, maltose, and Polycose (experiment 4). Within each panel, we compared (at each time-point) the plasma insulin or blood glucose concentrations following oral stimulation with the carbohydrate (Carb) solution vs. its corresponding carbohydrate + 5 mM acarbose (Carb + acarbose) solution, using Sidak’s multiple comparisons test (#P < 0.05). We also compared the plasma insulin or blood glucose concentration at baseline (B) with that at each successive time-point, separately for each treatment group, using Dunnett’s multiple comparison test (*P < 0.05). For each experimental solution, we tested the following number of mice: sucrose (n = 6), sucrose + acarbose (n = 9), maltose (n = 8), maltose + acarbose (n = 9), Polycose (n = 8), and Polycose + acarbose (n = 9).
For maltose, the main effect of acarbose on blood glucose was nonsignificant, but the interaction of acarbose × time was significant (Table 2, Fig. 6). The interaction reflects the fact that the elevation in blood glucose in acarbose-treated mice was lower at 15 min than that in control mice. It follows that acarbose only partially blocked maltose hydrolysis in the mouth and gut. With regard to plasma insulin, there was a significant main effect of acarbose and a significant interaction of acarbose × time. This reflects the fact that acarbose treatment not only attenuated the plasma insulin spike at 15 min (compared with the control mice) but also prevented plasma insulin from rising significantly above baseline over the entire 60-min sampling period.
For Polycose, there was a significant main effect of acarbose and significant interaction of acarbose × time on blood glucose (Table 2, Fig. 6). Even though blood glucose rose significantly above baseline (at 5, 15, and 30 min) in acarbose-treated mice, it rose significantly less than in control mice. Indeed, it appears that acarbose strongly inhibited (but did not eliminate) the ability of the amylases and α-glucosidases to hydrolyze Polycose. As a result of acarbose treatment, plasma insulin did not rise above baseline across the entire 60-min sampling period.
Experiment 5: does CPIR increase with intensity and duration of oral glucose stimulation?
We found that licking glucose elicited a concentration-dependent increase in CPIR magnitude, peaking at 1 M glucose (F4,58 = 11.7, P < 0.0001) (Fig. 7A). While 0.3 and 0.6 M glucose elicited CPIR, the magnitude was significantly less than that for 1 M glucose. Figure 7B shows that CPIR magnitude also increased monotonically with number of licks taken for 1 M glucose (F3,34 = 4.7, P < 0.008). These results establish that CPIR is a quantitative trait, whose magnitude varies as a function of the intensity and duration of glucose stimulation.
Fig. 7.

CPIR magnitude increased with glucose concentration (A) (i.e., sweetness intensity) and number of licks (B) (i.e., duration of stimulation) (experiment 5). We defined CPIR as a significant increase in plasma insulin concentration, relative to baseline, within 5 min of initiating licking for the taste stimulus (i.e., Δ plasma insulin concentration), based on a one-sample t-test (P < 0.05). For each treatment level, we represent the scores from each mouse as a circle, and the mean score as a horizontal line. We distinguish treatment levels that either did or did not elicit a CPIR with closed and open circles, respectively. We varied stimulation intensity by allowing B6 mice to take a weight-specific number of licks (4.3 licks/g mouse) for different concentrations of glucose. We varied stimulus duration by allowing mice to take different numbers of licks for 1 M glucose. We compared the mean CPIR values within A or B, using Tukey’s multiple comparison test. Means that differ significantly from one another lack a shared letter (i.e., a, b, or c) above them (P < 0.05).
Experiment 6: which signaling proteins are necessary for CPIR?
We previously demonstrated that an intact T1r2+T1r3 receptor is not necessary for CPIR in mice. Here, we tested the necessity of other peripheral taste signaling proteins (Calhm1, P2X3+P2X3, SGLT1, and Sur1) to CPIR with the use of mice with global gene deletions. We asked whether plasma insulin increased within 5 min of initiating licking for 2.8 M glucose. There was no difference in CPIR magnitude among Calhm1 KO, P2X-dbl KO, or SGLT1 KO mice and their respective WT controls (Fig. 8). In contrast, CPIR magnitude in Sur1 KO mice was blocked relative to Sur1 WT mice (unpaired t-value = 2.84, df = 21, P < 0.01). These results indicate that CPIR is mediated by the KATP channel (of which Sur1 is a key component) and does not require Calhm1, P2X2+P2X3, or SGLT1.
Fig. 8.
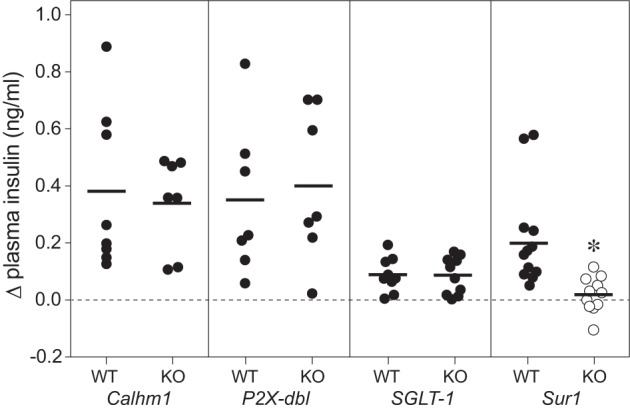
CPIR magnitude (means ± SE) was attenuated by knocking out Sur1, but not by knocking out Calhm1, the P2X2+P2X3 receptor, or SGLT1 (experiment 6). We defined CPIR as a significant increase in plasma insulin concentration, relative to baseline, within 5 min of initiating licking for the taste stimulus (i.e., Δ plasma insulin concentration), based on a one-sample t-test (P < 0.05). For each treatment level, we represent the scores from each mouse as a circle, and the mean score as a horizontal line. We distinguish treatment levels that either did or did not elicit a CPIR with closed and open circles, respectively. All mice took a weight-specific (4.3 licks/g) number of licks for 2.8 M glucose. We compared the response of each type of knockout (KO) mouse to its corresponding wild-type (WT) control, using an unpaired t-test. Only the Sur1 KO mice differed significantly from their WT control (*P < 0.05).
We also examined the impact of knocking out Calhm1, P2X2+P2X3, SGLT1, and Sur1 on blood glucose and plasma insulin over the 60-min period immediately after ingestion. For Calhm1, there were no significant differences between the KO and WT mice in plasma insulin or blood glucose dynamics (Table 3, Fig. 9). This indicates that Calhm1 is not necessary for normal plasma insulin and blood glucose responses to ingested glucose.
Table 3.
Did genetic deletion of Calhm1, P2X2+P2X3, SGLT1, or Sur1 alter plasma insulin or blood glucose response to oral stimulation with glucose (experiment 6)?
| Signaling protein | Blood Measurement | Source of Variation | F Ratio | df | P Value |
|---|---|---|---|---|---|
| Calhm1 | Plasma insulin | Time | 15.0 | 4,52 | <0.001 |
| Genotype | <0.1 | 1,13 | 0.79 | ||
| Interaction | 0.8 | 4,52 | 0.50 | ||
| Blood glucose | Time | 25.7 | 4,52 | <0.0001 | |
| Genotype | 1.7 | 1,13 | 0.21 | ||
| Interaction | 0.4 | 4,52 | 0.82 | ||
| P2X2+P2X3 | Plasma insulin | Time | 12.4 | 4,52 | <0.001 |
| Genotype | 1.4 | 1,13 | 0.26 | ||
| Interaction | 0.5 | 4,52 | 0.72 | ||
| Blood glucose | Time | 32.9 | 4,52 | <0.001 | |
| Genotype | 1.4 | 1,13 | 0.26 | ||
| Interaction | 5.0 | 4,52 | <0.002 | ||
| SGLT1 | Plasma insulin | Time | 10.1 | 4,72 | <0.001 |
| Genotype | 0.7 | 1,18 | 0.43 | ||
| Interaction | 0.9 | 4,72 | 0.44 | ||
| Blood glucose | Time | 14.6 | 4,72 | <0.001 | |
| Genotype | 25.3 | 1,18 | <0.001 | ||
| Interaction | 10.1 | 4,72 | <0.001 | ||
| Sur1 | Plasma insulin | Time | 8.7 | 4,84 | <0.001 |
| Genotype | 3.7 | 1,21 | 0.07 | ||
| Interaction | 4.8 | 4,84 | <0.002 | ||
| Blood glucose | Time | 68.3 | 4,84 | <0.001 | |
| Genotype | 82.2 | 1,21 | <0.001 | ||
| Interaction | 23.3 | 4,84 | <0.001 |
Actual data are presented in Fig. 9. We performed mixed-model ANOVAs, separately for each transduction protein and blood measurement. In each case, time was a within factor and genotype a between factor.
Fig. 9.

Knocking out Calhm1, the P2X2+P2X3 receptor, SGLT1, or Sur1 differentially impacted plasma insulin and blood glucose dynamics (experiment 6). All B6 mice took a mass-specific number of licks (4.3 licks/g mouse) for 2.8 M glucose. We show changes in plasma insulin (top row) and blood glucose (bottom row) concentrations (means ± SE), relative to baseline (B). In each panel, we compare responses of WT and KO mice. In instances where the time × genotype interaction was significant within in a panel (based on results in Table 3), we compared genotypes at each time period with Sidak’s multiple comparison test (#P < 0.05). We also compared the plasma insulin or blood glucose concentration at baseline (B) with that at each successive time-point, separately for each treatment group, using Dunnett’s multiple comparison test (*P < 0.05). We tested the following number of mice: Calhm1 WT (n = 8) and KO (n = 7); P2X-dbl WT (n = 8) and KO (n = 7); SGLT1 WT (n = 10) and KO (n = 10); and Sur1 WT (n = 12) and KO (n = 11).
For P2X2+P2X3, there were no significant differences in plasma insulin dynamics between the KO and WT mice, but there was a significant interaction of genotype × time on blood glucose concentration (Table 3, Fig. 9). This interaction reflects two effects of deleting the P2X2+P2X3 receptor. First, blood glucose concentration rose significantly above baseline in the WT but not in the KO mice at the 5-min sampling period. Second, blood glucose concentration was significantly higher in the KO than in the WT mice at the 30-min sampling period, indicating impaired glucose tolerance in the KO mice. Accordingly, these results indicate that P2X2+P2X3 is necessary for normal glucose tolerance but not for normal plasma insulin responses to ingested glucose.
For SGLT1, there was no significant difference between the KO mice and WT controls in plasma insulin dynamics, although plasma insulin concentration was low in both types of mice (Table 3, Fig. 9). There was a significant main effect of genotype and a significant interaction of genotype × time on blood glucose dynamics. This reflects the fact that blood glucose concentration barely rose above baseline in the KO mice (F4,36 = 3.3, P < 0.03); it exceeded baseline only 60 min after initiating licking (Dunnett’s multiple comparison test, P < 0.05). This shows that SGLT1 is necessary for absorption of glucose but not for eliciting a plasma insulin response to ingested glucose.
For Sur1, there were significant differences between the KO and WT mice in both plasma insulin and blood glucose dynamics (Table 3, Fig. 9). Most importantly, the interaction of genotype × time was significant for plasma insulin, reflecting the absence of an insulin spike during the 5-, 30-, and 60-min sampling periods in Sur1 KO mice. This latter result helps explain why the Sur1 KO mice exhibited such poor glucose tolerance. Thus, Sur1 is necessary for normal plasma insulin and blood glucose responses to ingested glucose.
Experiment 7: is Sur1 necessary for normal taste-mediated licking for sugars?
If the taste-mediated attraction to sugars is dependent on KATP signaling, then genetic deletion of Sur1 should attenuate taste-mediated licking for glucose or sucrose. Figure 10 shows that Sur1 KO and WT mice both exhibited robust concentration-dependent increases in licking for both sugars in brief access tests (P < 0.0001) and that there was no effect of genotype. It follows that Sur1 is not necessary for the normal taste-mediated attraction to glucose or sucrose.
Fig. 10.

Knocking out Sur1 [an essential component of the ATP-sensitive K+ channel (KATP) channel] had no measurable impact on licking for a range of concentrations of glucose or sucrose in brief-access taste tests (experiment 7). We juxtapose licking responses (as indicated by standardized lick ratios) of Sur1 WT (n = 11) and Sur1 KO (n = 9) mice (means ± SE).
Experiment 8: does pharmacological manipulation of KATP channel alter CPIR?
If CPIR is mediated by the KATP channel, then drugs that either enhance (glyburide) or decrease (diazoxide) activity of this channel (22) should enhance or decrease CPIR magnitude in an analogous manner. We tested this prediction in B6 mice. As predicted, glyburide significantly increased CPIR in response to 0.5 M glucose (Fig. 11A), and diazoxide significantly decreased CPIR in response to 1.0 M glucose in B6 mice (Fig. 11B). These results provide direct support for a role of the KATP pathway in taste cells in the generation of CPIR.
Fig. 11.
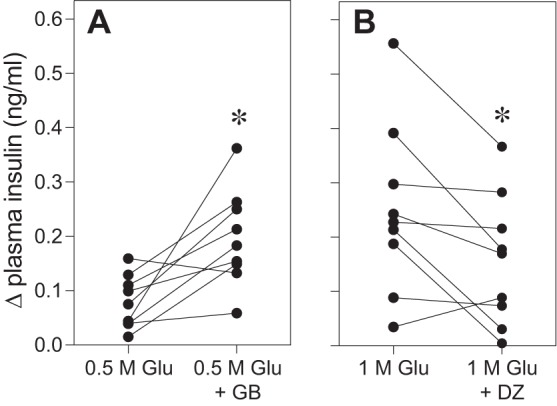
Oral stimulation with drugs known to either increase (glyburide) or decrease (diazoxide) KATP channel activity produced corresponding changes in CPIR magnitude (experiment 8). Each test involved two sessions: one was conducted with a control solution and the other with an experimental solution. A: in the glyburide test, the control solution was 0.5 M glucose (Glu) and the experimental solution was 0.5 M glucose + 0.15 mM glyburide (GB). B: in the diazoxide test, the control solution was 1 M glucose and the experimental solution was 1 M glucose + 0.25 mM diazoxide (DZ). Within a given panel, we represent the results from each mouse as two points connected by a line. The Δ plasma insulin concentration reflects the change in plasma insulin concentration between measurements obtained at baseline and 5 min after a mouse initiated licking for the experimental or control solution. Within each panel, we compare the Δ plasma insulin concentration elicited by the control vs. experimental solutions (paired t-test, *P < 0.03).
DISCUSSION
We demonstrated previously that B6 mice generate a robust rise in plasma insulin within 5 min of initiating licking for glucose (19). We inferred that this early insulin response was mediated by oral stimulation (i.e., that it reflected CPIR) because when we delivered the same dose of glucose intragastrically (i.e., prevented oral stimulation), it took >5 min for plasma insulin to rise above baseline. Here, we obtained additional evidence that oral glucose stimulation triggers CPIR. When we measured minute-by-minute changes in plasma insulin and blood glucose levels immediately after the mice initiated licking for glucose, we found that plasma insulin levels rose above baseline 1–2 min before blood glucose levels did so.
We also made four observations that, when considered together, provide support for the hypothesis that blood glucose levels have limited impact on plasma insulin levels during the 5 min immediately after a glucose drink. First, plasma insulin levels were essentially flat across the 3-, 4-, and 5-min sampling periods, despite a large increase in blood glucose during the 4- and 5-min sampling periods (Fig. 1). Second, the B6 mice experienced a significant rise in blood glucose within 5 min of initiating licking for fructose, but no associated rise in plasma insulin (Fig. 4). Third, the B6 mice exhibited large and roughly equivalent elevations in blood glucose within 5 min of initiating licking for glucose and Polycose (93 and 81.5 mg/dl, respectively). Nevertheless, the rise in plasma insulin elicited by glucose was nearly five times larger than that elicited by Polycose (Fig. 4). Fourth, the SGLT1 KO mice exhibited a small but significant increase in plasma insulin within 5 min of initiating licking for glucose, but no associated change in blood glucose (Fig. 9). The lack of a change in blood glucose in the SGLT1 KO mice reflects the fact that SGLT1 is the primary mechanism for transporting glucose across the intestinal epithelium (21).
If CPIR represents an adaptive feedforward mechanism for helping control blood glucose homeostasis, then one would expect that its magnitude would increase with the intensity and duration of glucose stimulation. In support of this hypothesis, we found that CPIR magnitude increased as a function of both the concentration of glucose and the number of licks taken for 1 M glucose in B6 mice. These results are consistent with a prior study of humans, which reported that CPIR magnitude increases with glucose concentration (67).
Sucrose, maltose, and Polycose also elicited CPIR. However, given the presence of amylases in saliva and α-glucosidases in taste cells, we hypothesized that sucrose, maltose, and Polycose may not have elicited CPIR directly. Instead, the amylases and α-glucosidases may have liberated glucose from the carbohydrates. Accordingly, the liberated glucose could have elicited CPIR. If so, then we predicted that acarbose (a hydrolysis inhibitor) would prevent sucrose, maltose, and Polycose from eliciting CPIR. Our results provided strong support for this prediction: none of the carbohydrates elicited a CPIR in the presence of acarbose. Blood glucose data confirmed that acarbose effectively blocked hydrolysis of the carbohydrates, although to varying degrees (sucrose > Polycose > maltose). The fact that acarbose completely blocked hydrolysis of sucrose and only partially blocked hydrolysis of maltose is consistent with prior studies in humans (30) and rabbits (27). Given that acarbose does not impede entry of glucose into cells lining the small intestine (30, 37), it is unlikely to have done so in taste cells. Likewise, given that other classes of glucosidase inhibitors did not diminish responses of the chorda tympani taste nerve to glucose (54), it is improbable that acarbose interfered with the detection of glucose by taste cells in the present study. In sum, our acarbose results indicate that sucrose, maltose, and Polycose are hydrolyzed in the oral cavity and that the glucose liberated from these carbohydrates triggers CPIR in mice.
What taste signaling pathway mediates CPIR in mice?
CPIR does not appear to be mediated by T1r2+T1r3 and its downstream signaling proteins. This inference is based on two lines of evidence. First, neither the T1r3 subunit of T1r2+T1r3 (19) nor downstream components of the T1r2+T1r3 taste signaling pathway (i.e., Calhm1 and the P2X2+P2X3 receptor) are necessary for CPIR. Second, even though fructose and the artificial sweeteners all bind to T1r2+T1r3 (12), they nevertheless failed to elicit CPIR at highly acceptable concentrations.
We tested two predictions of the hypothesis that CPIR is mediated by SGLT1. Given that MDG binds to SGLT1 (41), we predicted that MDG would elicit CPIR. This did not occur. We also predicted that genetic deletion of SGLT1 would eliminate the glucose-induced CPIR. Contrary to prediction, glucose elicited a CPIR in the SGLT1 KO mice that was equal in magnitude to that in the WT mice. Thus, the glucose-induced CPIR is not mediated by SGLT1. It should be noted, however, that the CPIR generated by the SGLT1 KO and WT controls in experiment 6 was relatively small. This can be attributed to the low (2%) carbohydrate diet given to these mice; e.g., compare the CPIR displayed by B6 mice fed the normal (i.e., 57% carb) chow diet (Fig. 3) with that displayed by SGLT1 WT mice fed the low-carbohydrate (2% carb) diet (Fig. 8). The low-carbohydrate diet may have downregulated the CPIR signaling pathway in taste cells, diminished insulin production in pancreatic β-cells (66), or enhanced insulin clearance. It is notable that this low-carbohydrate diet does not reduce the preference of SGLT1 KO or B6 WT mice for saccharin (relative to B6 mice fed a normal high-carbohydrate diet) (46).
We obtained four convergent lines of support for the hypothesis that the KATP channel is part of a novel taste-signaling pathway for detecting glucose and eliciting CPIR. First, glucose was both sufficient and necessary for eliciting CPIR. Second, fructose and MDG, which do not activate the KATP channel on their own (33, 70), did not elicit CPIR. Third, Sur1 (a critical component of the KATP channel) was necessary for eliciting CPIR. Fourth, oral stimulation with drugs that either increase or decrease KATP signaling elicited corresponding changes in glucose-stimulated CPIR. Contrary to the present findings, Seino et al. (48) concluded that CPIR is not mediated by the KATP pathway in mice. However, because these investigators defined CPIR as a rise in plasma insulin within 15 min of initiating feeding, they could not dissociate the relative contribution of oral versus postabsorptive glucose stimulation to the rise in plasma insulin.
We still have a limited understanding of the nature of the KATP signaling pathway in taste cells. Yee et al. (68) demonstrated that several GLUTs and the KATP channel are expressed and functional in T1r3-positive taste cells. Accordingly, the upstream components of the KATP signaling pathway in taste cells may be similar to those in pancreatic β-cells. Knowledge about downstream components of the KATP signaling pathway is less complete. We found that genetic deletion of Calhm1 (an ATP-release channel) or P2X2+P2X3 (the receptor for ATP on afferent nerve fibers) did not attenuate the early rise in insulin (i.e., CPIR). This suggests that the KATP signaling pathway does not utilize ATP as a neurotransmitter for relaying signals from taste buds to gustatory afferents. Accordingly, it is possible that the KATP pathway stimulates release of a different neurotransmitter; e.g., serotonin (28, 35). This latter possibility is supported by the observation that oral stimulation with 0.3 M glucose generates small but reliable chorda tympani (CT) nerve responses to 0.3 M glucose and sucrose in Calhm1 KO mice (56) but is contradicted by the absence of a CT nerve response to 0.5 M sucrose in P2X-dbl KO mice (15).
Additional studies are needed to determine how activation of the KATP signaling pathway in taste cells triggers insulin release from pancreatic β-cells. One hypothesis involves a neural mechanism; e.g., activated taste cells stimulate ascending gustatory pathways, which in turn stimulate preganglionic parasympathetic neurons within the DMNV, resulting in the release of acetylcholine onto pancreatic β-cells and secretion of insulin (6, 17). There are several lines of support for this neural mechanism in the rat (7, 8, 50). A second hypothesis involves a humoral mechanism; e.g., activated taste cells release a signaling molecule, which is conveyed directly to pancreatic β-cells via the blood. GLP-1 has been hypothesized to act in this manner based on the observation that it is released from murine taste cells in response to oral stimulation with glucose, sucrose, or saccharin (32, 55). Two findings contradict this hypothesis, however. First, even though GLP-1 enhances glucose-stimulated insulin release from β-cells, it does not stimulate insulin release on its own (43). Second, Takai et al. (55) found that oral stimulation with saccharin causes GLP-1 release from murine taste cells. If this taste cell-derived GLP-1 mediates CPIR, then oral stimulation with saccharin should have triggered CPIR in the present study. This was not the case.
Artificial sweeteners and CPIR.
None of the artificial sweeteners elicited CPIR in the B6 mice, despite the fact that we used highly acceptable concentrations of each. For other species, there are contradictory reports about whether artificial sweeteners elicit CPIR. In rats, six studies reported that artificial sweeteners elicit CPIR (6, 44, 59, 60, 65), whereas one reported that they do not (25). In humans, one study reported that artificial sweeteners elicit CPIR (31), whereas four reported that they do not (1, 13, 26, 58). These contradictory findings may stem in part from the fact that the studies did not all use the same concentrations of each artificial sweetener. For example, among the studies that tested saccharin in humans, the one that observed CPIR used a 10 mM concentration (31), whereas the ones that failed to do so used concentrations ≤3 mM (26, 58). It is also possible that the CPIR elicited by 10 mM saccharin (31) represents a conditioned response based on prior experience with saccharin and ingested sugars (e.g., see Ref. 64).
We can offer one explanation for how artificial sweeteners could trigger CPIR rats and humans, but not mice. Here, we found that incapacitation of the KATP pathway abolishes CPIR but has no apparent impact on taste-mediated licking for sugars. In contrast, we reported previously that incapacitation of the T1r2+T1r3 pathway abolishes taste-mediated licking for sugars but has no apparent impact on CPIR (19). Taken together, these observations indicate that despite occurring within the same taste cell (68), the KATP and T1r2+T1r3 signaling pathways function (at least partially) independently of one another and generate distinct physiological responses in mice. If we assume that the same basic configuration exists in the taste cells of rats and humans, then it is possible that there is more crosstalk between the two signaling pathways in these species. Accordingly, when artificial sweeteners activate the T1r2+T1r3 pathway in rats and humans, they could also activate downstream components of the KATP pathway and thereby elicit CPIR.
Perspectives and Significance
Several studies have postulated the existence of a T1r2+T1r3-independent signaling pathway for tasting carbohydrates (16, 45, 62, 72), but this study is the first to implicate a specific pathway; namely, the KATP signaling pathway. This T1r2+T1r3-independent signaling pathway does not appear to play a role in motivating intake of carbohydrates. Instead, it helps animals determine the concentration of glucose or glucose-containing carbohydrates in food and generate a CPIR of appropriate magnitude. Notably, the physiological impact of activating the KATP signaling pathway may not be limited to insulin release. There is evidence, for instance, that oral stimulation with glucose alters celiac artery blood flow and gastric myoelectrical activity in humans (14).
Given that type 2 diabetes now afflicts nearly 10% of Americans (11), it is critical to gain a more complete understanding of the mechanisms that regulate insulin section and glucose tolerance. Despite clear evidence that oral stimulation with food-related chemical stimuli triggers CPIR and dramatically improves glucose tolerance in humans (10, 57), rats (52) and mice (19), most studies of glucose tolerance in rodents bypass oral stimulation and administer nutrients either intragastrically or intravenously (2, 5, 9, 38). We recommend that future studies of glucose tolerance in rodents incorporate oral stimulation into the experimental design.
GRANTS
This research was supported in part by grants from the Howard Hughes Medical Institute and the Sherman Fairchild Foundation to Barnard College, the National Institute of Diabetes and Digestive and Kidney Diseases (DK-031135) to Brooklyn College, and a Beckman Scholar Award to Y. G. Frim from the Arnold and Mabel Beckman Foundation.
DISCLOSURES
No conflicts of interest, financial or otherwise, are declared by the author(s).
AUTHOR CONTRIBUTIONS
J.I.G. conceived and designed research; J.I.G., Y.G.F., A.H., G.S.L., and A.J.B. performed experiments; J.I.G. analyzed data; J.I.G., Y.G.F., A.H., G.S.L., A.J.B., and A.S. interpreted results of experiments; J.I.G. prepared figures; J.I.G. drafted manuscript; J.I.G., Y.G.F., A.H., G.S.L., A.J.B., and A.S. edited and revised manuscript; J.I.G., Y.G.F., A.H., G.S.L., A.J.B., and A.S. approved final version of manuscript.
ACKNOWLEDGMENTS
We thank Lillian Brouwer, Camilo A. Mejia, Ilina Odouard, and David Richard for help collecting the data.
REFERENCES
- 1.Abdallah L, Chabert M, Louis-Sylvestre J. Cephalic phase responses to sweet taste. Am J Clin Nutr 65: 737–743, 1997. [DOI] [PubMed] [Google Scholar]
- 2.Andrikopoulos S, Blair AR, Deluca N, Fam BC, Proietto J. Evaluating the glucose tolerance test in mice. Am J Physiol Endocrinol Metab 295: E1323–E1332, 2008. doi: 10.1152/ajpendo.90617.2008. [DOI] [PubMed] [Google Scholar]
- 3.Ashcroft FM. ATP-sensitive K channels and disease: from molecule to malady. Am J Physiol Endocrinol Metab 293: E880–E889, 2007. doi: 10.1152/ajpendo.00348.2007. [DOI] [PubMed] [Google Scholar]
- 4.Ashcroft FM. ATP-sensitive potassium channelopathies: focus on insulin secretion. J Clin Invest 115: 2047–2058, 2005. doi: 10.1172/JCI25495. [DOI] [PMC free article] [PubMed] [Google Scholar]
- 5.Ayala JE, Samuel VT, Morton GJ, Obici S, Croniger CM, Shulman GI, Wasserman DH, McGuinness OP; NIH Mouse Metabolic Phenotyping Center Consortium . Standard operating procedures for describing and performing metabolic tests of glucose homeostasis in mice. Dis Model Mech 3: 525–534, 2010. doi: 10.1242/dmm.006239. [DOI] [PMC free article] [PubMed] [Google Scholar]
- 6.Berthoud H-R, Bereiter DA, Trimble ER, Siegel EG, Jeanrenaud B. Cephalic phase, reflex insulin secretion neuroanatomical and physiological characterization. Diabetologia 20, Suppl 1: 393–401, 1981. doi: 10.1007/BF00254508. [DOI] [PubMed] [Google Scholar]
- 7.Berthoud H-R, Trimble ER, Siegel EG, Bereiter DA, Jeanrenaud B. Cephalic-phase insulin secretion in normal and pancreatic islet-transplanted rats. Am J Physiol Endocrinol Metab 238: E336–E340, 1980. [DOI] [PubMed] [Google Scholar]
- 8.Berthoud HR, Jeanrenaud B. Sham feeding-induced cephalic phase insulin release in the rat. Am J Physiol Endocrinol Metab 242: E280–E285, 1982. [DOI] [PubMed] [Google Scholar]
- 9.Breda E, Cavaghan MK, Toffolo G, Polonsky KS, Cobelli C. Oral glucose tolerance test minimal model indexes of beta-cell function and insulin sensitivity. Diabetes 50: 150–158, 2001. doi: 10.2337/diabetes.50.1.150. [DOI] [PubMed] [Google Scholar]
- 10.Calles-Escandon J, Robbins DC. Loss of early phase of insulin release in humans impairs glucose tolerance and blunts thermic effect of glucose. Diabetes 36: 1167–1172, 1987. doi: 10.2337/diab.36.10.1167. [DOI] [PubMed] [Google Scholar]
- 11.Centers for Disease Control and Prevention National Diabetes Statistics Report, 2014. National Center for Chronic Disease Prevention and Health Promotion (Division of Diabetes Translation). http://www.cdc.gov/diabetes/pubs/statsreport14/national-diabetes-report-web.pdf.
- 12.DuBois GE. Molecular mechanism of sweetness sensation. Physiol Behav 164: 453–463, 2016. doi: 10.1016/j.physbeh.2016.03.015. [DOI] [PubMed] [Google Scholar]
- 13.Dušková M, Macourek M, Šrámková M, Hill M, Stárka L. The role of taste in cephalic phase of insulin secretion. Prague Med Rep 114: 222–230, 2013. doi: 10.14712/23362936.2014.11. [DOI] [PubMed] [Google Scholar]
- 14.Eguchi K, Kashima H, Yokota A, Miura K, Yamaoka Endo M, Hirano H, Tsuji T, Fukuba Y. Acute effect of oral sensation of sweetness on celiac artery blood flow and gastric myoelectrical activity in humans. Auton Neurosci 197: 41–45, 2016. doi: 10.1016/j.autneu.2016.03.002. [DOI] [PubMed] [Google Scholar]
- 15.Finger TE, Danilova V, Barrows J, Bartel DL, Vigers AJ, Stone L, Hellekant G, Kinnamon SC. ATP signaling is crucial for communication from taste buds to gustatory nerves. Science 310: 1495–1499, 2005. doi: 10.1126/science.1118435. [DOI] [PubMed] [Google Scholar]
- 16.Frank GKW, Oberndorfer TA, Simmons AN, Paulus MP, Fudge JL, Yang TT, Kaye WH. Sucrose activates human taste pathways differently from artificial sweetener. Neuroimage 39: 1559–1569, 2008. doi: 10.1016/j.neuroimage.2007.10.061. [DOI] [PubMed] [Google Scholar]
- 17.Gilon P, Henquin JC. Mechanisms and physiological significance of the cholinergic control of pancreatic beta-cell function. Endocr Rev 22: 565–604, 2001. doi: 10.1210/edrv.22.5.0440. [DOI] [PubMed] [Google Scholar]
- 18.Glendinning JI, Gresack J, Spector AC. A high-throughput screening procedure for identifying mice with aberrant taste and oromotor function. Chem Senses 27: 461–474, 2002. doi: 10.1093/chemse/27.5.461. [DOI] [PubMed] [Google Scholar]
- 19.Glendinning JI, Stano S, Holter M, Azenkot T, Goldman O, Margolskee RF, Vasselli JR, Sclafani A. Sugar-induced cephalic-phase insulin release is mediated by a T1r2+T1r3-independent taste transduction pathway in mice. Am J Physiol Regul Integr Comp Physiol 309: R552–R560, 2015. doi: 10.1152/ajpregu.00056.2015. [DOI] [PMC free article] [PubMed] [Google Scholar]
- 20.Golde WT, Gollobin P, Rodriguez LL. A rapid, simple, and humane method for submandibular bleeding of mice using a lancet. Lab Anim (NY) 34: 39–43, 2005. doi: 10.1038/laban1005-39. [DOI] [PubMed] [Google Scholar]
- 21.Gorboulev V, Schürmann A, Vallon V, Kipp H, Jaschke A, Klessen D, Friedrich A, Scherneck S, Rieg T, Cunard R, Veyhl-Wichmann M, Srinivasan A, Balen D, Breljak D, Rexhepaj R, Parker HE, Gribble FM, Reimann F, Lang F, Wiese S, Sabolic I, Sendtner M, Koepsell H. Na(+)-D-glucose cotransporter SGLT1 is pivotal for intestinal glucose absorption and glucose-dependent incretin secretion. Diabetes 61: 187–196, 2012. doi: 10.2337/db11-1029. [DOI] [PMC free article] [PubMed] [Google Scholar]
- 22.Gribble FM, Reimann F. Sulphonylurea action revisited: the post-cloning era. Diabetologia 46: 875–891, 2003. doi: 10.1007/s00125-003-1143-3. [DOI] [PubMed] [Google Scholar]
- 23.Gribble FM, Tucker SJ, Ashcroft FM. The essential role of the Walker A motifs of SUR1 in K-ATP channel activation by Mg-ADP and diazoxide. EMBO J 16: 1145–1152, 1997. doi: 10.1093/emboj/16.6.1145. [DOI] [PMC free article] [PubMed] [Google Scholar]
- 24.Gribble FM, Williams L, Simpson AK, Reimann F. A novel glucose-sensing mechanism contributing to glucagon-like peptide-1 secretion from the GLUTag cell line. Diabetes 52: 1147–1154, 2003. doi: 10.2337/diabetes.52.5.1147. [DOI] [PubMed] [Google Scholar]
- 25.Grill HJ, Berridge KC, Ganster DJ. Oral glucose is the prime elicitor of preabsorptive insulin secretion. Am J Physiol 246: R88–R95, 1984. [DOI] [PubMed] [Google Scholar]
- 26.Härtel B, Graubaum H-J, Schneider B. The influence of sweetener solutions on the secretion of insulin and the blood glucose level. Ernährungsumschau 40: 152–155, 1993. [Google Scholar]
- 27.Heitlinger LA, Li BUK, Murray RD, McClung HJ, Sloan HR, DeVore DR, Powers P. Glucose flux from dietary disaccharides: all sugars are not absorbed at equal rates. Am J Physiol Gastrointest Liver Physiol 261: G818–G822, 1991. [DOI] [PubMed] [Google Scholar]
- 28.Huang YA, Dando R, Roper SD. Autocrine and paracrine roles for ATP and serotonin in mouse taste buds. J Neurosci 29: 13909–13918, 2009. doi: 10.1523/JNEUROSCI.2351-09.2009. [DOI] [PMC free article] [PubMed] [Google Scholar]
- 29.Jakinovich W., Jr Taste aversion to sugars by the gerbil. Physiol Behav 28: 1065–1071, 1982. doi: 10.1016/0031-9384(82)90176-7. [DOI] [PubMed] [Google Scholar]
- 30.Jenkins DJA, Taylor RH, Goff DV, Fielden H, Misiewicz JJ, Sarson DL, Bloom SR, Alberti KG. Scope and specificity of acarbose in slowing carbohydrate absorption in man. Diabetes 30: 951–954, 1981. doi: 10.2337/diab.30.11.951. [DOI] [PubMed] [Google Scholar]
- 31.Just T, Pau HW, Engel U, Hummel T. Cephalic phase insulin release in healthy humans after taste stimulation? Appetite 51: 622–627, 2008. doi: 10.1016/j.appet.2008.04.271. [DOI] [PubMed] [Google Scholar]
- 32.Kokrashvili Z, Yee KK, Ilegems E, Iwatsuki K, Li Y, Mosinger B, Margolskee RF. Endocrine taste cells. Br J Nutr 111, Suppl 1: S23–S29, 2014. doi: 10.1017/S0007114513002262. [DOI] [PMC free article] [PubMed] [Google Scholar]
- 33.Kyriazis GA, Soundarapandian MM, Tyrberg B. Sweet taste receptor signaling in beta cells mediates fructose-induced potentiation of glucose-stimulated insulin secretion. Proc Natl Acad Sci USA 109: E524–E532, 2012. doi: 10.1073/pnas.1115183109. [DOI] [PMC free article] [PubMed] [Google Scholar]
- 34.Lapis TJ, Penner MH, Lim J. Humans can taste glucose oligomers independent of the hT1R2/hT1R3 sweet taste receptor. Chem Senses 41: 755–762, 2016. doi: 10.1093/chemse/bjw088. [DOI] [PubMed] [Google Scholar]
- 35.Larson ED, Vandenbeuch A, Voigt A, Meyerhof W, Kinnamon SC, Finger TE. The role of 5–HT3 receptors in signaling from taste buds to nerves. J Neurosci 35: 15984–15995, 2015. doi: 10.1523/JNEUROSCI.1868-15.2015. [DOI] [PMC free article] [PubMed] [Google Scholar]
- 36.Louis-Sylvestre J. Preabsorptive insulin release and hypoglycemia in rats. Am J Physiol 230: 56–60, 1976. [DOI] [PubMed] [Google Scholar]
- 37.Madariaga H, Lee PC, Heitlinger LA, Lebenthal E. Effects of graded α-glucosidase inhibition on sugar absorption in vivo. Dig Dis Sci 33: 1020–1024, 1988. doi: 10.1007/BF01536000. [DOI] [PubMed] [Google Scholar]
- 38.Dalla Man C, Caumo A, Basu R, Rizza R, Toffolo G, Cobelli C. Minimal model estimation of glucose absorption and insulin sensitivity from oral test: validation with a tracer method. Am J Physiol Endocrinol Metab 287: E637–E643, 2004. doi: 10.1152/ajpendo.00319.2003. [DOI] [PubMed] [Google Scholar]
- 39.Martin AE, Montgomery PA. Acarbose: an alpha-glucosidase inhibitor. Am J Health Syst Pharm 53: 2277–2290, 1996. [DOI] [PubMed] [Google Scholar]
- 40.Merigo F, Benati D, Cristofoletti M, Osculati F, Sbarbati A. Glucose transporters are expressed in taste receptor cells. J Anat 219: 243–252, 2011. doi: 10.1111/j.1469-7580.2011.01385.x. [DOI] [PMC free article] [PubMed] [Google Scholar]
- 41.Moriya R, Shirakura T, Ito J, Mashiko S, Seo T. Activation of sodium-glucose cotransporter 1 ameliorates hyperglycemia by mediating incretin secretion in mice. Am J Physiol Endocrinol Metab 297: E1358–E1365, 2009. doi: 10.1152/ajpendo.00412.2009. [DOI] [PubMed] [Google Scholar]
- 42.Nissenbaum JW, Sclafani A. Qualitative differences in polysaccharide and sugar tastes in the rat: a two-carbohydrate taste model. Neurosci Biobehav Rev 11: 187–196, 1987. doi: 10.1016/S0149-7634(87)80025-8. [DOI] [PubMed] [Google Scholar]
- 43.Parker HE, Habib AM, Rogers GJ, Gribble FM, Reimann F. Nutrient-dependent secretion of glucose-dependent insulinotropic polypeptide from primary murine K cells. Diabetologia 52: 289–298, 2009. doi: 10.1007/s00125-008-1202-x. [DOI] [PMC free article] [PubMed] [Google Scholar]
- 44.Powley TL, Berthoud H-R. Diet and cephalic phase insulin responses. Am J Clin Nutr 42, Suppl: 991–1002, 1985. [DOI] [PubMed] [Google Scholar]
- 45.Schier LA, Spector AC. Behavioral evidence for more than one taste signaling pathway for sugars in rats. J Neurosci 36: 113–124, 2016. doi: 10.1523/JNEUROSCI.3356-15.2016. [DOI] [PMC free article] [PubMed] [Google Scholar]
- 46.Sclafani A, Koepsell H, Ackroff K. SGLT1 sugar transporter/sensor is required for post-oral glucose appetition. Am J Physiol Regul Integr Comp Physiol 310: R631–R639, 2016. doi: 10.1152/ajpregu.00432.2015. [DOI] [PMC free article] [PubMed] [Google Scholar]
- 47.Seghers V, Nakazaki M, DeMayo F, Aguilar-Bryan L, Bryan J. Sur1 knockout mice. A model for K(ATP) channel-independent regulation of insulin secretion. J Biol Chem 275: 9270–9277, 2000. doi: 10.1074/jbc.275.13.9270. [DOI] [PubMed] [Google Scholar]
- 48.Seino Y, Miki T, Fujimoto W, Young Lee E, Takahashi Y, Minami K, Oiso Y, Seino S. Cephalic phase insulin secretion is KATP channel independent. J Endocrinol 218: 25–33, 2013. doi: 10.1530/JOE-12-0579. [DOI] [PubMed] [Google Scholar]
- 49.Shinozaki K, Shimizu Y, Shiina T, Morita H, Takewaki T. Relationship between taste-induced physiological reflexes and temperature of sweet taste. Physiol Behav 93: 1000–1004, 2008. doi: 10.1016/j.physbeh.2008.01.006. [DOI] [PubMed] [Google Scholar]
- 50.Siegel EG, Trimble ER, Renold AE, Berthoud HR. Importance of preabsorptive insulin release on oral glucose tolerance: studies in pancreatic islet transplanted rats. Gut 21: 1002–1009, 1980. doi: 10.1136/gut.21.11.1002. [DOI] [PMC free article] [PubMed] [Google Scholar]
- 51.Smeets PAM, Erkner A, de Graaf C. Cephalic phase responses and appetite. Nutr Rev 68: 643–655, 2010. doi: 10.1111/j.1753-4887.2010.00334.x. [DOI] [PubMed] [Google Scholar]
- 52.Steffens AB. Influence of the oral cavity on insulin release in the rat. Am J Physiol 230: 1411–1415, 1976. [DOI] [PubMed] [Google Scholar]
- 53.Strubbe JH, Steffens AB. Rapid insulin release after ingestion of a meal in the unanesthetized rat. Am J Physiol 229: 1019–1022, 1975. [DOI] [PubMed] [Google Scholar]
- 54.Sukumaran SK, Yee KK, Iwata S, Kotha R, Quezada-Calvillo R, Nichols BL, Mohane S, Pintoe BM, Shigemurab N, Ninomiya Y, and Margolskee RF. Taste cell-expressed α-glucosidase enzymes contribute to gustatory responses to disaccharides. Proc Natl Acad Sci USA 113: 6035-6040, 2016. doi: 10.1073/pnas.1520843113. [DOI] [PMC free article] [PubMed] [Google Scholar]
- 55.Takai S, Yasumatsu K, Inoue M, Iwata S, Yoshida R, Shigemura N, Yanagawa Y, Drucker DJ, Margolskee RF, Ninomiya Y. Glucagon-like peptide-1 is specifically involved in sweet taste transmission. FASEB J 29: 2268–2280, 2015. doi: 10.1096/fj.14-265355. [DOI] [PMC free article] [PubMed] [Google Scholar]
- 56.Taruno A, Vingtdeux V, Ohmoto M, Ma Z, Dvoryanchikov G, Li A, Adrien L, Zhao H, Leung S, Abernethy M, Koppel J, Davies P, Civan MM, Chaudhari N, Matsumoto I, Hellekant G, Tordoff MG, Marambaud P, Foskett JK. CALHM1 ion channel mediates purinergic neurotransmission of sweet, bitter and umami tastes. Nature 495: 223–226, 2013. doi: 10.1038/nature11906. [DOI] [PMC free article] [PubMed] [Google Scholar]
- 57.Teff KL. How neural mediation of anticipatory and compensatory insulin release helps us tolerate food. Physiol Behav 103: 44–50, 2011. doi: 10.1016/j.physbeh.2011.01.012. [DOI] [PMC free article] [PubMed] [Google Scholar]
- 58.Teff KL, Devine J, Engelman K. Sweet taste: effect on cephalic phase insulin release in men. Physiol Behav 57: 1089–1095, 1995. doi: 10.1016/0031-9384(94)00373-D. [DOI] [PubMed] [Google Scholar]
- 59.Tonosaki K, Hori Y, Shimizu Y, Tonosaki K. Relationships between insulin release and taste. Biomed Res 28: 79–83, 2007. doi: 10.2220/biomedres.28.79. [DOI] [PubMed] [Google Scholar]
- 60.Tordoff MG, Friedman MI. Drinking saccharin increases food intake and preference. IV. Cephalic phase and metabolic factors. Appetite 12: 37–56, 1989. doi: 10.1016/0195-6663(89)90067-6. [DOI] [PubMed] [Google Scholar]
- 61.Toyono T, Seta Y, Kataoka S, Oda M, Toyoshima K. Differential expression of the glucose transporters in mouse gustatory papillae. Cell Tissue Res 345: 243–252, 2011. doi: 10.1007/s00441-011-1210-x. [DOI] [PubMed] [Google Scholar]
- 62.Treesukosol Y, Blonde GD, Spector AC. T1R2 and T1R3 subunits are individually unnecessary for normal affective licking responses to Polycose: implications for saccharide taste receptors in mice. Am J Physiol Regul Integr Comp Physiol 296: R855–R865, 2009. doi: 10.1152/ajpregu.90869.2008. [DOI] [PMC free article] [PubMed] [Google Scholar]
- 63.Vandenbeuch A, Larson ED, Anderson CB, Smith SA, Ford AP, Finger TE, Kinnamon SC. Postsynaptic P2X3-containing receptors in gustatory nerve fibres mediate responses to all taste qualities in mice. J Physiol 593: 1113–1125, 2015. doi: 10.1113/jphysiol.2014.281014. [DOI] [PMC free article] [PubMed] [Google Scholar]
- 64.Weingarten HP, Powley TL. Pavlovian conditioning of the cephalic phase of gastric acid secretion in the rat. Physiol Behav 27: 217–221, 1981. doi: 10.1016/0031-9384(81)90260-2. [DOI] [PubMed] [Google Scholar]
- 65.Woods SC, Bernstein IL. Cephalic insulin response as a test for completeness of vagotomy to the pancreas. Physiol Behav 24: 485–488, 1980. doi: 10.1016/0031-9384(80)90241-3. [DOI] [PubMed] [Google Scholar]
- 66.Wortham M, Sander M. Mechanisms of β-cell functional adaptation to changes in workload. Diabetes Obes Metab 18, Suppl 1: 78–86, 2016. doi: 10.1111/dom.12729. [DOI] [PMC free article] [PubMed] [Google Scholar]
- 67.Yamazaki M, Sakaguchi T. Effects of D-glucose anomers on sweetness taste and insulin release in man. Brain Res Bull 17: 271–274, 1986. doi: 10.1016/0361-9230(86)90126-7. [DOI] [PubMed] [Google Scholar]
- 68.Yee KK, Sukumaran SK, Kotha R, Gilbertson TA, Margolskee RF. Glucose transporters and ATP-gated K+ (KATP) metabolic sensors are present in type 1 taste receptor 3 (T1r3)-expressing taste cells. Proc Natl Acad Sci USA 108: 5431–5436, 2011. doi: 10.1073/pnas.1100495108. [DOI] [PMC free article] [PubMed] [Google Scholar]
- 69.Zafra MA, Molina F, Puerto A. The neural/cephalic phase reflexes in the physiology of nutrition. Neurosci Biobehav Rev 30: 1032–1044, 2006. doi: 10.1016/j.neubiorev.2006.03.005. [DOI] [PubMed] [Google Scholar]
- 70.Zawalich WS, Rognstad R, Pagliara AS, Matschinsky FM. A comparison of the utilization rates and hormone-releasing actions of glucose, mannose, and fructose in isolated pancreatic islets. J Biol Chem 252: 8519–8523, 1977. [PubMed] [Google Scholar]
- 71.Zhao GQ, Zhang Y, Hoon MA, Chandrashekar J, Erlenbach I, Ryba NJP, Zuker CS. The receptors for mammalian sweet and umami taste. Cell 115: 255–266, 2003. doi: 10.1016/S0092-8674(03)00844-4. [DOI] [PubMed] [Google Scholar]
- 72.Zukerman S, Glendinning JI, Margolskee RF, Sclafani A. T1R3 taste receptor is critical for sucrose but not Polycose taste. Am J Physiol Regul Integr Comp Physiol 296: R866–R876, 2009. doi: 10.1152/ajpregu.90870.2008. [DOI] [PMC free article] [PubMed] [Google Scholar]