

Here, we apply a novel method for screening transcripts based on a substrate-specific expression pattern to identify Trp53inp2 as an induced cardiomyocyte glucose utilization factor. We further show that reducing expression of the gene could effectively blunt hypertrophic response in the context of elevated glucose content.
Keywords: glucose, Trp53inp2, metabolic shift, hypertrophy
Abstract
Cardiac failure has been widely associated with an increase in glucose utilization. The aim of our study was to identify factors that mechanistically bridge this link between hyperglycemia and heart failure. Here, we screened the Hybrid Mouse Diversity Panel (HMDP) for substrate-specific cardiomyocyte candidates based on heart transcriptional profile and circulating nutrients. Next, we utilized an in vitro model of rat cardiomyocytes to demonstrate that the gene expression changes were in direct response to substrate abundance. After overlaying candidates of interest with a separate HMDP study evaluating isoproterenol-induced heart failure, we chose to focus on the gene Trp53inp2 as a cardiomyocyte glucose utilization-specific factor. Trp53inp2 gene knockdown in rat cardiomyocytes reduced expression and protein abundance of key glycolytic enzymes. This resulted in reduction of both glucose uptake and glycogen content in cardiomyocytes stimulated with isoproterenol. Furthermore, this reduction effectively blunted the capacity of glucose and isoprotereonol to synergistically induce hypertrophic gene expression and cell size expansion. We conclude that Trp53inp2 serves as regulator of cardiomyocyte glycolytic activity and can consequently regulate hypertrophic response in the context of elevated glucose content.
NEW & NOTEWORTHY Here, we apply a novel method for screening transcripts based on a substrate-specific expression pattern to identify Trp53inp2 as an induced cardiomyocyte glucose utilization factor. We further show that reducing expression of the gene could effectively blunt hypertrophic response in the context of elevated glucose content.
impaired heart metabolism has been shown as both contributory and causal to cardiac failure (45, 57, 60, 61). The heart possesses a unique capacity to utilize a diverse array of substrates and shift preferences as a result of availability and/or disease state. Multiple studies have shown a clear association between heart failure (HF) and reduction of fatty acid oxidation machinery (36, 38, 47, 54). To account for sustained energetic demands, this reduction in lipid oxidation is generally accompanied by increased glucose utilization (3, 53, 63). Although these phenomena have been described in detail, the specific mechanisms of cardiomyocyte substrate preference and utilization remain unclear.
The relative contribution of this metabolic shift to a HF phenotype has been widely debated over the past few decades. Much of this debate has focused on differing observations as to the extent of glucose uptake (2, 71) and subsequent oxidation (1, 11, 14, 31) in connection with HF. Many of these discrepancies are thought to be due to the complex etiology underlying HF and the various models used to assess it as well as the idiopathic progression of the disease (15, 26, 61, 68).
Here, we took a systems genetics approach to identify cardiomyocyte genes whose expression was dependent on a glucose-specific profile. We surveyed a panel of 100 inbred strains that we examined previously for global transcript levels either untreated or treated for 3 wk with isoproterenol. Isoproterenol was used to mimic the catecholamine-driven cardiac hypertrophy and pathological remodeling (51, 69). We first screened untreated mice for substrate-specific cardiomyocyte candidate genes based on heart transcriptional profiles and circulating nutrients. We then validated these by demonstrating responsiveness to substrate abundance. Next, we overlaid these candidates with results from an isoproterenol panel and identified Trp53inp2 as having striking associations to disease traits.
The gene Trp53inp2 has been implicated recently in several other relevant functions and diseases. It was initially cloned in 2007 as a transcriptional activator of thyroid hormone receptor-α in skeletal muscle (6). Subsequent studies showed the gene as a homolog of the Drosophila deep orange gene, which serves as a crucial regulator of autophagic function in flies and mammals (19, 39, 44, 55). Another intriguing study in 2011 identified the factor as a potential master regulator of obesity, specifically in the context of adipogenesis (43).
The gene may exert tissue-specific roles in maintaining cellular metabolic machinery. Substantial work over the past decade has elucidated the interconnectivity of cellular metabolism and autophagic function (22, 50, 58). Trp53inp2 could also be regulating cardiomyocyte autophagic function, which feeds back on general metabolic and hypertrophic machinery, although before this study, the gene function in heart tissue had yet to be explored. Future examination of direct and specific genes of Trp53inp2 would likely yield substantial insight to the mechanism of gene function. Furthermore, mouse models using tissue-specific overexpression or genetic ablation could provide a more comprehensive physiological view of cardiac-specific functional consequences of Trp53inp2.
In the present study, we identify Trp53inp2 through correlation and screening as a link between cardiomyocyte metabolism and hypertrophy. We show that this gene serves as a regulator of both glycolytic and hypertrophic gene expression, which can effectively blunt the ability of glucose and isoproterenol to synergistically promote cardiomyocyte hypertrophic response.
MATERIALS AND METHODS
Animals.
All animal experiments were approved by the University of California Los Angeles (UCLA) Animal Care and Use Committee in accordance with Public Health Service guidelines. Hybrid Mouse Diversity Panel (HMDP) strains were purchased from Jackson Laboratories and then bred in our colony and housed in a 12-h light-dark cycle room at UCLA and fed a standard chow diet (23). HMDP studies involving osmotic pump administration containing saline or isoprotereonol were also performed in an earlier study (52). ISO (30 mg·kg body wt−1·day−1; Sigma) was administered for 21 days in 8- to 10-wk-old female mice using ALZET osmotic minipumps, which were surgically implanted intraperitoneally.
Arrays.
Heart expression arrays were performed as described previously (23, 52). Following homogenization of LV tissue samples in QIAzol, RNA was extracted using the Qiagen miRNAeasy extraction kit and verified as having a RIN>7 by Agilent Bioanalyzer. Two RNA samples were pooled for each strain/experimental condition whenever possible and arrayed on Illumina Mouse Reference 8 version 2.0 chips. Analysis was conducted using the Neqc algorithm included in the limma R package.
Cell culture.
Rat neonatal ventricular cardiomyocytes were isolated and cultured as described previously (48). Cells were cultured in 0.1% gelatin solution using DMEM supplemented with 10% FBS (Atlanta Biologicals), 100 U/ml penicillin, 100 µg/ml streptomycin, and 1 mmol/l sodium pyruvate. For experiments assessing hypertrophic protein levels in cardiomyocytes, treatment conditions also contained 5 µM Brefeldin A (Thermo, cat. no. B7450).
Culture media preparation.
For experiments altering circulating levels of glucose and palmitate, DMEM containing l-glutamine and no glucose-containing antibiotics were used (Thermo, cat. no. 11966025). This media were then supplemented with 0.1% fatty acid-free bovine serum albumin (Sigma, no. A8808) and the indicated amounts of glucose. To prepare media containing palmitic acid, we used a conjugation method from the same BSA. One micromolar palmitic acid (Sigma, cat. no. P0500) was heated in 150 mM NaCl at 70° for 60 m. This solution was then added to 37° of matched volume of BSA (20 μM) in 150 mM NaCl. This final solution was maintained stirring at 37° until it was fully dissolved (typically ∼2–3 h). This stock solution was added to treatment media at the indicated doses. No FBS was used in media assessing response to either glucose or palmitic acid.
siRNA knockdown.
Rat siRNA targets were purchased from Integrated DNA Technologies and ARE listed in Table 1. All experiments using Trp53inp2 gene knockdown were repeated and confirmed with a different siRNA to verify that the observed effects were not due to off-targeting. For transfection, media were changed to DMEM containing 10% FBS and 1 mmol/l sodium pyruvate and transfected using Lipofectamine 2000 according to manufacturer’s protocol.
Table 1.
Primers used in study
| Purpose | Gene Name | Forward Sequence 5′-3′ | Reverse Sequence 5′-3′ |
|---|---|---|---|
| qPCR | NppA | TTCGGTACCGGAAGCTGTTG | CTGGACTGGGGAAGTCAACC |
| qPCR | NppB | GTGCTGCCCCAGATGATTCT | GGCGCTGTCTTGAGACCTAA |
| qPCR | Pln | ACAGAAGCCAAGGCCTCCTA | TCCTGATAGCCGAGCGAGTA |
| qPCR | Cpt1a | GGGCTTGGTAGTCAAAGGCT | GGCTGCCTGTGTCAGTATGT |
| qPCR | HK2 | CTGGTGAGCCATCGTGGTTA | GGGGTCGAGTAGAGAAACCG |
| qPCR | Ppp2r4 | CACCTGGAGCCCAGACATTT | GTTCCACAGCTGGTTGGAGT |
| qPCR | Tp53inp2 | GCTAAAGTGTTGCAACGGCA | GCTAAAGTGTTGCAACGGCA |
| qPCR | Fkbp3 | AAGGAGAAAAGGCTCGACTGG | TTGGTGGAATTTTGGCGTCC |
| qPCR | Tmem50 | TGGATAACTTCCGATGGCCG | AGATTCCTGCAACCACGGAG |
| qPCR | CDC42 | CTTCTTCCGGGCCAATAGCA | CCTCCAATAGTCGGGAGGGA |
| IDT Catalog No. | |||
| RNAi KD | Trp53inp2 | RNAI.N178111.12.9 | |
| RNAi KD | Trp53inp2 | RNC.RNAI.X001063973.12.1 | |
qPCR, quantitative PCR; RNAi, RNA interference; KD, knockdown.
Ligation injury model.
Myocardial injury was performed as described previously (66). Injury was induced by 30-min ligation of the left anterior descending (LAD) coronary artery, followed by reperfusion. Sham injury was performed in the same manner, with a ligature passed under the LAD, but the LAD was not ligated.
RNA extraction and reverse transcription.
Cells or tissues were homogenized in Qiazol (Qiagen), and RNA extraction was carried out using the manufacturer’s protocol. RNA samples were reverse transcribed using a High-Capacity cDNA reverse transcription kit (Applied Biosystems) with random primers.
Immunoblot procedure and analysis.
Cells and tissues were lysed in whole cell extraction buffer containing 62.5 mM Tris·HCl (pH 6.8), 2% (wt/vol) sodium dodecyl sulfate, and 10% glycerol. Samples were then sonicated and diluted 1:5 in water, and protein content was measured using a BCA protein assay kit (Pierce). Total protein concentration was normalized to 3 μg/μl, and samples were then denatured in 4× LDS loading buffer (Life Technologies) with 10× reducing agent (Life Technologies) at 95°C for 5 min. Samples were then loaded at 10 μl/well into 4–12% Bis-Tris gels (Invitrogen) and separated out at 130 V for 2 h. Protein was then transferred to PVDF membranes (Immobilon) for 1.5 h at 35 V. Following transfer, membranes were washed with TBST and then blocked in 5% skim milk (Gibco) in TBST for 1 h at room temperature. Membranes were then placed in primary antibodies (1:2,000) on a shaker overnight at 4°C. Primary antibodies were used as follows: CPT-1a (Abcam, no. ab128568, 1:1,000), Hk2 (Sigma, no. SAB2108077, 1:2,000), PFK (Millipore, no. MABS151, 1:1,000), NppA (Sigma, no. SAB2700065, 1:1,000), NppB (Thermo, no. PA1-28352, 1:1,000), and Pln (Abcam, no. ab86930, 1:1,000). The following day, membranes were washed 3× in TBST and then placed in secondary antibodies (1:2,000) for 1 h at room temperature. Blots were then washed three times in TBST and placed Amersham ECL detection solution (GE Health Sciences). Blots were imaged using Imager, and bands were quantified using ImageJ Software.
Quantitative PCR.
Quantitative PCR was carried out using a Kappa SYBR Fast quantitative (q)PCR kit as recommended by the manufacturer. Samples were ran on a LightCycler 480 II (Roche) and analyzed using Roche LightCycler 1.5.0 Software. All qPCR targets were normalized to B2M expression and quantified using the ΔCT method. All qPCR primer sequences were designed using Primer-BLAST (70) and listed in Table 1.
Cell size assessment.
Protocol for changes in cell size was adapted from a previous publication (41). Briefly, cardiomyocytes were treated as indicated and then washed in PBS (3 times), fixed using 4% PFA, and imaged under phase contrast at ×20 magnification. ImageJ software was used for cell area quantification, where individual cells were outlined within 200-µm grids and area was quantified. Ten cells per grid were chosen at random and averaged to be n = 1. Throughout the area quantification process the viewer remained blinded to the treatment conditions.
Glucose uptake assay.
Glucose uptake was performed using 2-NBDG, a fluorescent analog of glucose (Cayman Chemicals, no. 600470) and adapted from previous studies (4, 46). Briefly, cells were treated as indicated and then placed in glucose-free DMEM (containing antibiotic and FBS) for 60 min. Media containing 2-NBDG (150 μg/ml) were then added and incubated for 20 min. Cells were then washed in ice-cold PBS (3 times), and fluorescence was quantified at excitation/emission of 485/535 nm using a fluorescent plate reader. Final quantification was normalized to protein content using a BCA assay.
Glycogen content measurement.
An assay for quantification of cardiomyocyte glycogen content was adapted from a previous study (18, 40). Briefly, cardiomyocytes were scraped in PBS and pelleted cells lysed (50 mM Tris·HCl, 2% SDS, and 5% glycerol). Glycogen was then precipitated in isopropanol (−20°C for 30 min) and transferred through a fine Whatman filter. Glycogen was digested with amyloglucosidase (Sigma) at 50°C for 20 min with 0.1 M sodium acetate buffer (pH 6.0), and then glucose levels were quantified using an Amplex Red (Thermo, no. A12217) glucose oxidase assay. Glucose concentration was normalized to total protein content using a BCA assay.
Statistical analysis.
Direct comparisons for experiments were performed using two-tailed Student’s t-tests. For multiple-comparison testing, a two-way ANOVA with a Tukey post hoc examination was used. Midweight bicorrelation coefficients and corresponding Student’s P values were calculated using the R package WGCNA (33, 34). All statistical analyses were performed using R statistical software. Values were considered significant at P < 0.05.
All data are presented as means ± SE.
RESULTS
Screening the HMDP for substrate-specific cardiomyocyte candidates.
Given the importance of glucose utilization to heart function and pathophysiology, we initially sought to uncover genes whose expression profile appeared to be specific for the substrate. Therefore, we interrogated >100 different mouse strains on a standard chow diet within the HMDP for candidate heart transcripts that showed a strong positive correlation with serum glucose and simultaneous negative correlation with circulating lipids (Fig. 1). To accomplish this, we generated lists of the top 50 genes ranked by midweight bicorrelation coefficient, which showed the strongest positive correlation with serum glucose (Table 2). We next utilized the same approach to find the 50 genes that showed the strongest negative correlation with circulating free fatty acids (Table 3) and triglycerides (Table 4). By overlaying these three tables, we found nine candidates whose expression showed a glucose-specific trend.
Fig. 1.
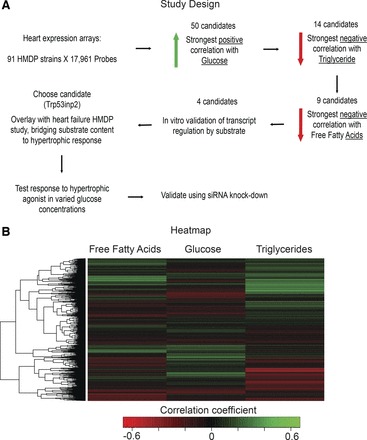
Framework for identification of glucose utilization-regulated transcripts. A: process of identification of Trp52inp2 as a transcript regulated by glucose utilization specifically. B: heat map for all 17,961 heart probes in 91 strains showing the correlation coefficient against circulating free fatty acids, glucose, and triglycerides. HMDP, Hybrid Mouse Diversity Panel.
Table 2.
Top 50 heart genes based on a positive correlation with circulating glucose content
| Rank | Official Gene Symbol | Gene Name | Bicor | P Value |
|---|---|---|---|---|
| 1 | Nacc2 | Nucleus accumbens associated 2, BEN and BTB (POZ) domain containing | 0.490383557 | 2.97E-07 |
| 2 | Egf | Epidermal growth factor | 0.482916524 | 4.75E-07 |
| 3 | Vegfa | Vascular endothelial growth factor A | 0.418205933 | 1.83E-05 |
| 4 | Nucks1 | Nuclear casein kinase and cyclin-dependent kinase substrate 1 | 0.411544117 | 2.55E-05 |
| 5 | Otp | Orthopedia homolog (Drosophila) | 0.408045769 | 3.04E-05 |
| 6 | 5430417L22Rik | RIKEN cDNA 5430417L22 gene | 0.405116879 | 3.51E-05 |
| 7 | Casq2 | Calsequestrin 2 | 0.395474654 | 5.57E-05 |
| 8 | Myl2 | Myosin, light polypeptide 2, regulatory, cardiac, slow | 0.384450139 | 9.29E-05 |
| 9 | Entpd5 | Ectonucleoside triphosphate diphosphohydrolase 5 | 0.381081827 | 0.000108276 |
| 10 | Ncoa1 | Nuclear receptor coactivator 1 | 0.380876393 | 0.000109284 |
| 11 | Asb10 | Ankyrin repeat and SOCS box-containing 10 | 0.37429389 | 0.0001466 |
| 12 | G0 s2 | G0/G1 switch gene 2 | 0.372181962 | 0.000160876 |
| 13 | Plekhh3 | Pleckstrin homology domain containing, family H (with MyTH4 domain) member 3 | 0.370185115 | 0.000175549 |
| 14 | Tmx2 | Thioredoxin-related transmembrane protein 2 | 0.369324562 | 0.000182247 |
| 15 | Zadh2 | Zinc binding alcohol dehydrogenase, domain containing 2 | 0.367465248 | 0.000197532 |
| 16 | Tmem50b | Transmembrane protein 50B | 0.366237221 | 0.000208268 |
| 17 | Pptc7 | PTC7 protein phosphatase homolog (S. cerevisiae) | 0.360273107 | 0.00026851 |
| 18 | Qk | Quaking | 0.359694052 | 0.000275143 |
| 19 | Qk | Quaking | 0.359694052 | 0.000275143 |
| 20 | Wnt5a | Wingless-related MMTV integration site 5A | 0.356715059 | 0.000311723 |
| 21 | Blcap | Bladder cancer associated protein homolog (human) | 0.35553515 | 0.000327411 |
| 22 | Lmo7 | LIM domain only 7 | 0.354375176 | 0.000343541 |
| 23 | Ddit3 | DNA damage-inducible transcript 3 | 0.353109961 | 0.000361966 |
| 24 | Ak4 | Adenylate kinase 4 | 0.351669631 | 0.000384045 |
| 25 | Hspa5 | Heat shock protein 5 | 0.350778974 | 0.000398311 |
| 26 | Cdc42ep3 | CDC42 effector protein (Rho GTPase binding) 3 | 0.348941575 | 0.000429294 |
| 27 | Srpk2 | Serine/arginine-rich protein specific kinase 2 | 0.348319738 | 0.000440271 |
| 28 | Map2k7 | Mitogen-activated protein kinase kinase 7 | 0.344254353 | 0.000518628 |
| 29 | Pkia | Protein kinase inhibitor-α | 0.344243453 | 0.000518854 |
| 30 | Zfp189 | Zinc finger protein 189 | 0.343665988 | 0.000530973 |
| 31 | Ppp2r4 | Protein phosphatase 2A, regulatory subunit B (PR 53) | 0.343125682 | 0.000542546 |
| 32 | Entpd5 | Ectonucleoside triphosphate diphosphohydrolase 5 | 0.341273164 | 0.000584004 |
| 33 | Qrsl1 | Glutaminyl-tRNA synthase (glutamine-hydrolyzing)-like 1 | 0.341194541 | 0.000585826 |
| 34 | Arpc5l | Actin-related protein 2/3 complex, subunit 5-like | 0.33932258 | 0.000630778 |
| 35 | Qk | Quaking | 0.338846188 | 0.000642711 |
| 36 | Qk | Quaking | 0.338846188 | 0.000642711 |
| 37 | Fkbp3 | FK506-binding protein 3 | 0.337800221 | 0.000669639 |
| 38 | Fign | Fidgetin | 0.337742472 | 0.000671156 |
| 39 | BC004004 | cDNA sequence BC004004 | 0.337246273 | 0.000684315 |
| 40 | Nr2f6 | Nuclear receptor subfamily 2, group F, member 6 | 0.336333241 | 0.000709148 |
| 41 | Rmi1 | RMI1, RecQ mediated genome instability 1, homolog (S. cerevisiae) | 0.336138896 | 0.000714539 |
| 42 | Trp53inp2 | Transformation-related protein 53 inducible nuclear protein 2 | 0.335826938 | 0.000723271 |
| 43 | Stk40 | Serine/threonine kinase 40 | 0.335574355 | 0.000730412 |
| 44 | Lpgat1 | Lysophosphatidylglycerol acyltransferase 1 | 0.335512338 | 0.000732175 |
| 45 | Hlf | Hepatic leukemia factor | 0.335321418 | 0.000737628 |
| 46 | Dnajc5 | DnaJ (Hsp40) homolog, subfamily C, member 5 | 0.3346496 | 0.000757111 |
| 47 | Lrpprc | Leucine-rich PPR motif containing | 0.332791084 | 0.000813486 |
| 48 | Prss22 | Protease, serine, 22 | 0.331855673 | 0.000843287 |
| 49 | Cd200 | CD200 antigen | 0.331162206 | 0.000866019 |
| 50 | Ntmt1 | NH2-terminal Xaa-Pro-Lys N-methyltransferase 1 | 0.327215621 | 0.001006383 |
PPR, pentatricopeptide repeat; Hsp40, heat shock protein. Each gene is ranked according to its bicorrelation coefficient (bicor), indicating association with plasma glucose concentration.
Table 3.
Top 50 heart genes based on a negative correlation with circulating free fatty acid content
| Rank | Official Gene Symbol | Gene Name | Bicor | P Value |
|---|---|---|---|---|
| 1 | Atp6v1d | ATPase, H+ transporting, lysosomal V1 subunit D | −0.593782611 | 9.30E-11 |
| 2 | Cab39 | Calcium-binding protein 39 | −0.592137037 | 1.08E-10 |
| 3 | Zfp91 | Zinc finger protein 91 | −0.58966737 | 1.35E-10 |
| 4 | Eif4 g1 | Eukaryotic translation initiation factor 4, γ1 | −0.577564204 | 3.88E-10 |
| 5 | Hk2 | Hexokinase 2 | −0.577313289 | 3.97E-10 |
| 6 | Mfhas1 | Malignant fibrous histiocytoma amplified sequence 1 | −0.574902221 | 4.87E-10 |
| 7 | Tns1 | Tensin 1 | −0.573461848 | 5.51E-10 |
| 8 | Fblim1 | Filamin-binding LIM protein 1 | −0.573266815 | 5.60E-10 |
| 9 | Mfn2 | Mitofusin 2 | −0.559330348 | 1.77E-09 |
| 10 | Mtor | Mechanistic target of rapamycin (serine/threonine kinase) | −0.552770796 | 2.98E-09 |
| 11 | Usp2 | Ubiquitin-specific peptidase 2 | −0.551174168 | 3.38E-09 |
| 12 | Cdc42ep3 | CDC42 effector protein (Rho GTPase binding) 3 | −0.543536099 | 6.12E-09 |
| 13 | Rhot1 | Ras homolog gene family, member T1 | −0.538939805 | 8.67E-09 |
| 14 | Ptpn11 | Protein tyrosine phosphatase, nonreceptor type 11 | −0.535634191 | 1.11E-08 |
| 15 | Trp53inp2 | Transformation related protein 53 inducible nuclear protein 2 | −0.534435546 | 1.22E-08 |
| 16 | Tef | Thyrotroph embryonic factor | −0.53033971 | 1.64E-08 |
| 17 | Pcyt2 | Phosphate cytidylyltransferase 2, ethanolamine | −0.528288774 | 1.91E-08 |
| 18 | Sfxn2 | Sideroflexin 2 | −0.52455139 | 2.50E-08 |
| 19 | Tns1 | Tensin 1 | −0.524465831 | 2.52E-08 |
| 20 | Klf9 | Kruppel-like factor 9 | −0.524427522 | 2.53E-08 |
| 21 | Ppara | Peroxisome proliferator-activated receptor-α | −0.523916009 | 2.62E-08 |
| 22 | 2610507B11Rik | RIKEN cDNA 2610507B11 gene | −0.521121779 | 3.20E-08 |
| 23 | Rap2c | RAP2C, member of RAS oncogene family | −0.520209896 | 3.42E-08 |
| 24 | Eprs | Glutamyl-prolyl-tRNA synthetase | −0.519853815 | 3.50E-08 |
| 25 | Dlst | Dihydrolipoamide S-succinyltransferase (E2 component of 2-oxo-glutarate complex) | −0.519343207 | 3.63E-08 |
| 26 | Zfp386 | Zinc finger protein 386 (Kruppel-like) | −0.519214835 | 3.66E-08 |
| 27 | Prodh | Proline dehydrogenase | −0.518975463 | 3.73E-08 |
| 28 | Tnrc6c | Trinucleotide repeat containing 6C | −0.511831265 | 6.14E-08 |
| 29 | Smpd1 | Sphingomyelin phosphodiesterase 1, acid lysosomal | −0.511521796 | 6.27E-08 |
| 30 | Slc25a46 | Solute carrier family 25, member 46 | −0.509985805 | 6.97E-08 |
| 31 | Actr1a | ARP1 actin-related protein 1A, centractin-α | −0.503987605 | 1.05E-07 |
| 32 | Atf6 | Activating transcription factor 6 | −0.500220923 | 1.35E-07 |
| 33 | Wwp1 | WW domain containing E3 ubiquitin protein ligase 1 | −0.497693064 | 1.60E-07 |
| 34 | St3 gal3 | ST3 β-galactoside-α-2,3-sialyltransferase 3 | −0.496358938 | 1.74E-07 |
| 35 | Tex2 | Testis-expressed gene 2 | −0.493464298 | 2.11E-07 |
| 36 | Ulk1 | Unc-51 like kinase 1 | −0.486599111 | 3.28E-07 |
| 37 | Larp1b | La ribonucleoprotein domain family, member 1B | −0.484417399 | 3.77E-07 |
| 38 | Ppp2r4 | Protein phosphatase 2A, regulatory subunit B (PR 53) | −0.484417399 | 3.77E-07 |
| 39 | Arih2 | Ariadne homolog 2 (Drosophila) | −0.483999724 | 3.87E-07 |
| 40 | Npr2 | Natriuretic peptide receptor 2 | −0.483685886 | 3.94E-07 |
| 41 | Adck3 | aarF domain containing kinase 3 | −0.483157818 | 4.08E-07 |
| 42 | Fkbp3 | FK506 binding protein 3 | −0.481964572 | 4.40E-07 |
| 43 | Eif5b | Eukaryotic translation initiation factor 5B | −0.479686518 | 5.07E-07 |
| 44 | Miip | Migration and invasion inhibitory protein | −0.479572099 | 5.11E-07 |
| 45 | Atp1b1 | ATPase, Na+/K+ transporting, β1 polypeptide | −0.477306852 | 5.88E-07 |
| 46 | Snx19 | Sorting nexin 19 | −0.477283318 | 5.89E-07 |
| 47 | Lace1 | Lactation elevated 1 | −0.474279037 | 7.08E-07 |
| 48 | Tmem50b | Transmembrane protein 50B | −0.468957204 | 9.79E-07 |
| 49 | Abcb1a | ATP-binding cassette, sub-family B (MDR/TAP), member 1A | −0.468823358 | 9.87E-07 |
| 50 | Ldb3 | LIM domain binding 3 | −0.466830561 | 1.11E-06 |
Each gene is ranked by its bicorrelation coefficient (bicor) in accordance with a negative association with plasma free fatty acid levels.
Table 4.
Top 50 heart genes based on a negative correlation with circulating triglyceride content
| Rank | Official Gene Symbol | Gene Name | Bicor | P Value |
|---|---|---|---|---|
| 1 | Abcb4 | ATP-binding cassette, sub-family B (MDR/TAP), member 4 | −0.407269153 | 2.87E-05 |
| 2 | Hcn3 | Hyperpolarization-activated, cyclic nucleotide-gated K+ 3 | −0.398840978 | 4.33E-05 |
| 3 | Rora | RAR-related orphan receptor α | −0.387257884 | 7.50E-05 |
| 4 | 2810474O19Rik | RIKEN cDNA 2810474O19 gene | −0.378802533 | 0.000110505 |
| 5 | Aars | Alanyl-tRNA synthetase | −0.376498525 | 0.0001226 |
| 6 | Smc6 | Structural maintenance of chromosomes 6 | −0.374888834 | 0.000131766 |
| 7 | Tead4 | TEA domain family member 4 | −0.372152569 | 0.00014882 |
| 8 | Tsx | Testis specific X-linked gene | −0.371524144 | 0.000153015 |
| 9 | Psmd1 | Proteasome (prosome, macropain) 26S subunit, nonATPase, 1 | −0.371447136 | 0.000153536 |
| 10 | Ivns1abp | Influenza virus NS1A binding protein | −0.362263528 | 0.00022899 |
| 11 | Clip4 | CAP-GLY domain containing linker protein family, member 4 | −0.355186613 | 0.000309096 |
| 12 | Psmd11 | Proteasome (prosome, macropain) 26S subunit, nonATPase, 11 | −0.355011846 | 0.000311367 |
| 13 | Eif3a | Eukaryotic translation initiation factor 3, subunit A | −0.354876416 | 0.000313137 |
| 14 | Dlg1 | Disks, large homolog 1 (Drosophila) | −0.351521087 | 0.000360073 |
| 15 | 0610007P14Rik | RIKEN cDNA 0610007P14 gene | −0.348480882 | 0.000408107 |
| 16 | Taf7 | TAF7 RNA polymerase II, TATA box binding protein-associated factor | −0.347157013 | 0.00043081 |
| 17 | Gfra2 | Glial cell line-derived neurotrophic factor family receptor-α2 | −0.344333628 | 0.000483154 |
| 18 | Bcas2 | Breast carcinoma amplified sequence 2 | −0.344097618 | 0.000487784 |
| 19 | Gpr33 | G protein-coupled receptor 33 | −0.340880536 | 0.000555089 |
| 20 | Ptpn11 | Protein tyrosine phosphatase, nonreceptor type 11 | −0.337317888 | 0.000639487 |
| 21 | 2810474O19Rik | RIKEN cDNA 2810474O19 gene | −0.336483195 | 0.000660888 |
| 22 | Plaa | Phospholipase A2, activating protein | −0.335971499 | 0.00067433 |
| 23 | Rab22a | RAB22A, member RAS oncogene family | −0.332621632 | 0.000768691 |
| 24 | Atp6v1d | ATPase, H+ transporting, lysosomal V1 subunit D | −0.331401767 | 0.000805947 |
| 25 | Rnf128 | Ring finger protein 128 | −0.329810835 | 0.000857015 |
| 26 | Purb | Purine-rich element-binding protein B | −0.328868333 | 0.000888644 |
| 27 | Atp2a2 | ATPase, Ca2+ transporting, cardiac muscle, slow twitch 2 | −0.327368537 | 0.000941177 |
| 28 | Fkbp3 | FK506-binding protein 3 | −0.325453031 | 0.001012387 |
| 29 | Msrb1 | Methionine sulfoxide reductase B1 | −0.325257037 | 0.001019943 |
| 30 | Pcdh7 | Protocadherin 7 | −0.325051136 | 0.001027936 |
| 31 | Trp53inp2 | Transformation-related protein 53-inducible nuclear protein 2 | −0.324517019 | 0.001048939 |
| 32 | Tyrp1 | Tyrosinase-related protein 1 | −0.323887916 | 0.001074177 |
| 33 | Smc6 | Structural maintenance of chromosomes 6 | −0.323587042 | 0.001086442 |
| 34 | Rnf17 | Ring finger protein 17 | −0.320780284 | 0.001207151 |
| 35 | Coq10a | Coenzyme Q10 homolog A (yeast) | −0.318734678 | 0.001302674 |
| 36 | Scaf8 | SR-related CTD-associated factor 8 | −0.316342221 | 0.001423073 |
| 37 | Nr5a2 | Nuclear receptor subfamily 5, group A, member 2 | −0.315837808 | 0.001449712 |
| 38 | Ppp6r2 | Protein phosphatase 6, regulatory subunit 2 | −0.315501037 | 0.001467748 |
| 39 | Repin1 | Replication initiator 1 | −0.314412678 | 0.001527438 |
| 40 | Eif5b | Eukaryotic translation initiation factor 5B | −0.314373283 | 0.001529639 |
| 41 | Car6 | Carbonic anhydrase 6 | −0.313423868 | 0.001583566 |
| 42 | Eif2ak1 | Eukaryotic translation initiation factor-2α kinase 1 | −0.309695244 | 0.00181243 |
| 43 | Lgalsl | Lectin, galactoside binding-like | −0.308168306 | 0.001914493 |
| 44 | Cdc42ep3 | CDC42 effector protein (Rho GTPase binding) 3 | −0.308001702 | 0.001925938 |
| 45 | Cacna1c | Calcium channel, voltage-dependent, L type, α1C subunit | −0.307302331 | 0.001974659 |
| 46 | Ppp2r4 | Protein phosphatase 2A, regulatory subunit B (PR 53) | −0.305444878 | 0.002109508 |
| 47 | Kcmf1 | Potassium channel modulatory factor 1 | −0.305171733 | 0.002130024 |
| 48 | Klf9 | Kruppel-like factor 9 | −0.304918101 | 0.002149236 |
| 49 | Gbx2 | Gastrulation brain homeobox 2 | −0.304857642 | 0.002153838 |
| 50 | Tmem50b | Transmembrane protein 50B | −0.303155912 | 0.002287091 |
Each gene is ranked according to its bicorrelation coefficient (bicor), indicating association with plasma triglyceride concentration.
Validation of genes regulated by glucose and palmitic acid.
To validate glucose-mediated induction and saturated fatty acid inhibition of these candidates, we adopted an in vitro model of neonatal rat cardiomyocytes (48). Cardiomyocytes were treated with a varied physiological range of glucose in the media, and qPCR was probed for expression of the nine candidate genes (Fig. 2, A–E). Of these candidates, Cdc42, Tmem50, Fkbp3, Ppp2r4, and Trp53inp2 all showed a consistent trend of being induced by increasing amounts of exogenous glucose. To further validate the method of identification, we next tested whether expression of the same genes could be suppressed by treatment of palmitate. Of these, Cdc42, Tmem50, Fkbp3, and Trp53inp2 were all reduced in the context of palmitic acid treatment, whereas we did not observe Ppp2r4 being suppressed in these conditions (Fig. 2, F–I). These data show that four out of the nine potential candidates directly elicited changes in mRNA abundance in response to glucose and palmitic acid.
Fig. 2.
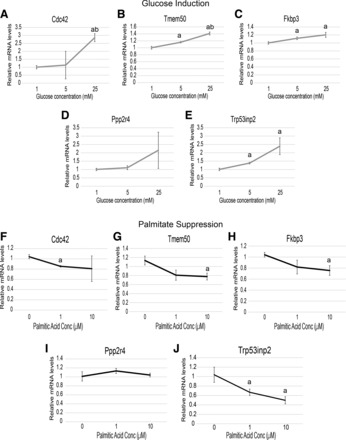
Validation of candidate genes being regulated by substrate utilization. A–E: rat neonatal cardiomyocytes were treated for 16 h in basal media supplemented with the indicated amounts of glucose and probed for expression of Cdc42 (A), Tmem50 (B), Fkbp3 (C), Ppp2r4 (D), or Trp53inp2 (E). F–J: the same experimental design, except that media were supplemented with various amounts of palmitic acid conjugated to BSA; n = 6/group. All samples were normalized to B2M expression and expressed as means ± SE. aP < 0.05; abP < 0.001.
Trp53inp2 inhibition reduces abundance of key glycolytic machinery.
After verifying expression changes from these candidates as a result of substrate content, we next wanted to identify and experimentally validate a candidate gene that exerts control over cardiomyocyte glycolytic machinery. We chose to focus on the gene Trp53inp2, given that it showed strong positive correlation with major regulators of glucose metabolism genes (Table 5). In light of these correlations, we tested whether reduction of Trp53inp2 expression could directly impact the mRNA levels of key glycolytic enzymes. Rat cardiomyocytes were transfected with either a scrambled control or siRNA targeting Trp53inp2 gene, where we observed an ~50% reduction in Trp53inp2 expression (Fig. 3A). Trp53inp2 gene reduction also led to a significant decrease in Cdc42 but not other genes identified in our screen, indicating that Trp53inp2 might directly regulate Cdc42 expression (data not shown). In this model of Trp53inp2 reduction, expression of key glycolytic genes hexokinase 2 (Fig. 3B) and phosphofructokinase (Fig. 3C) were significantly suppressed. This reduction in two key glycolytic enzymes was accompanied by an increase in the fatty acid oxidation enzym3, carnitine palmitoyltransferase 1a (CPT1a; Fig. 3D). Changes in metabolic enzyme gene expression were also verified at the level of protein abundance (Fig. 3, E–G). We also observed a significant reduction in mRNA levels of enolase and increased 3-hydroxyacyl-CoA dehydrogenase; however these changes could not be recapitulated at the protein level (data not shown). Collectively, these observations show that reduction in Trp53inp2 effectively suppresses two key glycolytic enzymes while enhancing CPT1a for fatty acid oxidation.
Table 5.
Metabolic genes which correlate with Trp53inp2 expression in the HMDP
| Gene Symbol | Gene Name | Bicor | P value |
|---|---|---|---|
| Hk2 | Hexokinase 2 | 0.69829 | 2.61E-15 |
| Pfk | Phosphofructokinase | 0.52136 | 5.14E-08 |
| Pkm | Pyruvate kinase, muscle | 0.4978 | 2.47E-07 |
| Hk1 | Hexokinase 1 | 0.39447 | 6.98E-05 |
| Ldhb | Lactate dehydrogenase B | 0.38603 | 0.000103 |
Each gene listed showed significant positive correlation with Trp53inp2 expression in the heart.
Fig. 3.
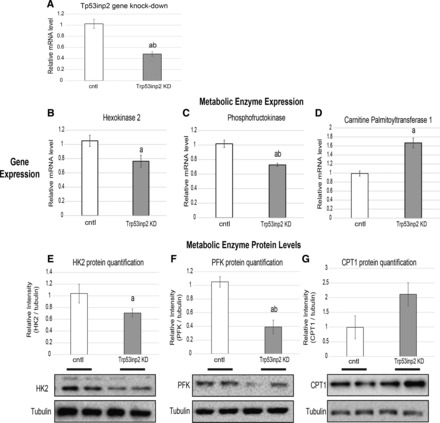
Trp53inp2 reduction suppresses expression of key glycolytic enzymes. Neonatal rat cardiomyocytes were transfected with either scrambled siRNA vector or siRNA targeting Trp52inp2. After 24 h, the cells were harvested and assessed for the mRNA expression of Trp53inp2 (A), hexokinase 2 (HK2; B), phosphofructokinase (PFK; C), and carnitine palmitoyltransferase (CPT1; D); n = 6/group. All samples were normalized to B2M expression and expressed as means ± SE. All gene expression quantifications of metabolic enzymes are accompanied by Western blots and corresponding quantification (E–G) of the same targets normalized to tubulin (n = 5). aP < 0.05; abP < 0.001 comparisons done between Iso and control groups at matched glucose contents. All samples are expressed as means ± SE.
Trp53inp2 gene expression shows significant associations with clinical traits in a model of isoproterenol-induced hypertrophy.
We next asked whether the capacity of Trp53inp2 to regulate glycolytic-specific genes could play a role in the well-established link between glucose utilization and heart failure. In a separate cohort, we performed an HMDP study, where >100 strains were administered isoproterenol-loaded osmotic pumps for 3 wk to model the pathophysiology of heart failure (51, 52, 69). Here, we observed dramatic and robust responses to isoproterenol, which mirrored hypertrophy, substantial remodeling, and other relevant perturbations commonly observed in human heart failure (8, 21). Variation in response to the treatment is shown on an individual strain basis, where a broad range in responses was observed in left ventricle mass (Fig. 4A) and fractional shortening (Fig. 4B). Consistent with the notion that natural genetic variation was driving differences in response to isoproterenol infusion, a dynamic range of expression responses of Trp53inp2 was also observed (Fig. 4C). Therefore, we investigated expression of the Trp53inp2 in this study and found significant positive associations between the gene abundance and many clinically relevant traits, including the mitral inflow E-to-A velocity ratio, left ventricular mass, and other left ventricular measurements (Fig. 4D). We also observed significant negative associations between Trp53inp2 and with fractional shortening and right ventricle mass (Fig. 4D). These correlations suggest Trp53inp2 as important player in hypertrophic response. We also wanted to see whether the regulation of Trp53inp2 expression was consistent across other models of heart failure. Therefore, we measured gene expression in response to left anterior descending carotid artery ligation. It is interesting to note that in this model we observed opposite modes of regulation; Trp53inp2 expression was suppressed in the infarct area relative to uninjured areas (Fig. 4E). This might be due to the differences in injury models or indicate that Trp53inp2 gene is a direct target of β-adrenergic signaling (as opposed to tissue injury), but additional studies will be required to address this.
Fig. 4.
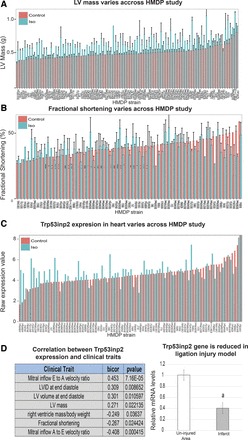
Trp53inp2 gene is regulated by cardiac injury. A–C: Hybrid Mouse Diversity Panel (HMDP) assessing response to isoproterenol (Iso) infusion showed substantial variation among inbred strains (x-axis) in hypertrophic traits of left ventricle (LV) mass (A), fractional shortening (B), and Trp53inp2 gene expression (C). D: as a consequence of variation, Trp53inp2 showed striking correlations with relevant clinical traits (left). Quantitative PCR measurement of Trp53inp2 gene expression in model of carotid artery ligation comparing infarct vs. uninjured areas is shown; n = 4/group (right). All samples were normalized to B2M expression and expressed as means ± SE. aP < 0.05.
Trp53inp2 knockdown alters glucose utilization in the presence of isoproterenol.
We next tested whether isoproterenol treatment could directly alter Trp53inp2 gene expression and whether this response was dependent on glucose content. Therefore, rat cardiomyocytes were treated with control (PBS) or 60 μM isoproterenol in varied concentrations of glucose (Fig. 5A). Not only was isoproterenol sufficient to induce expression of Trp53inp2, but this induction was greatly enhanced upon glucose content in the media being increased. Since expression of Trp53inp2 was regulated by both glucose and isoproterenol, we hypothesized that this gene sits at a bridging node between cardiomyocyte responses and the se conditions. Therefore, we measured glucose uptake and glycogen levels in both basal and isoproterenol-stimulated conditions. In both instances, Trp53inp2 knockdown (KD) did not alter basal regulation of glucose. However, when stimulated with isoproterenol, a significant reduction in both glucose uptake (Fig. 5B) and glycogen deposition (Fig. 5C) was observed. These data show that Trp53inp2 KD is sufficient to alter glucose regulation in the context of hypertrophic stimulation.
Fig. 5.
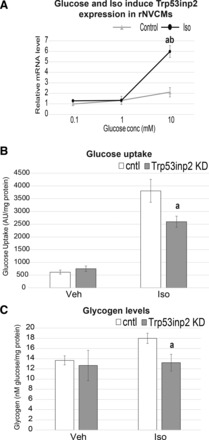
Trp53inp2 regulates isoproterenol (Iso)-induced glucose utilization. A: rat cardiomyocytes were treated with control (PBS) or 60 µM Iso in indicated concentrations of glucose and qPCR evaluated for Trp53inp2 expression. Samples were normalized to B2M. B and C: cardiomyocytes containing Trp53inp2 or control (cntrl) siRNA were evaluated for glucose uptake (B) and glycogen content (C) in both basal and Iso treatment (60 µM). Values were normalized to protein content; n = 10/group. All samples expressed as means ± SE. aP < 0.05; abP < 0.001. Veh, vehicle; KD, knockdown; AU, arbitrary units.
Reduction of Trp53inp2 blunts the ability of glucose and isoproterenol to synergistically induce hypertrophy.
We next tested the hypothesis that Trp53inp2 sits at a node integrating both glucose content and cardiomyocyte hypertrophic response. In light of this hypothesis, we tested whether reducing Trp53inp2 expression and suppressing glycolytic machinery could also blunt hypertrophic responses in a glucose-dependent fashion. Here, we used the expression of well-described cardiac genes natriuretic peptide A (NppA), natriuretic peptide B (NppB), and phospholamban (Pln) as a metric for hypertrophic responsiveness. Consistent with the literature (10, 20, 42, 56), increasing exogenous glucose content slightly but significantly enhanced NppA and NppB and reduced Pln gene expression (data not shown). To test whether Trp53inp2 was mediating these effects, we again utilized siRNA-mediated knockdown in rat cardiomyocytes. The approximate 50% reduction in Trp53inp2 expression modestly repressed the ability of isoproterenol to engage its target genes at lower glucose (5 mM) content; however, at elevated glucose levels (25 mM) this blunting became highly significant at the levels of both mRNA (Fig. 6, A–C) and protein (Fig. 6, D–G). We next wanted to assess the capacity of Trp53inp2 to regulate hypertrophy using a true functional outcome for the disease. Therefore, we repeated the same experiments and measured changes in cell size as a metric for hypertrophic response. Consistent with changes in mRNA and protein, we observed a capacity of Trp53inp2 reduction to hinder cell size expansion specifically at elevated glucose concentrations (Fig. 6, H and I). These data suggest that Trp53inp2 functions to bridge cardiomyocyte glucose utilization and hypertrophic response.
Fig. 6.
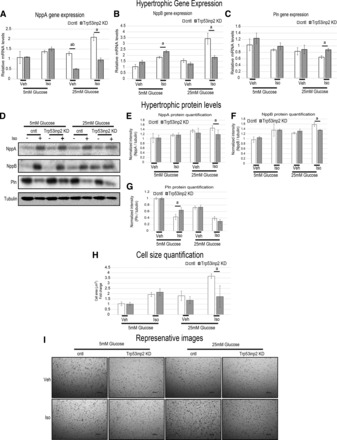
Reduction of Trp53inp2 blunts the synergistic hypertrophic action of glucose and isoproterenol (Iso). A–C: cells were transfected with scrambled control (open bars) or siRNA targeting Trp53inp2 (gray bars) and then treated with PBS or 60 μM Iso in either 5 or 25 mM glucose. Samples were then quantitative PCR-interrogated for expression of hypertrophic markers NppA (A), NppB (B), and phospholamban (Pln; C); n = 4. All samples were normalized to B2M. D–G: the same conditions as above, except brefeldin A was added to prevent secretion to immunoblot and quantify the same markers (n = 4). H and I: cells were subjected to the same conditions as above and then evaluated for changes in cell size, shown as quantification (H) and representative images (I); n = 15. All samples expressed as means ± SE. aP < 0.05; abP < 0.001.
DISCUSSION
The present studies identified Trp53inp2 based on the glucose utilization-specific pattern of expression. We further validated this trend in rat cardiomyocytes and explored the association and regulation induction by glucose and suppression by palmitic acid in rat cardiomyocytes. It is important to note that we tested only palmitic acid as a representative and highly abundant free fatty acid. This should not be considered when interpreting regulatory trends for other lipids that exert different effects (e.g., short-chain or polyunsaturated fatty acids). In addition, Trp53inp2 gene silencing effectively reduced the mRNA abundance of key glycolytic machinery. Given that enhanced glucose utilization, specifically glycolysis, has been associated with heart failure phenotypes, we next tested the hypothesis that inhibition of Trp53inp2 would blunt the capacity of glucose to enhance expression of hypertrophic genes. We observed that Trp53inp2 could effectively hinder the expression of hypertrophic genes, an effect that was markedly increased by elevated glucose concentrations. From this study, we conclude that the transcription factor Trp53inp2 serves as a regulator of cardiomyocyte glucose utilization and can offer insight into therapeutic targeting of heart metabolism, especially in the context of hyperglycemia. As mentioned above, Trp53inp2 belongs to a family of known transcription factors, therefore exerting these effects through transcriptional activation of tested genes. It should also be noted that specific targets of the factor are unknown, and the conserved function of the protein could be to regulate processes beyond metabolic machinery.
Large population-based studies have suggested an association between elevated blood glucose and heart failure, especially in the context of type 2 diabetes (7, 27, 30, 62, 64). Although hyperglycemia in itself is not believed to be causal in heart disease, it certainly appears to exacerbate the severity and mortality of heart failure (17, 28, 35). Given the high prevalence of type 2 diabetes and heart failure as a comorbidity, molecular mechanisms linking these two disease states are lacking.
Although the ratio of glycolytic activity compared with the extent of oxidation remains unclear in heart failure, the reduction in fatty acid uptake and β-oxidation has been quite consistent across models and species (12, 24, 38, 59, 67), extending to human tissue (53, 54). As a result, many investigative studies and therapeutic targets have focused on reversing cardiac substrate specificity in the context of the failing heart. This approach of enhancing fat oxidation while simultaneously inhibiting glucose utilization has shown promise under various models and studies in reversing long-term effects of cardiomyocyte dysfunction (29, 32, 60).
The aim of the study was to identify a bridging node between metabolic syndrome, specifically elevated plasma glucose and heart failure. Many questions follow the present study, including how glucose and palmitic acid impact expression of Trp53inp2. Altering exogenous levels of these two factors has been demonstrated to robustly impact cardiomyocyte physiology, especially in initiating apoptosis and subsequent myofiber degeneration (13, 16); however, the underlying pathways remain relatively unclear. Several cellular components have been linked to the capacity of elevated glucose to impair signaling in cardiomyocytes (9, 25, 65). In addition, palmitate has been shown to activate PKC signaling in cardiomyocytes (49); however, this mechanism has yet to be explored in the context of insulin resistance. These known pathways might offer insights to the regulation of Trp53inp2 expression.
We note that there are limitations with the neonatal cardiomyocyte system. One caveat of this generalized approach lies in the metabolic nature of rat neonatal cardiomyocytes. Although these cells have been used extensively to assess various aspects of heart function, their utilization of glucose and fatty acids is somewhat distinct from mature adult cardiomyocytes (5, 37). More generally, neonatal cardiomyocytes rely heavily on glycolysis and lactate oxidation for energy, a process that is reduced at the expense of enhanced fatty acid oxidation as the cells mature. These points should be considered when further interpreting cardiomyocyte metabolism as a surrogate for mature heart function. That being said, we feel this model is a reasonable system for screening due to the fact that gene identification, associations with plasma metabolites, and overlapping with clinical traits were all generated in fully formed adult mouse hearts.
GRANTS
This research was supported by the following National Institutes of Health grants: 1-DP-3-DO-94311 (A. J. Lusis), RO1-HL-114437 (Y. Wang and A. J. Lusis), RO1-HL-123295 (Y. Wang, A. J. Lusis), HL-028481 (A. J. Lusis), T32-HL-007895 (MMS), and T32-HL-69766 (M. M. Seldin).
DISCLOSURES
No conflicts of interest, financial or otherwise, are declared by the author(s).
AUTHOR CONTRIBUTIONS
M.M.S., E.D.K., S.L., and K.C.K. performed experiments; M.M.S. and E.D.K. analyzed data; M.M.S., E.D.K., M.C.R., J.J.W., A.D., and A.J.L. interpreted results of experiments; M.M.S. prepared figures; M.M.S., E.D.K., and A.J.L. drafted manuscript; M.M.S., E.D.K., M.C.R., S.L., C.D.R., J.J.W., K.C.K., Y.W., A.D., and A.J.L. approved final version of manuscript; S.L., C.D.R., J.J.W., K.C.K., Y.W., A.D., and A.J.L. edited and revised manuscript.
ACKNOWLEDGMENTS
We thank Jing Gao for help with rat cardiomyocyte isolation and preparation. We also thank Rosa Chen for help with the manuscript preparation.
REFERENCES
- 1.Allard MF, Schönekess BO, Henning SL, English DR, Lopaschuk GD. Contribution of oxidative metabolism and glycolysis to ATP production in hypertrophied hearts. Am J Physiol Heart Circ Physiol 267: H742–H750, 1994. [DOI] [PubMed] [Google Scholar]
- 2.Amorim PA, Nguyen TD, Shingu Y, Schwarzer M, Mohr FW, Schrepper A, Doenst T. Myocardial infarction in rats causes partial impairment in insulin response associated with reduced fatty acid oxidation and mitochondrial gene expression. J Thorac Cardiovasc Surg 140: 1160–1167, 2010. doi: 10.1016/j.jtcvs.2010.08.003. [DOI] [PubMed] [Google Scholar]
- 3.Balaban RS. Cardiac energy metabolism homeostasis: role of cytosolic calcium. J Mol Cell Cardiol 34: 1259–1271, 2002. doi: 10.1006/jmcc.2002.2082. [DOI] [PubMed] [Google Scholar]
- 4.Ball SW, Bailey JR, Stewart JM, Vogels CM, Westcott SA. A fluorescent compound for glucose uptake measurements in isolated rat cardiomyocytes. Can J Physiol Pharmacol 80: 205–209, 2002. doi: 10.1139/y02-043. [DOI] [PubMed] [Google Scholar]
- 5.Banerjee I, Fuseler JW, Price RL, Borg TK, Baudino TA. Determination of cell types and numbers during cardiac development in the neonatal and adult rat and mouse. Am J Physiol Heart Circ Physiol 293: H1883–H1891, 2007. doi: 10.1152/ajpheart.00514.2007. [DOI] [PubMed] [Google Scholar]
- 6.Baumgartner BG, Orpinell M, Duran J, Ribas V, Burghardt HE, Bach D, Villar AV, Paz JC, González M, Camps M, Oriola J, Rivera F, Palacín M, Zorzano A. Identification of a novel modulator of thyroid hormone receptor-mediated action. PLoS One 2: e1183, 2007. doi: 10.1371/journal.pone.0001183. [DOI] [PMC free article] [PubMed] [Google Scholar]
- 7.Bonora E, Muggeo M. Postprandial blood glucose as a risk factor for cardiovascular disease in Type II diabetes: the epidemiological evidence. Diabetologia 44: 2107–2114, 2001. doi: 10.1007/s001250100020. [DOI] [PubMed] [Google Scholar]
- 8.Brooks WW, Conrad CH. Isoproterenol-induced myocardial injury and diastolic dysfunction in mice: structural and functional correlates. Comp Med 59: 339–343, 2009. [PMC free article] [PubMed] [Google Scholar]
- 9.Cai L, Li W, Wang G, Guo L, Jiang Y, Kang YJ. Hyperglycemia-induced apoptosis in mouse myocardium: mitochondrial cytochrome C-mediated caspase-3 activation pathway. Diabetes 51: 1938–1948, 2002. doi: 10.2337/diabetes.51.6.1938. [DOI] [PubMed] [Google Scholar]
- 10.Chen S, Khan ZA, Karmazyn M, Chakrabarti S. Role of endothelin-1, sodium hydrogen exchanger-1 and mitogen activated protein kinase (MAPK) activation in glucose-induced cardiomyocyte hypertrophy. Diabetes Metab Res Rev 23: 356–367, 2007. doi: 10.1002/dmrr.689. [DOI] [PubMed] [Google Scholar]
- 11.Christe ME, Rodgers RL. Altered glucose and fatty acid oxidation in hearts of the spontaneously hypertensive rat. J Mol Cell Cardiol 26: 1371–1375, 1994. doi: 10.1006/jmcc.1994.1155. [DOI] [PubMed] [Google Scholar]
- 12.Cook GA, Edwards TL, Jansen MS, Bahouth SW, Wilcox HG, Park EA. Differential regulation of carnitine palmitoyltransferase-I gene isoforms (CPT-I alpha and CPT-I beta) in the rat heart. J Mol Cell Cardiol 33: 317–329, 2001. doi: 10.1006/jmcc.2000.1304. [DOI] [PubMed] [Google Scholar]
- 13.de Vries JE, Vork MM, Roemen TH, de Jong YF, Cleutjens JP, van der Vusse GJ, van Bilsen M. Saturated but not mono-unsaturated fatty acids induce apoptotic cell death in neonatal rat ventricular myocytes. J Lipid Res 38: 1384–1394, 1997. [PubMed] [Google Scholar]
- 14.Dodd MS, Ball DR, Schroeder MA, Le Page LM, Atherton HJ, Heather LC, Seymour AM, Ashrafian H, Watkins H, Clarke K, Tyler DJ. In vivo alterations in cardiac metabolism and function in the spontaneously hypertensive rat heart. Cardiovasc Res 95: 69–76, 2012. doi: 10.1093/cvr/cvs164. [DOI] [PMC free article] [PubMed] [Google Scholar]
- 15.Doenst T, Nguyen TD, Abel ED. Cardiac metabolism in heart failure: implications beyond ATP production. Circ Res 113: 709–724, 2013. doi: 10.1161/CIRCRESAHA.113.300376. [DOI] [PMC free article] [PubMed] [Google Scholar]
- 16.Dyntar D, Eppenberger-Eberhardt M, Maedler K, Pruschy M, Eppenberger HM, Spinas GA, Donath MY. Glucose and palmitic acid induce degeneration of myofibrils and modulate apoptosis in rat adult cardiomyocytes. Diabetes 50: 2105–2113, 2001. doi: 10.2337/diabetes.50.9.2105. [DOI] [PubMed] [Google Scholar]
- 17.Dziedzic T, Slowik A, Pera J, Szczudlik A. Association between hyperglycemia, heart failure and mortality in stroke patients. Eur J Neurol 16: 251–256, 2009. doi: 10.1111/j.1468-1331.2008.02400.x. [DOI] [PubMed] [Google Scholar]
- 18.Folmes KD, Chan AY, Koonen DP, Pulinilkunnil TC, Baczkó I, Hunter BE, Thorn S, Allard MF, Roberts R, Gollob MH, Light PE, Dyck JR. Distinct early signaling events resulting from the expression of the PRKAG2 R302Q mutant of AMPK contribute to increased myocardial glycogen. Circ Cardiovasc Genet 2: 457–466, 2009. doi: 10.1161/CIRCGENETICS.108.834564. [DOI] [PubMed] [Google Scholar]
- 19.Francis VA, Zorzano A, Teleman AA. dDOR is an EcR coactivator that forms a feed-forward loop connecting insulin and ecdysone signaling. Curr Biol 20: 1799–1808, 2010. doi: 10.1016/j.cub.2010.08.055. [DOI] [PubMed] [Google Scholar]
- 20.Fredersdorf S, Thumann C, Ulucan C, Griese DP, Luchner A, Riegger GA, Kromer EP, Weil J. Myocardial hypertrophy and enhanced left ventricular contractility in Zucker diabetic fatty rats. Cardiovasc Pathol 13: 11–19, 2004. doi: 10.1016/S1054-8807(03)00109-1. [DOI] [PubMed] [Google Scholar]
- 21.Galindo CL, Skinner MA, Errami M, Olson LD, Watson DA, Li J, McCormick JF, McIver LJ, Kumar NM, Pham TQ, Garner HR. Transcriptional profile of isoproterenol-induced cardiomyopathy and comparison to exercise-induced cardiac hypertrophy and human cardiac failure. BMC Physiol 9: 23, 2009. doi: 10.1186/1472-6793-9-23. [DOI] [PMC free article] [PubMed] [Google Scholar]
- 22.Galluzzi L, Pietrocola F, Levine B, Kroemer G. Metabolic control of autophagy. Cell 159: 1263–1276, 2014. doi: 10.1016/j.cell.2014.11.006. [DOI] [PMC free article] [PubMed] [Google Scholar]
- 23.Ghazalpour A, Rau CD, Farber CR, Bennett BJ, Orozco LD, van Nas A, Pan C, Allayee H, Beaven SW, Civelek M, Davis RC, Drake TA, Friedman RA, Furlotte N, Hui ST, Jentsch JD, Kostem E, Kang HM, Kang EY, Joo JW, Korshunov VA, Laughlin RE, Martin LJ, Ohmen JD, Parks BW, Pellegrini M, Reue K, Smith DJ, Tetradis S, Wang J, Wang Y, Weiss JN, Kirchgessner T, Gargalovic PS, Eskin E, Lusis AJ, LeBoeuf RC. Hybrid mouse diversity panel: a panel of inbred mouse strains suitable for analysis of complex genetic traits. Mamm Genome 23: 680–692, 2012. doi: 10.1007/s00335-012-9411-5. [DOI] [PMC free article] [PubMed] [Google Scholar]
- 24.Hamilton C, Saggerson ED. Malonyl-CoA metabolism in cardiac myocytes. Biochem J 350: 61–67, 2000. doi: 10.1042/bj3500061. [DOI] [PMC free article] [PubMed] [Google Scholar]
- 25.Huang H, Wu K, You Q, Huang R, Li S, Wu K. Naringin inhibits high glucose-induced cardiomyocyte apoptosis by attenuating mitochondrial dysfunction and modulating the activation of the p38 signaling pathway. Int J Mol Med 32: 396–402, 2013. doi: 10.3892/ijmm.2013.1403. [DOI] [PubMed] [Google Scholar]
- 26.Huss JM, Kelly DP. Mitochondrial energy metabolism in heart failure: a question of balance. J Clin Invest 115: 547–555, 2005. doi: 10.1172/JCI24405. [DOI] [PMC free article] [PubMed] [Google Scholar]
- 27.Iribarren C, Karter AJ, Go AS, Ferrara A, Liu JY, Sidney S, Selby JV. Glycemic control and heart failure among adult patients with diabetes. Circulation 103: 2668–2673, 2001. doi: 10.1161/01.CIR.103.22.2668. [DOI] [PubMed] [Google Scholar]
- 28.Iwase M, Lally ET, Berthold P, Korchak HM, Taichman NS. Effects of cations and osmotic protectants on cytolytic activity of Actinobacillus actinomycetemcomitans leukotoxin. Infect Immun 58: 1782–1788, 1990. [DOI] [PMC free article] [PubMed] [Google Scholar]
- 29.Jaswal JS, Keung W, Wang W, Ussher JR, Lopaschuk GD. Targeting fatty acid and carbohydrate oxidation–a novel therapeutic intervention in the ischemic and failing heart. Biochim Biophys Acta 1813: 1333–1350, 2011. doi: 10.1016/j.bbamcr.2011.01.015. [DOI] [PubMed] [Google Scholar]
- 30.Kannel WB, McGee DL. Diabetes and glucose tolerance as risk factors for cardiovascular disease: the Framingham study. Diabetes Care 2: 120–126, 1979. doi: 10.2337/diacare.2.2.120. [DOI] [PubMed] [Google Scholar]
- 31.Kato T, Niizuma S, Inuzuka Y, Kawashima T, Okuda J, Tamaki Y, Iwanaga Y, Narazaki M, Matsuda T, Soga T, Kita T, Kimura T, Shioi T. Analysis of metabolic remodeling in compensated left ventricular hypertrophy and heart failure. Circ Heart Fail 3: 420–430, 2010. doi: 10.1161/CIRCHEARTFAILURE.109.888479. [DOI] [PubMed] [Google Scholar]
- 32.Kris-Etherton PM, Harris WS, Appel LJ; American Heart Association. Nutrition Committee . Fish consumption, fish oil, omega-3 fatty acids, and cardiovascular disease. Circulation 106: 2747–2757, 2002. doi: 10.1161/01.CIR.0000038493.65177.94. [DOI] [PubMed] [Google Scholar]
- 33.Langfelder P, Horvath S. Fast R functions for robust correlations and hierarchical clustering. J Stat Softw 46: pii: i11, 2012. doi: 10.18637/jss.v046.i11. [DOI] [PMC free article] [PubMed] [Google Scholar]
- 34.Langfelder P, Horvath S. WGCNA: an R package for weighted correlation network analysis. BMC Bioinformatics 9: 559, 2008. doi: 10.1186/1471-2105-9-559. [DOI] [PMC free article] [PubMed] [Google Scholar]
- 35.Lazzeri C, Valente S, Attanà P, Chiostri M, Picariello C, Gensini GF. Acute hyperglycemia and insulin resistance in acute heart failure syndromes without previously known diabetes. Intern Emerg Med 7: 497–503, 2012. doi: 10.1007/s11739-011-0597-4. [DOI] [PubMed] [Google Scholar]
- 36.Lionetti V, Stanley WC, Recchia FA. Modulating fatty acid oxidation in heart failure. Cardiovasc Res 90: 202–209, 2011. doi: 10.1093/cvr/cvr038. [DOI] [PMC free article] [PubMed] [Google Scholar]
- 37.Lopaschuk GD, Jaswal JS. Energy metabolic phenotype of the cardiomyocyte during development, differentiation, and postnatal maturation. J Cardiovasc Pharmacol 56: 130–140, 2010. doi: 10.1097/FJC.0b013e3181e74a14. [DOI] [PubMed] [Google Scholar]
- 38.Lopaschuk GD, Ussher JR, Folmes CD, Jaswal JS, Stanley WC. Myocardial fatty acid metabolism in health and disease. Physiol Rev 90: 207–258, 2010. doi: 10.1152/physrev.00015.2009. [DOI] [PubMed] [Google Scholar]
- 39.Mauvezin C, Orpinell M, Francis VA, Mansilla F, Duran J, Ribas V, Palacín M, Boya P, Teleman AA, Zorzano A. The nuclear cofactor DOR regulates autophagy in mammalian and Drosophila cells. EMBO Rep 11: 37–44, 2010. doi: 10.1038/embor.2009.242. [DOI] [PMC free article] [PubMed] [Google Scholar]
- 40.Mellor KM, Varma U, Stapleton DI, Delbridge LM. Cardiomyocyte glycophagy is regulated by insulin and exposure to high extracellular glucose. Am J Physiol Heart Circ Physiol 306: H1240–H1245, 2014. doi: 10.1152/ajpheart.00059.2014. [DOI] [PubMed] [Google Scholar]
- 41.Moey M, Gan XT, Huang CX, Rajapurohitam V, Martínez-Abundis E, Lui EM, Karmazyn M. Ginseng reverses established cardiomyocyte hypertrophy and postmyocardial infarction-induced hypertrophy and heart failure. Circ Heart Fail 5: 504–514, 2012. doi: 10.1161/CIRCHEARTFAILURE.112.967489. [DOI] [PubMed] [Google Scholar]
- 42.Morissette MR, Howes AL, Zhang T, Heller Brown J. Upregulation of GLUT1 expression is necessary for hypertrophy and survival of neonatal rat cardiomyocytes. J Mol Cell Cardiol 35: 1217–1227, 2003. doi: 10.1016/S0022-2828(03)00212-8. [DOI] [PubMed] [Google Scholar]
- 43.Morton NM, Nelson YB, Michailidou Z, Di Rollo EM, Ramage L, Hadoke PW, Seckl JR, Bunger L, Horvat S, Kenyon CJ, Dunbar DR. A stratified transcriptomics analysis of polygenic fat and lean mouse adipose tissues identifies novel candidate obesity genes. PLoS One 6: e23944, 2011. doi: 10.1371/journal.pone.0023944. [DOI] [PMC free article] [PubMed] [Google Scholar]
- 44.Nowak J, Archange C, Tardivel-Lacombe J, Pontarotti P, Pébusque MJ, Vaccaro MI, Velasco G, Dagorn JC, Iovanna JL. The TP53INP2 protein is required for autophagy in mammalian cells. Mol Biol Cell 20: 870–881, 2008. doi: 10.1091/mbc.E08-07-0671. [DOI] [PMC free article] [PubMed] [Google Scholar]
- 45.O’Donnell CJ, Nabel EG. Genomics of cardiovascular disease. N Engl J Med 365: 2098–2109, 2011. doi: 10.1056/NEJMra1105239. [DOI] [PubMed] [Google Scholar]
- 46.Osorio-Fuentealba C, Contreras-Ferrat AE, Altamirano F, Espinosa A, Li Q, Niu W, Lavandero S, Klip A, Jaimovich E. Electrical stimuli release ATP to increase GLUT4 translocation and glucose uptake via PI3Kγ-Akt-AS160 in skeletal muscle cells. Diabetes 62: 1519–1526, 2013. doi: 10.2337/db12-1066. [DOI] [PMC free article] [PubMed] [Google Scholar]
- 47.Osorio JC, Stanley WC, Linke A, Castellari M, Diep QN, Panchal AR, Hintze TH, Lopaschuk GD, Recchia FA. Impaired myocardial fatty acid oxidation and reduced protein expression of retinoid X receptor-alpha in pacing-induced heart failure. Circulation 106: 606–612, 2002. doi: 10.1161/01.CIR.0000023531.22727.C1. [DOI] [PubMed] [Google Scholar]
- 48.Ota A, Zhang J, Ping P, Han J, Wang Y. Specific regulation of noncanonical p38alpha activation by Hsp90-Cdc37 chaperone complex in cardiomyocyte. Circ Res 106: 1404–1412, 2010. doi: 10.1161/CIRCRESAHA.109.213769. [DOI] [PMC free article] [PubMed] [Google Scholar]
- 49.Pi Y, Walker JW. Diacylglycerol and fatty acids synergistically increase cardiomyocyte contraction via activation of PKC. Am J Physiol Heart Circ Physiol 279: H26–H34, 2000. [DOI] [PubMed] [Google Scholar]
- 50.Rabinowitz JD, White E. Autophagy and metabolism. Science 330: 1344–1348, 2010. doi: 10.1126/science.1193497. [DOI] [PMC free article] [PubMed] [Google Scholar]
- 51.Rau CD, Romay MC, Tuteryan M, Wang JJ, Santolini M, Ren S, Karma A, Weiss JN, Wang Y, Lusis AJ. Systems genetics approach identifies gene pathways and Adamts2 as drivers of isoproterenol-induced cardiac hypertrophy and cardiomyopathy in mice. Cell Syst 4: 121–128.e4, 2017. doi: 10.1016/j.cels.2016.10.016. [DOI] [PMC free article] [PubMed] [Google Scholar]
- 52.Rau CD, Wang J, Avetisyan R, Romay MC, Martin L, Ren S, Wang Y, Lusis AJ. Mapping genetic contributions to cardiac pathology induced by Beta-adrenergic stimulation in mice. Circ Cardiovasc Genet 8: 40–49, 2015. doi: 10.1161/CIRCGENETICS.113.000732. [DOI] [PMC free article] [PubMed] [Google Scholar]
- 53.Razeghi P, Young ME, Alcorn JL, Moravec CS, Frazier OH, Taegtmeyer H. Metabolic gene expression in fetal and failing human heart. Circulation 104: 2923–2931, 2001. doi: 10.1161/hc4901.100526. [DOI] [PubMed] [Google Scholar]
- 54.Sack MN, Rader TA, Park S, Bastin J, McCune SA, Kelly DP. Fatty acid oxidation enzyme gene expression is downregulated in the failing heart. Circulation 94: 2837–2842, 1996. doi: 10.1161/01.CIR.94.11.2837. [DOI] [PubMed] [Google Scholar]
- 55.Sancho A, Duran J, García-España A, Mauvezin C, Alemu EA, Lamark T, Macias MJ, DeSalle R, Royo M, Sala D, Chicote JU, Palacín M, Johansen T, Zorzano A. DOR/Tp53inp2 and Tp53inp1 constitute a metazoan gene family encoding dual regulators of autophagy and transcription. PLoS One 7: e34034, 2012. doi: 10.1371/journal.pone.0034034. [DOI] [PMC free article] [PubMed] [Google Scholar]
- 56.Sato A, Funder JW. High glucose stimulates aldosterone-induced hypertrophy via type I mineralocorticoid receptors in neonatal rat cardiomyocytes. Endocrinology 137: 4145–4153, 1996. [DOI] [PubMed] [Google Scholar]
- 57.Schwartz A, Lee KS. Study of heart mitochondria and glycolytic metabolism in experimentally induced cardiac failure. Circ Res 10: 321–332, 1962. doi: 10.1161/01.RES.10.3.321. [DOI] [PubMed] [Google Scholar]
- 58.Singh R. Autophagy and regulation of lipid metabolism. Results Probl Cell Differ 52: 35–46, 2010. doi: 10.1007/978-3-642-14426-4_4. [DOI] [PMC free article] [PubMed] [Google Scholar]
- 59.Sorokina N, O’Donnell JM, McKinney RD, Pound KM, Woldegiorgis G, LaNoue KF, Ballal K, Taegtmeyer H, Buttrick PM, Lewandowski ED. Recruitment of compensatory pathways to sustain oxidative flux with reduced carnitine palmitoyltransferase I activity characterizes inefficiency in energy metabolism in hypertrophied hearts. Circulation 115: 2033–2041, 2007. doi: 10.1161/CIRCULATIONAHA.106.668665. [DOI] [PubMed] [Google Scholar]
- 60.Stanley WC, Chandler MP. Energy metabolism in the normal and failing heart: potential for therapeutic interventions. Heart Fail Rev 7: 115–130, 2002. doi: 10.1023/A:1015320423577. [DOI] [PubMed] [Google Scholar]
- 61.Stanley WC, Recchia FA, Lopaschuk GD. Myocardial substrate metabolism in the normal and failing heart. Physiol Rev 85: 1093–1129, 2005. doi: 10.1152/physrev.00006.2004. [DOI] [PubMed] [Google Scholar]
- 62.Suzuki F, Saito N, Ishida N. Effect of an interferon inducer, 9-methylstreptimidone, on influenza virus infection in mice. Ann N Y Acad Sci 284: 667–675, 1977. doi: 10.1111/j.1749-6632.1977.tb22002.x. [DOI] [PubMed] [Google Scholar]
- 63.Taegtmeyer H, Golfman L, Sharma S, Razeghi P, van Arsdall M. Linking gene expression to function: metabolic flexibility in the normal and diseased heart. Ann N Y Acad Sci 1015: 202–213, 2004. doi: 10.1196/annals.1302.017. [DOI] [PubMed] [Google Scholar]
- 64.Thrainsdottir IS, Aspelund T, Thorgeirsson G, Gudnason V, Hardarson T, Malmberg K, Sigurdsson G, Rydén L. The association between glucose abnormalities and heart failure in the population-based Reykjavik study. Diabetes Care 28: 612–616, 2005. doi: 10.2337/diacare.28.3.612. [DOI] [PubMed] [Google Scholar]
- 65.Tsai KH, Wang WJ, Lin CW, Pai P, Lai TY, Tsai CY, Kuo WW. NADPH oxidase-derived superoxide anion-induced apoptosis is mediated via the JNK-dependent activation of NF-κB in cardiomyocytes exposed to high glucose. J Cell Physiol 227: 1347–1357, 2012. doi: 10.1002/jcp.22847. [DOI] [PubMed] [Google Scholar]
- 66.Ubil E, Duan J, Pillai IC, Rosa-Garrido M, Wu Y, Bargiacchi F, Lu Y, Stanbouly S, Huang J, Rojas M, Vondriska TM, Stefani E, Deb A. Mesenchymal-endothelial transition contributes to cardiac neovascularization. Nature 514: 585–590, 2014. doi: 10.1038/nature13839. [DOI] [PMC free article] [PubMed] [Google Scholar]
- 67.van der Vusse GJ, van Bilsen M, Glatz JF. Cardiac fatty acid uptake and transport in health and disease. Cardiovasc Res 45: 279–293, 2000. doi: 10.1016/S0008-6363(99)00263-1. [DOI] [PubMed] [Google Scholar]
- 68.Ventura-Clapier R, Garnier A, Veksler V. Energy metabolism in heart failure. J Physiol 555: 1–13, 2004. doi: 10.1113/jphysiol.2003.055095. [DOI] [PMC free article] [PubMed] [Google Scholar]
- 69.Wang JJ, Rau C, Avetisyan R, Ren S, Romay MC, Stolin G, Gong KW, Wang Y, Lusis AJ. Genetic dissection of cardiac remodeling in an isoproterenol-induced heart failure mouse model. PLoS Genet 12: e1006038, 2016. doi: 10.1371/journal.pgen.1006038. [DOI] [PMC free article] [PubMed] [Google Scholar]
- 70.Ye J, Coulouris G, Zaretskaya I, Cutcutache I, Rozen S, Madden TL. Primer-BLAST: a tool to design target-specific primers for polymerase chain reaction. BMC Bioinformatics 13: 134, 2012. doi: 10.1186/1471-2105-13-134. [DOI] [PMC free article] [PubMed] [Google Scholar]
- 71.Zhabyeyev P, Gandhi M, Mori J, Basu R, Kassiri Z, Clanachan A, Lopaschuk GD, Oudit GY. Pressure-overload-induced heart failure induces a selective reduction in glucose oxidation at physiological afterload. Cardiovasc Res 97: 676–685, 2013. doi: 10.1093/cvr/cvs424. [DOI] [PubMed] [Google Scholar]