

We show that induced cerebral blood flow oscillations suppress functional hyperemia produced by a working memory task as well as memory task performance. We conclude that oscillatory cerebral blood flow produces causal reductions of memory task neurovascular coupling and memory task performance. Reductions of functional hyperemia are constrained by autoregulation.
Keywords: functional hyperemia, neurovascular coupling, lower body negative pressure
Abstract
Neurovascular coupling (NVC) describes the link between an increase in task-related neural activity and increased cerebral blood flow denoted “functional hyperemia.” We previously showed induced cerebral blood flow oscillations suppressed functional hyperemia; conversely functional hyperemia also suppressed cerebral blood flow oscillations. We used lower body negative pressure (OLBNP) oscillations to force oscillations in middle cerebral artery cerebral blood flow velocity (CBFv). Here, we used N-back testing, an intellectual memory challenge as a neural activation task, to test the hypothesis that OLBNP-induced oscillatory cerebral blood flow can reduce functional hyperemia and NVC produced by a working memory task and can interfere with working memory. We used OLBNP (−30 mmHg) at 0.03, 0.05, and 0.10 Hz and measured spectral power of CBFv at all frequencies. Neither OLBNP nor N-back, alone or combined, affected hemodynamic parameters. 2-Back power and OLBNP individually were compared with 2-back power during OLBNP. 2-Back alone produced a narrow band increase in oscillatory arterial pressure (OAP) and oscillatory cerebral blood flow power centered at 0.0083 Hz. Functional hyperemia in response to 2-back was reduced to near baseline and 2-back memory performance was decreased by 0.03-, 0.05-, and 0.10-Hz OLBNP. OLBNP alone produced increased oscillatory power at frequencies of oscillation not suppressed by added 2-back. However, 2-back preceding OLBNP suppressed OLBNP power. OLBNP-driven oscillatory CBFv blunts NVC and memory performance, while memory task reciprocally interfered with forced CBFv oscillations. This shows that induced cerebral blood flow oscillations suppress functional hyperemia and functional hyperemia suppresses cerebral blood flow oscillations.
NEW & NOTEWORTHY We show that induced cerebral blood flow oscillations suppress functional hyperemia produced by a working memory task as well as memory task performance. We conclude that oscillatory cerebral blood flow produces causal reductions of memory task neurovascular coupling and memory task performance. Reductions of functional hyperemia are constrained by autoregulation.
neural activity related hyperemia or functional hyperemia, the increase in middle cerebral artery (MCA) blood flow velocity that can be measured in healthy control subjects as a result of mental challenges (31), occurs in the absence of changes in blood pressure (BP) or end-tidal carbon dioxide (ETco2) (33). Neurovascular coupling (NVC) (1) refers to the link between the increase in neural activity in response to a neural activation task and functional hyperemia (13) and involves interactions among the neurons, blood vessels, and glia comprising the neurovascular unit (19).
The impetus for this work was the observation of association of memory deficits and increased low-frequency oscillations (≤0.1 Hz) of cerebral blood flow velocity (OCBFv) in young patients with postural tachycardia syndrome (POTS), a form of chronic orthostatic intolerance, during upright posture (24, 34). OCBFv was highly coherent with and phase locked to oscillations in mean arterial pressure (OAP) at low frequencies indicating impaired cerebral autoregulation. OCBFv was amplified compared with healthy volunteers with larger transfer function gain (24), was increased monotonically with orthostatic stress during graded tilt testing (34), and was associated with reduced functional hyperemia and reduced memory performance not observed in healthy controls (34, 35). This work showed an associative rather than a causal relationship between increased OCBF and reduced functional hyperemia/neurovascular coupling. We speculated that OCBF might cause reduced functional hyperemia and reduced memory performance.
In recent work we first tested the hypothesis that OCBF could reduce neural activation and functional hyperemia produced by passive arm flexion as a somatosensory stimulus. We showed that oscillatory lower body negative pressure (OLBNP) forced low-frequency OCBF that reduced functional hyperemia in healthy volunteer subjects (33). Reduced functional hyperemia was frequency dependent because of the countering effect of cerebral autoregulation at very low frequencies (41).
In the present study, we test the hypothesis that OLBNP-induced OCBF can reduce functional hyperemia and NVC produced by a working memory task and can interfere with working memory.
METHODS
Outline.
We measured CBFv in the left MCA by transcranial Doppler (TCD) ultrasound to assess the subject’s functional hyperemic response. As in previous work this was quantitated as the percent change from baseline CBFv to compensate for individual differences in the angles of insonation for each subject (34).
N-back testing.
We tested neurocognition during OLBNP by administering a parametric N-back (28) as the neural activation task. The N-back memory task measures executive working memory, concentration, and information processing of increasing difficulty as N increases (4, 31). In general to perform the N-back test we generated pseudorandom sequences of 29 capital letters, excluding vowels, which are presented on a computer monitor. Subjects then had to identify matching letters appearing N-characters previously in a 29 character sequence. Here as previously we used only a 2-back task with pseudorandom sequences presented multiple times. Subjects responded to perceived correct 2-back matches by pressing a button placed in their dominant hand. We used the number of correct responses to measure 2-back outcome. The visually presented stimulus duration was 1s, and interstimulus duration was 1s (4). The 2-back sequence therefore lasted 1 min. We used a 2-back memory task to be consistent with our previous work and because it provided the most reliable results (33). There was a 1 min resting period (no 2-back) following each 2-back sequence. Each random 2-back sequence followed by rest was then repeated for a total of eight complete 120-s cycles.
2-Back testing and CBFv during OLBNP.
Subjects performed 2-back testing while their CBFv was measured during OLBNP. CBFv, averaged over each cardiac interval, was taken over the eight cycle epoch; measurable increments of which were produced by the 60-s 2-back task. 2-Back testing was performed by the same individual on all subjects to minimize variation. We employed a periodic activation task so that we could use Fourier methods (see below) to measure changes in average oscillatory amplitude during oscillatory cerebral blood flow (OCBF) functional hyperemia. Thus functional hyperemia was cycled with a period of 120 s (fundamental frequency of 0.0083 Hz) increasing during periods of 2-back and decreasing during periods of rest. In this way we generated a 960-s long epoch of oscillating functional hyperemia.
The frequency resolution is equal to the inverse of the time duration during which a signal is being observed. The prolonged recording results in a frequency resolution slightly less than 0.001 Hz. Our measure of functional hyperemia was obtained by using Simpsons rule (16) to integrate the power spectral density over a 0.01-Hz band encompassing 0.0083 Hz, which is equivalent to multiplying the mean over the interval by 0.01 Hz in spectral power.
We used the protocol of Taylor and colleagues (10–12, 36) and applied oscillatory lower body negative pressure (OLBNP) to drive frequency oscillations in MAP and CBFv at 0.03, 0.05, and 0.10 Hz. These frequencies correspond to observed spontaneous oscillations that relate to cerebral autoregulation (6). OLBNP was accomplished by varying negative pressure between 0 and −30 mmHg at each of these frequencies using a pressure gauge and manual pressure release valve. This generated a mean LBNP change of −15 mmHg.
Thus to obtain a 0.10-Hz oscillation the vacuum was turned on for 5 s and then off for 5 s; to obtain a 0.05-Hz oscillation the vacuum was turned on for 10 s and off for 10 s; and for 0.03 -Hz oscillation the vacuum was turned on for 15 s and off for 15 s. OLBNP was imposed at a given frequency for 16 min, which was maintained during 2-back for an additional 16 min.
When 2-back sequences were complete, OLBNP was turned off and the subject was allowed to recover for 30 min. At each frequency of OLBNP, including the absence of OLBNP (0 Hz), we measured spectral power contained within a 0.01-Hz band encompassing 0.03 Hz (0.025–0.035 Hz), 0.05 Hz (0.045–0.055 Hz), and 0.10 Hz (0.95–0.105 Hz) as well as power at the frequency of 2-back functional hyperemia repeats 0.0083 Hz (0.0033–0.0133 Hz).
Subjects.
We enrolled 12 consecutive healthy volunteers. Subjects were 19–27 yr old (median age 23.5 yr, 6 female, 6 males). Healthy volunteers were nonsmoking individuals with no previously known medical conditions, free of systemic illness, with a normal physical exam and electrocardiogram. Healthy female subjects were enrolled without regard to their use of oral contraceptives or the phase of their menstrual cycle. Healthy volunteers were included only if they had never experienced orthostatic intolerance of any type, including orthostatic hypotension, postural tachycardia syndrome, and syncope. We also excluded subjects with a history of respiratory disease, sleep apnea, heart disease, renal disease, systemic hypertension, diabetes, acute or chronic inflammatory disease, neoplasm, immune-mediated disease, past head trauma, obesity, congenital heart disease, or peripheral vascular disease.
Subjects took no medications, including nonprescription medications, for at least 2 wk before the study with the exception of contraceptive medications. All subjects were practicing an acceptable method of birth control. None of the subjects had ever received cardioactive or vasoactive medications. All subjects were required to stop ingestion of xanthine-, caffeine-, and alcohol-containing substances 72 h before study. A light breakfast was permitted on testing day if eaten 2 or more hours before testing.
The Institutional Review Board of New York Medical College reviewed and approved this protocol. Each subject received a detailed description of all protocols and was given an opportunity to have their questions answered. Signed informed consent was obtained from all participants.
Instrumentation.
All subjects were instrumented in a similar fashion by the same operators. Height and weight were measured. During instrumentation, all subjects lay supine on a bed. Beat-to-beat BP was monitored using finger arterial plethysmography (Finometer; FMS, Amsterdam, The Netherlands) on the left middle or index finger which was calibrated to brachial artery pressure. A single lead ECG measured heart rate (HR). A nasal cannula connected to a capnograph to measure ETco2 and a pulse oximeter to measure O2 saturation (Smiths Medical, Waukesha, WI). We used transcranial Doppler ultrasound (TCD; Neurovision; Multigon, Yonkers, NY) to measure CBFv in the left middle cerebral artery (MCA) at a depth of 5–6 cm using a 2-MHz probe fixed to the subject’s head by a custom-made headband. All analog signals were digitized at 200 Hz with custom signal processing software and analyzed off-line.
OLBNP.
Subjects were placed in the supine position into the LBNP box such that their lower bodies (legs and hips up to the level of iliac crest) were placed in an airtight chamber (the LBNP box) and instrumented. The subjects were sealed within the box with a rubber diaphragm hermetically fitted around the iliac crest that did not compress the abdomen. Suction was provided by a vacuum pump capable of rapidly producing changes in negative pressure. Negative pressure was set with a variable autotransformer calibrated against an electronic manometer. A manual pressure release valve was used to control the timing of pressure pulses.
Protocol.
All subjects arrived at 9:30 AM. Following instrumentation, subjects remained supine and were placed within the LBNP box. We familiarized subjects with passive 2-back and LBNP box function including changes in vacuum pressure. There was a minimum of 30-min equilibration after instrumentation and LBNP installation. During this time subjects were instructed in the 2-back and OLBNP protocol. Baseline measurements of arterial pressure, CBFv, HR, and ETco2 were taken over the next 16 min. Eight 2-back + rest sequences for 16 min were performed at baseline in the absence of OLBNP as outlined above. Subjects then rested 30 min. OLBNP at each frequency without 2-back was performed for 16 min after which eight 2-back sequences were performed during OLBNP at 0.03, 0.05, and 0.10 Hz presented in random order. At the end of 2-back runs, OLBNP was turned off and the subjects were allowed to recover for 30 min. The duration of the experiment was ~4 1/2 h. Figure 1 is a schematic diagram of the study design.
Fig. 1.
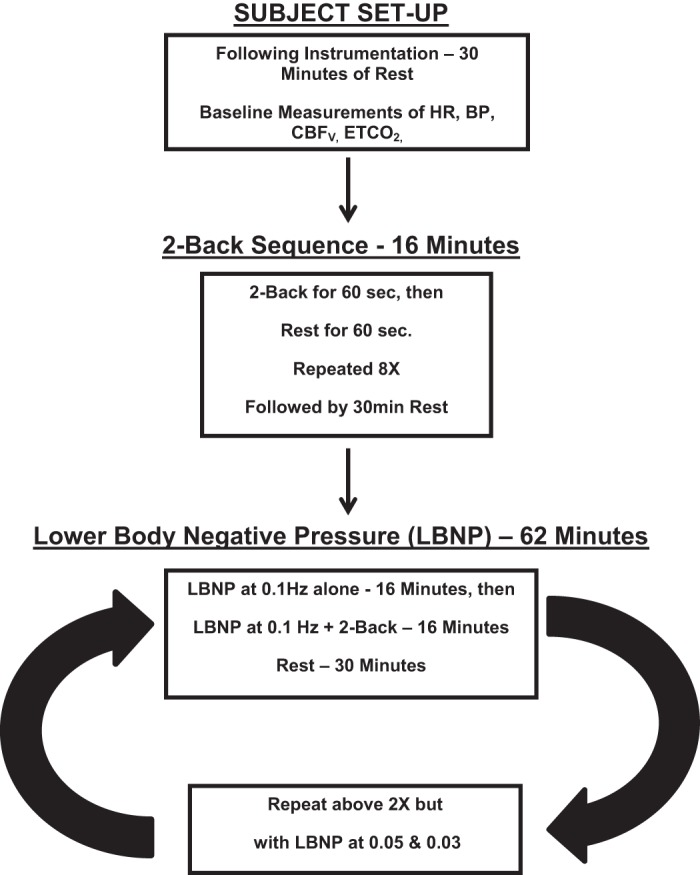
A schematic diagram of the study design used in these determinations. HR, heart rate; BP, blood pressure; CBFv, cerebral blood flow velocity; ETco2, end-tidal carbon dioxide.
A priori stopping criteria (end test) were in place including signs and symptoms of presyncope defined as a decrease in systolic BP to 80 mmHg; a decrease in systolic BP to 90 mmHg associated with symptoms of lightheadedness, nausea, sweating, or diaphoresis or progressive symptoms of orthostatic intolerance accompanied by a request to discontinue the test. All subjects completed the protocol.
Data analysis.
All data were continuously sampled at 200 Hz, were converted with an analog-to-digital converter (DI-720 DataQ Ind, Milwaukee, WI) connected to a personal computer and analyzed offline. NCSS 2007 (NCSS, LCC, Kaysville, UT) statistical software was used in the statistical analysis.
Time-averaged CBFv, MAP, HR, and ETco2.
Time averaged CBFv, MAP, HR, and ETco2 were measured at baseline periods (no OLBNP and no 2-back), during 2-back alone (no OLBNP), OLBNP alone at each frequency of oscillation, and 2-back + OLBNP at each frequency of oscillation and were compared by one way ANOVA.
Oscillatory CBFv and MAP.
We meaned CBFv and arterial pressure over each cardiac cycle. We anti-alias filtered the signals using a zero-phase 8th order low-pass Butterworth filter at 0.4Hz. Power spectral density curves (periodograms) were computed using the squared amplitudes of a Hanning windowed fast Fourier transform (FFT) for each time series (CBFv, MAP, and HR), at each oscillatory LBNP frequency (0.03, 0.05, 0.10 Hz) during 16 min intervals with and without 2-back. We include baseline as no OLBNP or 0 Hz.
We detected extremely low-frequency oscillations. Often FFT analyses employ data detrending that can influence estimated power spectra particularly at the lowest frequencies (9), especially if high order detrending is employed (27). Therefore, we only subtracted mean values from our time series (17).
Before computing the FFT we applied a tapered Hanning window to the entire data set to limit spectral leakage caused by the finite nature of the data (14) after which FFT was computed. To deal with the high order of variance in the periodogram we chose to average data in the frequency domain over the 0.01 interval that encompasses each frequency of interest (2). Thus, at each frequency and 2-back condition, oscillatory power was determined by integrating the appropriate power spectrum density curve over the 0.01-Hz band encompassing each tabulated frequency (0.0083, 0.03, 0.05, and 0.10 Hz). Data were approximately log normal. Results for comparison were expressed as the difference of logarithms base 10 multiplied by 10 in units of decibels (dBel). Parametric analysis based on the log transformation is an acceptable approach and, indeed, will enhance the statistical validity of the comparisons when data severely skewed (e.g., follows a log-normal distribution). The transformation may address not only the skewness of the data but the heterogeneity of the variances. The difficulty with the log transformation occurs when the results are back transformed to yield clinically interpretable results. Means and confidence limits (even error bars) for back-transformed data may require complicated conversions to yield unbiased estimates (39, 40). However, if the results are interpretable on the log scale, then back transformation is not necessary.
We focused on the effects of 2-back on baseline power at 0.0083 Hz, our measure of functional hyperemia, and how the addition of OLBNP may alter that response, i.e., whether OLBNP blunts functional hyperemia. We also investigated the effects of OLBNP without 2-back on baseline power at 0.03, 0.05, and 0.10 Hz, and how the addition of 2-back may alter those responses. The effects of frequency of OLBNP and 2-back on neuronal activation of CBFv (function hyperemia) at the frequency of 2-back epochs were evaluated by repeated-measures two-way ANOVA with a Tukey post hoc correction for significant differences at P < 0.05. Graphical data were depicted as means ± SE. Significance was set at P < 0.05.
We employed autoregressive spectral estimation methods, a parametric method, to obtain spectral estimates. This was done for illustrative purposes only to present smoother autospectra. We followed the methods of Montano et al. (25). The Levinson-Durbin algorithm on the Yule-Walker equations was followed by Anderson’s test, choosing the order of the model that minimized Akaike’s final prediction error (17).
RESULTS
Baseline data.
To appreciate the effects of 2-back memory tasking and OLBNP, we first obtained baseline data that was recorded in the absence of both stimuli. Figure 2 shows this baseline data; top depicts smoothed baseline MAP and the bottom depicts smoothed baseline mean CBFv power spectral densities (periodograms).
Fig. 2.
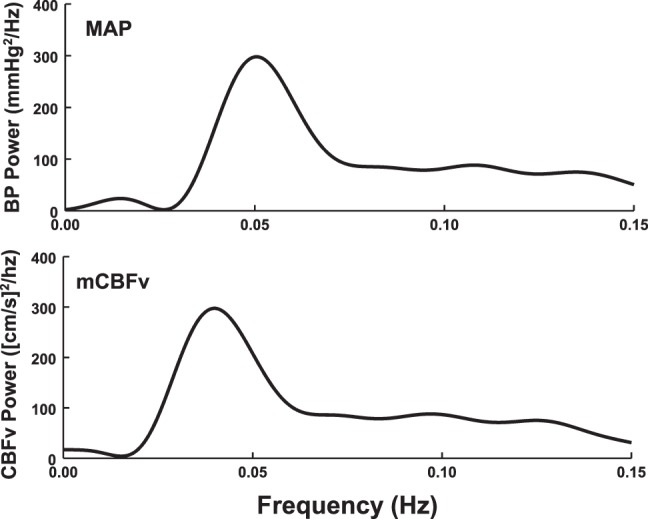
Baseline data obtained in the absence of 2-back and lower body negative pressure (OLBNP) oscillations. Mean arterial pressure (MAP; top) and mean cerebral blood flow velocity (CBFv; bottom) power spectral densities (periodograms), oscillatory arterial pressure (OAP), and oscillatory cerebral blood flow (OCBF), respectively, were averaged over all subjects and smoothed.
Effects of LBNP oscillations and 2-back on time-average values of MAP, CBFv, HR, and ETco2.
As shown in Table 1, the averaged hemodynamic data were unaffected by either OLBNP alone, or with and without 2-back.
Table 1.
Mean values with OLBNP with or without 2-back
| OLBNP Frequency of 0 Hz |
OLBNP Frequency of 0.03 Hz |
OLBNP Frequency of 0.05 Hz |
OLBNP Frequency of 0.10 Hz |
|||||
|---|---|---|---|---|---|---|---|---|
| Without 2-back | With 2-back | Without 2-back | With 2-back | Without 2-back | With 2-back | Without 2-back | With 2-back | |
| MAP, mmHg | 61 ± 2 | 61 ± 2 | 67 ± 4 | 68 ± 4 | 62 ± 2 | 66 ± 3 | 63 ± 2 | 65 ± 3 |
| mCBFv, cm/s | 73 ± 8 | 72 ± 8 | 70 ± 6 | 71 ± 6 | 69 ± 7 | 69 ± 8 | 67 ± 7 | 68 ± 7 |
| HR, min−1 | 62 ± 3 | 64 ± 2 | 63 ± 2 | 65 ± 2 | 63 ± 2 | 65 ± 2 | 63 ± 2 | 65 ± 3 |
| End-tidal CO2, Torr | 42 ± 1 | 41 ± 1 | 43 ± 1 | 43 ± 1 | 44 ± 1 | 43 ± 1 | 44 ± 1 | 44 ± 1 |
Values are means ± SE. OLBNP, lower body negative pressure oscillation; MAP, mean arterial pressure; mCBFv, mean cerebral blood flow velocity; HR, heart rate.
Effect of isolated 2-back and LBNP oscillations on MAP and CBFv power spectra.
Figure 3 shows power spectral densities of OAP and OCBF during 2-back alone in the absence of OLBNP (top) and to oscillating LBNP at the frequencies shown in the subsequent panels. Without OLBNP, 2-back alone produces a spike in both OAP and OCBF power centered at 0.0083 Hz. Very small oscillations in arterial pressure also occur during 2-back but are unlikely to drive large changes in oscillatory CBFv. In contrast, OLBNP oscillations produce large changes in OAP and OCBF at the LBNP box frequencies and low power harmonics were sometimes observed. While we computed variability in HR and ETco2 in our experiments, there was little consistency in the relation of their oscillatory power as related to 2-back. 2-Back had little effect on oscillatory HR or ETco2, nor did oscillations in HR and ETco2 effect 0.0083-Hz frequency power. While OLBNP at 0.03 Hz failed to increase the logarithm of HR oscillatory power, OLBNP at 0.05 and 0.10 Hz increased the logarithm of HR oscillatory power by 8 and 10 dB respectively.
Fig. 3.

Paired power spectral densities of MAP (OAP) and CBFv (OCBF) during 2-back without OLBNP (row 1), and during OLBNP without 2-back (rows 2-4) at each of the LBNP box oscillatory frequencies. The figure illustrates the spectral structure of individual signals at the different frequencies employed averaged over all subjects and smoothed. Spectral estimates were obtained using an autoregressive method. 2-Back had little effect on MAP spectrum with a small “bump” near 0.0083 Hz. However, 2-back marked increased OCBF velocity power centered at 0.0083 Hz. OLBNP produced large changes in both blood pressure and cerebral blood flow velocity at the LBNP box frequency.
Suppression of functional hyperemia (2-back power near 0.0083 Hz) by OLBNP.
Figure 4 shows the effects of OLBNP on functional hyperemia, corresponding to OCBF power at 0.0083 Hz, in response to 2-back averaged over all subjects. 2-Back OCBF power is shown before and after application of OLBNP at specific frequencies. In the top panel of Fig. 4, top, 2-back alone is followed by OLBNP with continued performance of the 2-back; a logarithmic comparison of power is shown. The black bars compare 2-back near 0.0083 Hz (functional hyperemia) to baseline, measured in the absence of OLBNP. The open bars compare 2-back during OLBNP at 0.03, 0.05, and 0.10 to 2-back alone (functional hyperemia). Oscillatory power is reduced nearly to baseline by 0.03 Hz (P < 0.01), 0.05 Hz (P < 0.01), and 0.10 Hz (P < 0.001) oscillations.
Fig. 4.
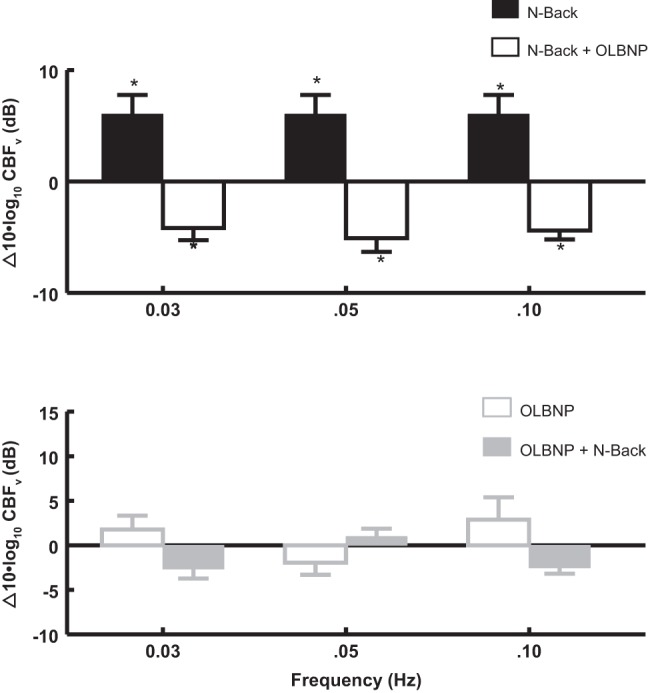
The effects of OLBNP at 0.03, 0.05, and 0.10 Hz on functional hyperemia measured by the OCBF power near 0.0083 Hz due to 2-back. Data are averaged over all subjects. Top: 2-back is compared with the absence of 2-back (baseline, black bars), and is shown as a log10 of OCBF power during 2-back −log10 of OCBF power at baseline or equivalently 10 × log10(2-back/baseline) in decibels. *Significant difference of the comparison. Similarly, OLBNP with 2-back is compared with 2-back alone (open bars) = 10 × log10([OLBNP+2-back]/2-back) which is a negative quantity (OLBNP reduces 2-back power). *Significant difference of the comparison. The net effect of first 2-back and then OLBNP + 2-back is equal to the sum of the logarithmic effects, net effect = log10(2-back/baseline) + log10[(OLBNP + 2-back)/2-back] = log10[(OLBNP + 2-back)/baseline] and is close to zero. Therefore, oscillatory power is reduced nearly to baseline by 0.05 Hz (P < 0.01) and 0.10 Hz (P < 0.001) LBNP oscillations. Bottom: effect on OCBF power near 0.0083 Hz of adding 2-back (open gray bars) after first applying and maintaining OLBNP at 0.03, 0.05, and 0.10 Hz (gray solid bars). There is no significant direct effect of OLBNP oscillations alone on OCBF power at 0.0083 Hz and no significant effect of 2-back on OCBF power at 0.0083 Hz in the presence of OLBNP.
Figure 4, bottom, shows the effect of adding 2-back after first applying OLBNP at 0.03, 0.05, and 0.10 Hz. Again, oscillatory power is only measured near 0.0083 Hz, the frequency of 2-back (functional hyperemia). There is no significant direct effect of OLBNP oscillations alone on functional hyperemia power. However, there is also no significant effect of 2-back on OCBF power at 0.0083 Hz in the presence of OLBNP. OLBNP at 0.03, 0.05, and 0.10 Hz effectively suppresses functional hyperemia.
Reduction of 2-back performance by OLBP.
Figure 5 shows the effects of OLBNP on 2-back performance measured by the percent 2-back answered correctly. Performance was assessed at baseline, in the absence of OLBNP, and at each imposed OLBNP frequency. The percent correct is significantly (P < 0.001) and similarly decreased at each frequency.
Fig. 5.
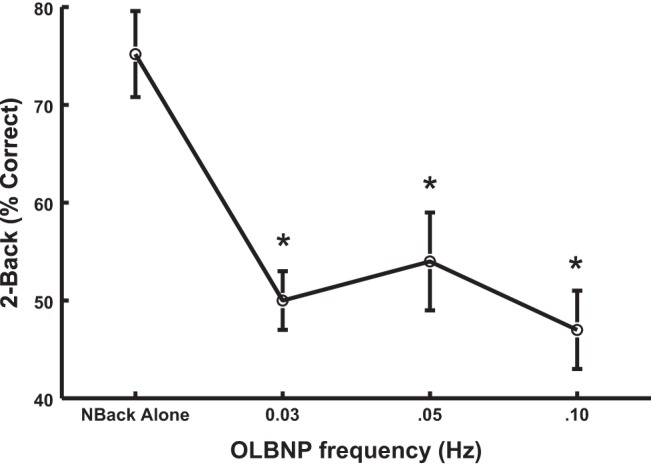
The effects of OLBNP on 2-back performance measured by the percent 2-back answered correctly when assessed at baseline, free of OLBNP, and at each OLBNP frequency. The percent correct is decreased similarly at each frequency.
Suppression of oscillatory MAP power (2-back power near 0.0083 Hz) by OLBNP.
Figure 6 shows the effects of OLBNP on oscillations in mean arterial pressure at 0.0083 Hz in response to 2-back averaged over all subjects. 2-Back OAP power is shown before and after application of OLBNP at specific frequencies. In Fig. 6, top, 2-back alone is followed by OLBNP with continued performance of the 2-back; a logarithmic comparison of power is shown. The black bars compare 2-back alone near 0.0083 Hz (functional hyperemia) to the cross-hatched bars which compare 2-back during OLBNP at 0.03, 0.05, and 0.10 Hz. 2-Back produces significant oscillations in mean arterial pressure (P < 0.001). Oscillatory MAP power is reduced nearly to baseline by 0.03 Hz (P < 0.01), 0.05 Hz (P < 0.01), and 0.10 Hz (P < 0.001) oscillations.
Fig. 6.
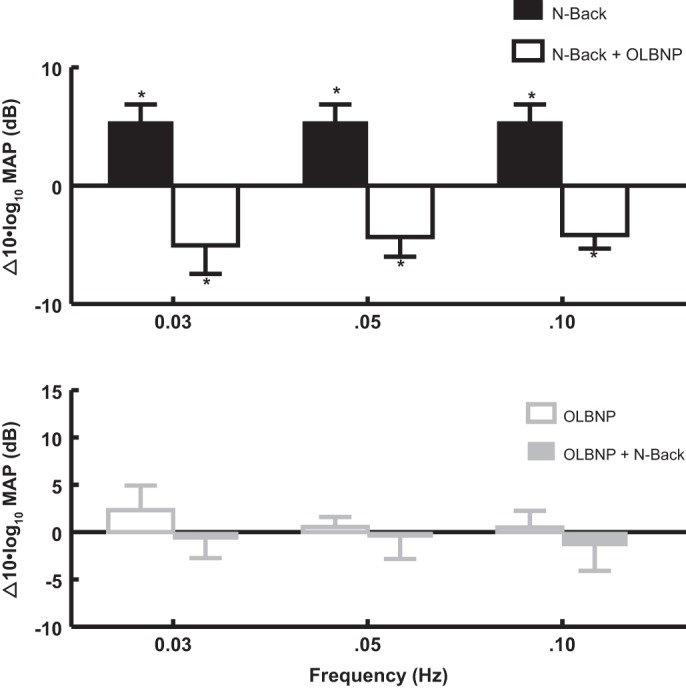
The effects of OLBNP at 0.03, 0.05, and 0.10 Hz on OAP power at 0.0083 Hz due to 2-back. Data are averaged over all subjects and are logarithmic as in Fig. 5 with results expressed as decibels. Top: 2-back alone compared with baseline (black bars) has no effect on OAP power at OLBNP frequencies. 2-Back is followed by OLBNP (open bars) while 2-back continues. Bottom: OLBNP is first applied (open gray bars), and maintained during subsequent 2-back. Logarithmic OAP power at 0.0083 Hz is increased at 0.03 (P < 0.025) and 0.05 Hz (P < 0.05). Increased power is reversed by the addition of 2-back to LBNP.
Figure 6, bottom, shows the effect of adding 2-back after first applying OLBNP at 0.03, 0.05, and 0.10 Hz. Again, oscillatory power is only measured near 0.0083 Hz, the frequency of 2-back (functional hyperemia). There is no significant direct effect of OLBNP oscillations alone on oscillatory mean arterial power at 0.0083 Hz. But, there is also no significant effect of 2-back on OAP power at 0.0083 Hz in the presence of OLBNP. Thus OLBNP at 0.03, 0.05, and 0.10 Hz effectively suppress OAP at 0.0083 Hz, the frequency of functional hyperemia. There was no significant change of OAP at any other frequency during 2-back.
Effect of functional hyperemia produced by 2-back on oscillatory power at 0.03, 0.05, and 0.10 Hz.
Since OLBNP interferes with functional hyperemia, we investigated whether 2-back interferes with oscillatory power at LBNP oscillation frequencies.
Figure 7 shows the effect of 2-back (at 0.0083 Hz) on OLBNP power at 0.03, 0.05, and 0.10 Hz. Figure 7, top, shows that 2-back alone has no effect on OCBF power at OLBNP frequencies but that it blunts subsequent effects of OLBNP at each frequency. Figure 7, bottom, shows that OLBNP significantly (P < 0.01) increases power at each frequency and that added 2-back exerts no subsequent effect on power at oscillatory frequencies.
Fig. 7.
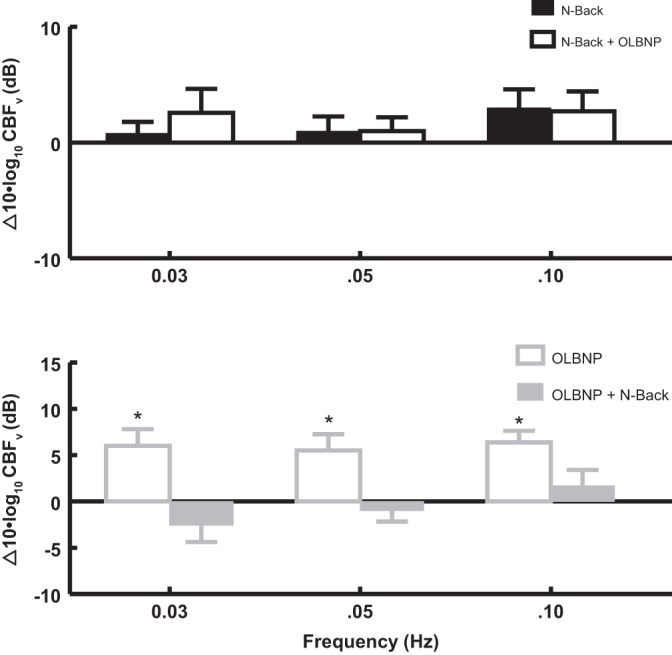
The effect of 2-back (at 0.0083 Hz) on logarithmic OCBFv power at 0.03, 0.05, and 0.10 Hz. Top: 2-back alone compared with baseline (black bars) has no effect on logarithmic power at OLBNP frequencies. 2-Back is followed by OLBNP (open bars) while 2-back continues. Bottom: effect of OLBNP compared with baseline (open gray bars) on OCBFv power when it is applied first. The addition of 2-back follows and is shown by the solid gray bars. Comparing OCBFv power in top and bottom suggests that it is reduced by 2-back at each frequency of OLBNP.
DISCUSSION
A 2-back working memory task produces functional hyperemia (34) evidenced by an increase in OCBF power measured at 0.0083 Hz. In addition, OLBNP driven oscillatory CBFv suppresses functional hyperemia resulting from the 2-back working memory task in healthy volunteers and thus suppresses neurovascular coupling. Our current work complements and extends our previous findings that showed the reduction of functional hyperemia resulting from a somatosensory task, arm flexion (33). In addition, we have shown that OLBNP also blunts 2-back memory performance. We also showed that 2-back started before but not after the application of OLBNP suppressed CBF oscillatory power. Thus the interactions between OLBNP driven CBFv oscillations and 2-back driven CBFv oscillations are reciprocal but not commuting. Causal increased OCBF reduces NVC and cognitive performance.
During oscillatory LBNP, CBFv, and MAP are highly coherent (10). Both oscillatory MAP (OAP) and oscillatory CBFv (OCBF) are forced by the oscillating LBNP that entrains both OCBF and OAP at the frequency of OLBNP; there need not be a direct relation between OCBF and OAP.
We have previously shown that impaired dynamic cerebral autoregulation in the absence of forcing also produces oscillatory CBFv and suppresses functional hyperemia at low frequencies secondary to entrainment of OCBF by OAP (24). We infer that low-frequency OCBF power however it occurs blunts functional hyperemia and therefore neurovascular coupling.
It is interesting to note from Figs. 4 and 7 that the change in logarithmic power when 2-back is followed by 2-back + OLBNP is different from the change in logarithmic power when initial OLBNP is followed by OLBNP + 2-back. The effects do not commute. This is consistent with nonlinear coupling in which the effects are not additive. Nonlinearity is implicit to our results as evidenced by signals at one frequency affecting signals at other frequencies. Of additional interest, 2-back tasking increased OAP at 0.0083 Hz, in contrast to arm flexion in which OAP was unaffected by tasking (33). This was measured in the absence of change in time average mean arterial pressure.
In our past study (33) we used an effort-independent means to produce hyperemia via a passive afferent motor stimulus, arm flexion. This required no effort on the part of the subject. The current study design, by employing 2-back testing, was able to address issues of higher cortical function such as cognition, which are considerably more complex than passive motor tasking.
The blunting of neural vascular coupling by blood flow oscillations, a type of “vasoneural coupling” akin to the hemo-neural hypothesis (26), is believed to result from the effects of shear stress and vasodilating signal molecules on astrocytes and neurons within the neurovascular unit (3, 5, 8). We have again shown that functional hyperemia (at least when cyclic) reciprocally reduces oscillatory CBFv, which could relate to the known interactions of pericapillary astrocytes and pericytes that are functionally linked to astrocytic processes in contact with pial vessels. Therefore, downstream astrocyte-derived signals from within the neurovascular unit can be transmitted to upstream pial arterioles and modulate cerebral autoregulation (38). The nature of these relationships however is unclear as it has recently been shown that capillary pericytes are not contractile and do not independently regulate CBF but may still have CBF regulatory functions (15).
Vasoneural coupling of astrocytic receptors by neuronal glutamate in animals induces increased intracellular calcium resulting in arteriolar vasodilation mediated by prostaglandins, epoxyeicosatrienoic acids (EETs) and NO and inhibited by 20-hydroxyeicosatrienoic acid (20-HETE) (7, 18, 41). NVC means that neural activity controls local CBF; vasoneural coupling indicates that local CBF reciprocally affects neuronal activity. This bidirectional reciprocity is characteristic of physical systems although directional kinetics can differ widely. By vasoneural coupling, OCBF could directly affect neurons and axons or indirectly affect astrocytes. For example, microvascular shear stress-driven endothelial cells can directly affect neurons by increasing NO, EET, and PG release causing axon depolarization (8). However, astrocytes can also depolarize due to vascular deformation (3) so that oscillatory shear stress couples vascular deformation to astrocyte depolarization and astrocyte depolarization to neuronal activity (20). Therefore, OCBF likely interferes with NVC and neuronal depolarization.
Increased OCBF implies reduced cerebral autoregulation.
CBF increments during task related cerebral activity (30) by a relatively small percentage of resting CBF (29). CBF is stabilized by cerebral autoregulation comprising properties of the cerebral vasculature that, in the absence of large environmental or metabolic changes, maintain overall CBF relatively unchanged despite changing BP (37). An unchanged time averaged CBF is referred to as static cerebral autoregulation. However, changes such as oscillations are also damped and are denoted dynamic autoregulation. OBLNP clearly alters dynamic cerebral autoregulation through forced oscillations. Thus, impaired dynamic autoregulation interferes with neurovascular coupling and task performance.
In summary, we show that induced OCBF suppress functional hyperemia and functional hyperemia suppresses OCBF. We therefore conclude that OCBF produces a causal reduction of functional hyperemia. Since we studied the role of OCBF using the range of frequencies for cerebral autoregulation, it appears that the reductions of functional hyperemia are constrained by autoregulation.
Limitations.
In the current study subjects responses to N-back testing could have varied because of differences in perceptual abilities, memory characteristics, and volitional components from the analysis.
TCD ultrasound measures OCBFv rather than OCBF, which depends on the cross-sectional area of the insonated artery. However, the MCA cross section may be relatively resistant to change during orthostatic stress (32). Also, changes in oscillations of CBFv are nearly proportionate to changes oscillations of CBF (21). Thus, for example, under conditions of changing BP, cerebral autoregulation can be estimated by TCD although it is influence may be slightly underestimated (22).
TCD only measures blood flow with good temporal resolution through specific cerebral blood vessels. One example is the MCA. The MCA is the main vessel that perfuses the area of the brain activated during working memory tasks as well as passive motor testing (23). In addition, while measurements of central venous pressure, cerebral venous pressure, cerebral blood volume, and cerebral oxygen delivery would help to provide more mechanistic insights, these determinations are beyond the scope of our capabilities. We also did not measure evoked potentials and thus are unable to comment on whether these were affected by the imposed experimental maneuvers.
Strictly speaking, FFT analysis depends on linear time-independent system characteristics. While the linear hypothesis is at best an approximation, it still provides useful information. Another concern is the relatively small range of amplitudes of AP and CBFv that are interrogated, particularly while supine. It is likely that additional phenomena can manifest at larger amplitudes in nonlinear systems. In addition, given that a large external stimulus (OLBNP) that drives oscillations in BP, the possibility exists that OLBNP drives OCBF as well by nonlinear means. Thus both OAP and OCBF relate to OLBNP and may only indirectly relate to one another.
Although mean ETco2 did not vary with OLBNP, oscillations in ETco2 could potentially influence oscillatory CBF results. However, it was not feasible to make such measurements because spurious ETco2 signals occurred whenever the patient opened their mouth and at other times as well. To account for this in calculating mean ETco2 we manually detected suitable ETco2 signals for measurement. There was no practical way to compensate adequately for such spurious signals and therefore no way to obtain a smooth sequence of ETco2. However, there is no respiratory entrainment at the imposed frequencies of OLBNP and thus important entrained oscillations in ETco2 are unlikely to impact OCBF and OAP, which were driven by the overwhelming external signal of the oscillating box.
By showing that induced OCBF suppress functional hyperemia produced by a working memory task as well as memory task performance, we concluded that OCBF produces causal reductions of memory task neurovascular coupling and memory task performance. Reductions of functional hyperemia are constrained by autoregulation. This is important because it demonstrates the complexities between external influences, autoregulation, neurovascular coupling and task performance. Although we tested this in a relatively young population, we cannot comment on these relationships in older subjects, nor do we know the effects of disease or medications.
In addition, since we were not able to directly measure cerebral arterial and venous pressures or autonomic activation or quantitate changes in sensory signaling during our investigations, we do not know how or if they were changed by our interventions. Thus we cannot comment on their relative contributions changes in dynamic autoregulation, neurovascular coupling and the reduction in task performance afforded by OLBNP.
Our findings suggest a strong reciprocal relationship between OCBF and functional hyperemia that likely exists during many if not all conditions. How this is affected by changes in BP, posture, respiratory alterations of CO2, etc., may be the subject of future investigations.
GRANTS
Funding for this project was provided by National Heart, Lung, and Blood Institute Gratns R01-HL-112736 and R01-HL-074873 (to J. M. Stewart) and National Institute of Neurological Disorders and Stroke Grant 1R21-NS-094644 (to M. S. Medow).
DISCLOSURES
No conflicts of interest, financial or otherwise, are declared by the author(s).
AUTHOR CONTRIBUTIONS
S.M., M.S.M., and C.T. performed experiments; S.M., P.V., and J.M.S. analyzed data; S.M., M.S.M., P.V., C.T., and J.M.S. interpreted results of experiments; S.M. and J.M.S. drafted manuscript; S.M., M.S.M., P.V., C.T., and J.M.S. approved final version of manuscript; M.S.M. and J.M.S. prepared figures; M.S.M., P.V., and C.T. edited and revised manuscript.
REFERENCES
- 1.Attwell D, Buchan AM, Charpak S, Lauritzen M, Macvicar BA, Newman EA. Glial and neuronal control of brain blood flow. Nature 468: 232–243, 2010. doi: 10.1038/nature09613. [DOI] [PMC free article] [PubMed] [Google Scholar]
- 2.Bendat JS, Piersol AG. Random Data: Analysis and Measurement Procedures. New York: Wiley-Interscience, John Wiley & Sons, 2000, p. 437–441. [Google Scholar]
- 3.Bowman CL, Ding JP, Sachs F, Sokabe M. Mechanotransducing ion channels in astrocytes. Brain Res 584: 272–286, 1992. doi: 10.1016/0006-8993(92)90906-P. [DOI] [PubMed] [Google Scholar]
- 4.Braver TS, Cohen JD, Nystrom LE, Jonides J, Smith EE, Noll DC. A parametric study of prefrontal cortex involvement in human working memory. Neuroimage 5: 49–62, 1997. doi: 10.1006/nimg.1996.0247. [DOI] [PubMed] [Google Scholar]
- 5.Cao R. The Hemo-Neural Hypothesis: Effects of Vasodilation on Astrocytes in the Mammalian Neocortex (Dissertation) Cambridge, MA: Masssachusetts Institute of Technology, 2011. [Google Scholar]
- 6.Claassen JA, Levine BD, Zhang R. Dynamic cerebral autoregulation during repeated squat-stand maneuvers. J Appl Physiol 106: 153–160, 2009. doi: 10.1152/japplphysiol.90822.2008. [DOI] [PMC free article] [PubMed] [Google Scholar]
- 7.Filosa JA, Iddings JA. Astrocyte regulation of cerebral vascular tone. Am J Physiol Heart Circ Physiol 305: H609–H619, 2013. doi: 10.1152/ajpheart.00359.2013. [DOI] [PMC free article] [PubMed] [Google Scholar]
- 8.Garthwaite G, Bartus K, Malcolm D, Goodwin D, Kollb-Sielecka M, Dooldeniya C, Garthwaite J. Signaling from blood vessels to CNS axons through nitric oxide. J Neurosci 26: 7730–7740, 2006. doi: 10.1523/JNEUROSCI.1528-06.2006. [DOI] [PMC free article] [PubMed] [Google Scholar]
- 9.Hamming RW. Digital Filters. New York: Lucent Technologies, 1989. [Google Scholar]
- 10.Hamner JW, Cohen MA, Mukai S, Lipsitz LA, Taylor JA. Spectral indices of human cerebral blood flow control: responses to augmented blood pressure oscillations. J Physiol 559: 965–973, 2004. doi: 10.1113/jphysiol.2004.066969. [DOI] [PMC free article] [PubMed] [Google Scholar]
- 11.Hamner JW, Morin RJ, Rudolph JL, Taylor JA. Inconsistent link between low-frequency oscillations: R-R interval responses to augmented Mayer waves. J Appl Physiol 90: 1559–1564, 2001. [DOI] [PubMed] [Google Scholar]
- 12.Hamner JW, Tan CO. Relative contributions of sympathetic, cholinergic, and myogenic mechanisms to cerebral autoregulation. Stroke 45: 1771–1777, 2014. doi: 10.1161/STROKEAHA.114.005293. [DOI] [PMC free article] [PubMed] [Google Scholar]
- 13.Harder DR, Alkayed NJ, Lange AR, Gebremedhin D, Roman RJ. Functional hyperemia in the brain: hypothesis for astrocyte-derived vasodilator metabolites. Stroke 29: 229–234, 1998. doi: 10.1161/01.STR.29.1.229. [DOI] [PubMed] [Google Scholar]
- 14.Harris FJ. On the use of windows for harmonic analysis with the discrete Fourier transform. Proc IEEE 66: 51–83, 1978. doi: 10.1109/PROC.1978.10837. [DOI] [Google Scholar]
- 15.Hill RA, Tong L, Yuan P, Murikinati S, Gupta S, Grutzendler J. Regional blood flow in the normal and ischemic brain is controlled by arteriolar smooth muscle cell contractility and not by capillary pericytes. Neuron 87: 95–110, 2015. doi: 10.1016/j.neuron.2015.06.001. [DOI] [PMC free article] [PubMed] [Google Scholar]
- 16.Horwitz A. A version of Simpson’s rule for multiple integrals. J Comput Appl Math 134: 1–11, 2001. doi: 10.1016/S0377-0427(00)00444-1. [DOI] [Google Scholar]
- 17.Kay SM, Marple SL Jr. Spectrum analysis—a modern perspective. Proc IEEE 69: 1380–1419, 1981. doi: 10.1109/PROC.1981.12184. [DOI] [Google Scholar]
- 18.Koehler RC, Gebremedhin D, Harder DR. Role of astrocytes in cerebrovascular regulation. J Appl Physiol 100: 307–317, 2006. doi: 10.1152/japplphysiol.00938.2005. [DOI] [PMC free article] [PubMed] [Google Scholar]
- 19.Koehler RC, Roman RJ, Harder DR. Astrocytes and the regulation of cerebral blood flow. Trends Neurosci 32: 160–169, 2009. doi: 10.1016/j.tins.2008.11.005. [DOI] [PubMed] [Google Scholar]
- 20.Kozlov AS, Angulo MC, Audinat E, Charpak S. Target cell-specific modulation of neuronal activity by astrocytes. Proc Natl Acad Sci USA 103: 10058–10063, 2006. doi: 10.1073/pnas.0603741103. [DOI] [PMC free article] [PubMed] [Google Scholar]
- 21.Lewis NC, Smith KJ, Bain AR, Wildfong KW, Numan T, Ainslie PN. Impact of transient hypotension on regional cerebral blood flow in humans. Clin Sci (Lond) 129: 169–178, 2015. doi: 10.1042/CS20140751. [DOI] [PubMed] [Google Scholar]
- 22.Liu J, Zhu YS, Hill C, Armstrong K, Tarumi T, Hodics T, Hynan LS, Zhang R. Cerebral autoregulation of blood velocity and volumetric flow during steady-state changes in arterial pressure. Hypertension 62: 973–979, 2013. doi: 10.1161/HYPERTENSIONAHA.113.01867. [DOI] [PMC free article] [PubMed] [Google Scholar]
- 23.Matteis M, Caltagirone C, Troisi E, Vernieri F, Monaldo BC, Silvestrini M. Changes in cerebral blood flow induced by passive and active elbow and hand movements. J Neurol 248: 104–108, 2001. doi: 10.1007/s004150170243. [DOI] [PubMed] [Google Scholar]
- 24.Medow MS, Del Pozzi AT, Messer ZR, Terilli C, Stewart JM. Altered oscillatory cerebral blood flow velocity and autoregulation in postural tachycardia syndrome. Front Physiol 5: 234, 2014. doi: 10.3389/fphys.2014.00234. [DOI] [PMC free article] [PubMed] [Google Scholar]
- 25.Montano N, Ruscone TG, Porta A, Lombardi F, Pagani M, Malliani A. Power spectrum analysis of heart rate variability to assess the changes in sympathovagal balance during graded orthostatic tilt. Circulation 90: 1826–1831, 1994. doi: 10.1161/01.CIR.90.4.1826. [DOI] [PubMed] [Google Scholar]
- 26.Moore CI, Cao R. The hemo-neural hypothesis: on the role of blood flow in information processing. J Neurophysiol 99: 2035–2047, 2008. doi: 10.1152/jn.01366.2006. [DOI] [PMC free article] [PubMed] [Google Scholar]
- 27.Müller T, Reinhard M, Oehm E, Hetzel A, Timmer J. Detection of very low-frequency oscillations of cerebral haemodynamics is influenced by data detrending. Med Biol Eng Comput 41: 69–74, 2003. doi: 10.1007/BF02343541. [DOI] [PubMed] [Google Scholar]
- 28.Owen AM, McMillan KM, Laird AR, Bullmore E. N-back working memory paradigm: a meta-analysis of normative functional neuroimaging studies. Hum Brain Mapp 25: 46–59, 2005. doi: 10.1002/hbm.20131. [DOI] [PMC free article] [PubMed] [Google Scholar]
- 29.Raichle ME, Mintun MA. Brain work and brain imaging. Annu Rev Neurosci 29: 449–476, 2006. doi: 10.1146/annurev.neuro.29.051605.112819. [DOI] [PubMed] [Google Scholar]
- 30.Roy CS, Sherrington CS. On the regulation of the blood-supply of the brain. J Physiol 11: 85–158, 1890. doi: 10.1113/jphysiol.1890.sp000321. [DOI] [PMC free article] [PubMed] [Google Scholar]
- 31.Sabri O, Owega A, Schreckenberger M, Sturz L, Fimm B, Kunert P, Meyer PT, Sander D, Klingelhöfer J. A truly simultaneous combination of functional transcranial Doppler sonography and H215O PET adds fundamental new information on differences in cognitive activation between schizophrenics and healthy control subjects. J Nucl Med 44: 671–681, 2003. [PubMed] [Google Scholar]
- 32.Serrador JM, Picot PA, Rutt BK, Shoemaker JK, Bondar RL. MRI measures of middle cerebral artery diameter in conscious humans during simulated orthostasis. Stroke 31: 1672–1678, 2000. doi: 10.1161/01.STR.31.7.1672. [DOI] [PubMed] [Google Scholar]
- 33.Stewart JM, Balakrishnan K, Visintainer P, Del Pozzi AT, Messer ZR, Terilli C, Medow MS. Oscillatory lower body negative pressure impairs task related functional hyperemia in healthy volunteers. Am J Physiol Heart Circ Physiol 310: H775–H784, 2016. doi: 10.1152/ajpheart.00747.2015. [DOI] [PMC free article] [PubMed] [Google Scholar]
- 34.Stewart JM, Del Pozzi AT, Pandey A, Messer ZR, Terilli C, Medow MS. Oscillatory cerebral blood flow is associated with impaired neurocognition and functional hyperemia in postural tachycardia syndrome during graded tilt. Hypertension 65: 636–643, 2015. doi: 10.1161/HYPERTENSIONAHA.114.04576. [DOI] [PMC free article] [PubMed] [Google Scholar]
- 35.Stewart JM, Medow MS, DelPozzi A, Messer ZR, Terilli C, Schwartz CE. Middle cerebral O2 delivery during the modified Oxford maneuver increases with sodium nitroprusside and decreases during phenylephrine. Am J Physiol Heart Circ Physiol 304: H1576–H1583, 2013. doi: 10.1152/ajpheart.00114.2013. [DOI] [PMC free article] [PubMed] [Google Scholar]
- 36.Tan CO, Hamner JW, Taylor JA. The role of myogenic mechanisms in human cerebrovascular regulation. J Physiol 591: 5095–5105, 2013. doi: 10.1113/jphysiol.2013.259747. [DOI] [PMC free article] [PubMed] [Google Scholar]
- 37.van Beek AH, Claassen JA, Rikkert MG, Jansen RW. Cerebral autoregulation: an overview of current concepts and methodology with special focus on the elderly. J Cereb Blood Flow Metab 28: 1071–1085, 2008. doi: 10.1038/jcbfm.2008.13. [DOI] [PubMed] [Google Scholar]
- 38.Xu HL, Mao L, Ye S, Paisansathan C, Vetri F, Pelligrino DA. Astrocytes are a key conduit for upstream signaling of vasodilation during cerebral cortical neuronal activation in vivo. Am J Physiol Heart Circ Physiol 294: H622–H632, 2008. doi: 10.1152/ajpheart.00530.2007. [DOI] [PubMed] [Google Scholar]
- 39.Zhou XH, Gao S. Confidence intervals for the log-normal mean. Stat Med 16: 783–790, 1997. doi:. [DOI] [PubMed] [Google Scholar]
- 40.Zhou XH, Gao S, Hui SL. Methods for comparing the means of two independent log-normal samples. Biometrics 53: 1129–1135, 1997. doi: 10.2307/2533570. [DOI] [PubMed] [Google Scholar]
- 41.Zonta M, Angulo MC, Gobbo S, Rosengarten B, Hossmann KA, Pozzan T, Carmignoto G. Neuron-to-astrocyte signaling is central to the dynamic control of brain microcirculation. Nat Neurosci 6: 43–50, 2003. doi: 10.1038/nn980. [DOI] [PubMed] [Google Scholar]