

We show that calcium/calmodulin-dependent protein kinase II (CaMKII) blockade exacerbates intrinsically lower excitability in the right ventricular outflow tract, which causes highly nonuniform chamber-specific slowing of conduction and facilitates ventricular fibrillation during ischemia. Constitutive CaMKII activity is necessary for uniform and safe ventricular conduction, and CaMKII block is potentially proarrhythmic.
Keywords: calcium/calmodulin-dependent protein kinase II, cardiac conduction, ischemia, right ventricular outflow tract, ventricular fibrillation
Abstract
Calcium/calmodulin-dependent protein kinase II (CaMKII) regulates the principle ion channels mediating cardiac excitability and conduction, but how this regulation translates to the normal and ischemic heart remains unknown. Diverging results on CaMKII regulation of Na+ channels further prevent predicting how CaMKII activity regulates excitability and conduction in the intact heart. To address this deficiency, we tested the effects of the CaMKII blocker KN93 (1 and 2.75 μM) and its inactive analog KN92 (2.75 μM) on conduction and excitability in the left (LV) and right (RV) ventricles of rabbit hearts during normal perfusion and global ischemia. We used optical mapping to determine local conduction delays and the optical action potential (OAP) upstroke velocity (dV/dtmax). At baseline, local conduction delays were similar between RV and LV, whereas the OAP dV/dtmax was lower in RV than in LV. At 2.75 μM, KN93 heterogeneously slowed conduction and reduced dV/dtmax, with the largest effect in the RV outflow tract (RVOT). This effect was further exacerbated by ischemia, leading to recurrent conduction block in the RVOT and early ventricular fibrillation (at 6.7 ± 0.9 vs. 18.2 ± 0.8 min of ischemia in control, P < 0.0001). Neither KN92 nor 1 μM KN93 depressed OAP dV/dtmax or conduction. Rabbit cardiomyocytes isolated from RVOT exhibited a significantly lower dV/dtmax than those isolated from the LV. KN93 (2.75 μM) significantly reduced dV/dtmax in cells from both locations. This led to frequency-dependent intermittent activation failure occurring predominantly in RVOT cells. Thus CaMKII blockade exacerbates intrinsically lower excitability in the RVOT, which is proarrhythmic during ischemia.
NEW & NOTEWORTHY We show that calcium/calmodulin-dependent protein kinase II (CaMKII) blockade exacerbates intrinsically lower excitability in the right ventricular outflow tract, which causes highly nonuniform chamber-specific slowing of conduction and facilitates ventricular fibrillation during ischemia. Constitutive CaMKII activity is necessary for uniform and safe ventricular conduction, and CaMKII block is potentially proarrhythmic.
calcium/calmodulin-dependent protein kinase II (CaMKII) is a serine/threonine-specific protein kinase that is regulated by the Ca2+/calmodulin complex (8, 37). In the absence of Ca2+/calmodulin binding to CaMKII, the enzyme’s conformational configuration self inhibits the catalytic domain of the kinase from interacting with substrates. Upon binding of Ca2+/calmodulin to the enzyme’s regulatory domain, a conformational change renders the enzyme active. Through a posttranslational modification involving autophosphorylation at a threonine residue site (Thr287 in the cardiac-specific type), the enzyme can become autonomous thus no longer requiring the presence of a bound Ca2+/calmodulin complex for catalysis to occur (25). This autonomous active state can be disrupted by the dephosphorylating action of phosphatases (for example, PP2A) upon the phosphorylated Thr287 site, triggering a switch of CaMKII to an inactive state (25). It is therefore likely that a fine balance between phosphorylation and dephosphorylation of Thr287 ultimately regulates the optimal catalytic activity of CaMKII.
CaMKII catalyzes many downstream targets including key ion channels involved in the regulation of cardiac excitability and conduction (6, 42). To date there is significant evidence that CaMKII phosphorylates the pore-forming subunit (Nav1.5) underlying the cardiac Na+ current (INa), the primary determinant of the ventricular cell excitability (2, 4, 21, 26, 43, 49). Other studies point toward a role of CaMKII in the regulation of gap junctions, the principle mediators of cellular electrical communication (20, 32), as well as the inward rectifying potassium channel (IK1) (44). Given the breadth of CaMKII targets on various ionic/molecular components regulating ventricular excitability and conduction, it is not straightforward to predict how the action of CaMKII will regulate conduction of excitation at the intact tissue level. The matter is further complicated because cellular and molecular studies using CaMKII antagonists and transgenic mice overexpressing CaMKII diverge on the physiological consequences of Nav1.5 phosphorylation by CaMKII (2, 43, 49). Whereas one view proposes that CaMKII activation downregulates the fast Na+ current primarily by shifting the steady-state inactivation curve to more hyperpolarized potentials (43), the results from two other laboratories show opposite outcomes consistent with an upregulatory action of CaMKII upon the fast component of INa (2, 49).
Determining how CaMKII regulates excitability and conduction at the level of the whole heart has a broad clinical repercussion given the recent proposal by several groups to consider pharmacological CaMKII blockade as a potential antiarrhythmic strategy (7, 34, 38). The proposed antiarrhythmic benefit of CaMKII blockade is mainly based on the evidence that CaMKII activity is upregulated in heart failure and it can contribute to arrhythmias induced by β-adrenergic receptor-mediated sarcoplasmic reticulum calcium leak (19, 34, 39) and other conditions leading to early afterdepolarizations (EADs) (3, 31) or delayed afterdepolarizations (DADs) (28). However, if CaMKII blockade reduces tissue excitability as may be derived from cellular studies reporting an upregulatory action of CaMKII on INa (2, 49) and on the gap junction protein connexin43 (Cx43) conductance (20, 32), then CaMKII blockade can make conduction less safe, especially under stress conditions when the depolarization reserve is reduced, such as during acute myocardial ischemia or hyperkalemia. It is clear that a successful pharmacological therapy targeting CaMKII requires a full understanding of how CaMKII regulates excitability and conduction in the intact heart, but this is not known.
Thus the goal of this study was to analyze the changes in conduction caused by CaMKII blockade in isolated rabbit hearts during normal perfusion and acute global ischemia using optical mapping of excitation. We found that the CaMKII blocker KN93 caused heterogeneous slowing of conduction at baseline, which was further exacerbated by ischemia. Remarkably, the largest depression of conduction due to CaMKII blockade occurred consistently in the RV outflow tract (RVOT) reminiscent of the Brugada syndrome (40, 50), and an intermittent conduction block in RVOT precipitated ventricular fibrillation (VF) very early in ischemia. These findings suggest that the basal CaMKII activity is necessary for maintenance of safe and uniform conduction in the heart and, conversely, pharmacological blockade of CaMKII bears the risk of creating or unmasking reduced depolarization reserve in RVOT. Part of this study was previously published as an abstract (46).
MATERIALS AND METHODS
The study conformed to the National Institute of Health Guide for the Care and Use of Laboratory Animals (8th ed., 2011) and was approved by the Institutional Animal Care and Use Committee of the University of Utah (Protocol No. 13-11002).
Langendorff-Perfused Rabbit Heart Preparation
Adult New-Zealand white rabbits of either sex (10 male and 11 female; weight: 2.0 to 2.5 kg) were euthanized by pentobarbital sodium (130 mg/kg, iv) mixed with heparin (1 ml, 10,000 USP) to prevent blood clotting. Hearts were rapidly excised, cannulated on a Langendorff apparatus and perfused retrogradely with Tyrode’s solution containing the following (in mM): 130 NaCl, 24 NaHCO3, 1.2 NaH2PO4, 1.0 MgCl2, 5.6 glucose, 4.0 KCl, 1.0 CaCl2, and 0.1 g/l albumin, gassed with an O2/CO2 mixture (adjusted to maintain pH at 7.4) at a fixed rate of 30 ml/min. The mitral valve was disrupted by inserting a drainage tube into the left ventricle (LV) via a small cut in the left atrial appendage to prevent buildup of LV pressure due to venous efflux through Thebesian veins. Hearts were immersed in a Tyrode’s filled chamber and temperature in the right ventricle (RV) cavity and the superfusate was maintained at 37.0 ± 0.5°C. Two pairs of Ag/AgCl custom-designed ball-shaped (2-mm diameter) pacing electrodes were positioned on the epicardial (cathode) and endocardial (anode) surfaces of the lateral LV and RV free walls (see Fig. 1A). The volume-conducted ECG was monitored continuously throughout the experiment.
Fig. 1.
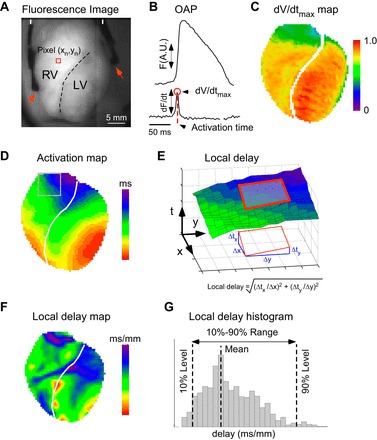
Analysis of ventricular conduction using optical mapping. A: di-4-ANEPPS fluorescence image showing the anterior left (LV) and right (RV) ventricles, demarcated by the anterior descending coronary artery (dashed line). Arrowheads show the position of the LV and RV pacing electrodes placed on lateral epicardial surface of each ventricle. B: di-4-ANEPPS fluorescence (F) recorded from a single pixel (indicated with red square in A) yields optical action potential (OAP; top trace) and its temporal derivative (dF/dt; bottom trace). The maximum value of dF/dt (red circle) is proportional to the maximum upstroke velocity of the true action potential and is denoted dV/dtmax. The red dashed line marks the time of dV/dtmax, which is used as the estimate of activation time in the given pixel. A.U.: arbitrary units. C: in the dV/dtmax map, different colors represent local values of dV/dtmax corrected for heterogeneities in voltage-independent (background) di-4-ANEPPS fluorescence and normalized to the maximum dV/dtmax value observed in the preischemic movie. D: in the activation map, different colors represent the time of local activation (in ms) with respect to the earliest activation detected in the mapped region. E: a diagram explaining computation of local activation delays. The surface plot shown in E corresponds to the portion of activation map shown with gray rectangle in D. In this surface plot the vertical axis represents the activation time as the function of pixel coordinates. The local gradient of activation time was determined from the best-fit plane fitted to the activation time surface in the 5 × 5 pixel vicinity of the given pixel (red rectangle). The magnitude of the activation time gradient is the inverse of the conduction velocity in the direction perpendicular to the activation wavefront and represents the “slowness,” or local delay, of conduction at the given point. F: the local delay map constructed by plotting the color-coded values of local delays (in ms/mm) computed as shown in E. Colors from red to magenta depict areas with increasing conduction delays (or increasing “slowness” of conduction) G: histograms of the local delays were constructed separately for the RV and the LV. The mean value and the 10–90% range were extracted from the histograms for statistical comparisons between different experimental groups.
All hearts were subject to an initial 45- to 55-min period of normoxic perfusion during which procedures in preparation for optical mapping as well as group-specific procedures related to the perfusion of the drug of interest were carried out (see below for details). Following this period of time, global ischemia was initiated by cessation of aortic perfusion and maintained for 30 min (16). During global ischemia, the superfusate was maintained at 37.0 ± 0.5°C and the oxygen pressure in the solution maintained below 30 mmHg by gassing the superfusion solution with a N2/CO2 mixture (adjusted to maintain pH at 7.4).
Simultaneous pacing of the LV and the RV at a constant cycle length of 300 ms was initiated 1–2 min before the initiation of global ischemia in all hearts and continued throughout the ischemic episode. The stimulus current was initially set at three times preischemic threshold and was increased up to 10 mA if 1:1 capture at the initial setting failed during ischemia due to progressive loss of excitability. Ventricular pacing was maintained even after the onset of ischemic VF.
Optical Mapping Experimental Groups
A total of four optical mapping experimental groups were used in this study. The following drugs were used: KN93, CaMKII blocker (Calbiochem); and KN92, the inactive analog of KN93 (Calbiochem). KN93 and KN92 were delivered at 10 times target concentration through a syringe pump connected to the perfusion line for 30 min before ischemia. The syringe pump and the main perfusion pump were set at the rates of 3 and 27 ml/min, respectively, enabling in-line mixing at 1:10 dilution of the delivered drugs. In the Control group (n = 5), no drugs were used. In the Low_KN93 group (n = 5), the hearts were treated with KN93 at a final concentration of 1 μM. In the High_KN93 group (n = 6), the hearts were treated with KN93 at a final concentration of 2.75 μM. In the High_KN92 group (n = 5), the hearts were treated with KN92 at a final concentration of 2.75 μM.
Optical Mapping
Optical mapping was performed essentially as described in our previous publication (16). Briefly, the hearts were fully immersed in Tyrode’s solution inside the imaging chamber to maintain the temperature in the physiological range (36.5–37.5°C) both during normoxic perfusion and during no-flow global ischemia. The hearts were stained with the voltage-sensitive dye di-4-ANEPPS. The anterior aspects of the RV and the LV (Fig. 1A) were imaged using an EMCCD camera iXon DU-860D (Andor Technology, Belfast, UK) with a 6-mm objective lens, at a resolution of 64 × 64 pixels (0.5 mm/pixel) and a frame interval of 2.06 ms. The voltage sensitive dye was excited by a 532-nm laser and emitted fluorescence was collected using a 600 ± 40 nm bandpass filter. To reduce the contractile motion the heart was gently restrained by means of pieces of gauze placed on the lateral walls and the apex. In all experimental groups we recorded two 6-s-long movies of fluorescence 1–2 min before ischemia (one during sinus rhythm and one after the initiation of ventricular pacing, respectively) and movies at each minute from 0 to 30 min of ischemia. All data reported in this study were obtained from the movies of fluorescence acquired during pacing. The 0-min ischemic movie was acquired at 10–15 s after interruption of the aortic flow. Two ambient light movies were recorded at a resolution of 0.25 mm/pixel before and after ischemia for precise demarcation of the boundary between the RV and the LV based on the position of the left ascending coronary artery (LAD). Data acquisition was performed using a custom software package written in Java and using libraries from Micro-Manager open source microscopy software (Vale Laboratory, University of California in San Francisco, San Francisco, CA) and NetBeans open source program development framework (netbeans.org, Oracle, Redwood City, CA).
Processing and Analysis of Optical Mapping Data
The individual fluorescent signals from each recorded pixel were first background-subtracted, inverted, and filtered in time and space (Fig. 1B, top trace) as described previously (16). This yielded a movie of fluorescence reflecting the spatiotemporal distribution of the optical action potential (OAP).
dV/dtmax.
For each pixel and each OAP, we computed the values of the maximum upstroke velocity (dV/dtmax) as described previously (16). Briefly, the dV/dtmax values that were averaged over all activations in a given pixel and corrected for nonuniformities in the background di-4-ANEPPS fluorescence, and normalized to the maximum preischemic value, were color coded and projected on the images of the RV and the LV to generate dV/dtmax maps (Fig. 1C). For chamber-wise comparisons between groups, the average dV/dtmax values for the RV and the LV were computed for each movie and normalized to the average LV dV/dtmax in the preischemic paced movie.
Analysis of activation sequence and local delays.
For each OAP in each pixel we defined the activation time as the time of dV/dtmax (Fig. 1B). For each paced activation captured in a fluorescence movie we computed the local activation time and then color-coded and projected the result on to each pixel of the imaged area to generate an activation map (Fig. 1D). The local delay of activation in a given pixel was computed as the magnitude of the local gradient of activation time, as explained in Fig. 1E. The local delay is the inverse of conduction velocity in the direction perpendicular to the activation wavefront and is presented in units of ms/mm. For each activation, computation and color coding of the local delay for each pixel generated a local delay map (Fig. 1F). We computed delay histograms separately for the RV and the LV (Fig. 1G) and used the 10–90% range of the histogram as the estimator of the heterogeneity of conduction in each chamber.
Myocyte Isolation
Adult ventricular myocytes were isolated from hearts of adult New Zealand white rabbits (2 male and 7 female; weight: 2.0 to 2.5 kg) as previously described (48). In brief, animals were first anesthetized with sodium pentobarbital (130 mg/kg, iv). The heart was then excised and attached to an aortic cannula through which solutions (gassed with 100% O2, held at 37°C, and with a pH of 7.3) were perfused. Initial perfusion with a 0 mM Ca2+ solution for 5 min was followed by a 8- to 14-min period of perfusion with the same solution containing 0.034–0.067 mg/ml collagenase P (Roche Diagnostics), 0.05 mg/ml protease (type XIV; Sigma-Aldrich), and 0.1 mM CaCl2. The heart was then perfused for 5 min with the same solution containing no enzymes and 0.1 mM CaCl2. Tissue samples from the LV free wall and from the RVOT region (transmural basally located RV tissue within ~3 mm of the pulmonary artery ventricular junction) were separately minced and shaken for 10 min and then filtered through a nylon mesh. Cells were stored at room temperature in normal HEPES-buffered solution. The myocytes used in this study were rod-shaped, had well-defined striations, and did not spontaneously contract. Experiments were performed within 5 h of cell isolation.
Isolated Cell Chamber and Experimental Solutions
Myocytes were placed in a small 1-ml flow-through chamber mounted on the stage of an inverted microscope. The coverslip on the bottom of the chamber was coated with poly-l-lysine to enhance cellular adhesion. Bathing solutions flowed continuously through the bath at ~4–5 ml/min, and solution depth was held at ~2–3 mm. Exchange of the bath solution required ~10 s. The control bathing solution was a HEPES-buffered Tyrode’s solution containing the following (in mM): 126.0 NaCl, 4.4 KCL, 1.0 MgCl2, 1.1 CaCl2, 11.0 dextrose, and 24.0 HEPES (free acid) titrated to pH 7.40 with NaOH. The KN93 test solution was prepared by adding KN93 (Calbiochem) to the control Tyrode’s solution to achieve a final concentration of the drug of 2.75 μM. The temperature of the solutions in the bath was maintained at 36.0 ± 1.0°C. Pipette filling solutions contained the following (in mM): 5.0 NaCl, 110.0 KCl, 5.0 MgATP, 5.0 phosphocreatine, 1.0 NaGTP, and 10.0 HEPES titrated to pH 7.2 with 1 M KOH.
Isolated Cell Electrophysiology Measurements
Transmembrane voltage.
The whole cell transmembrane action potential (AP) was measured by means of suction borosilicate glass pipettes (tip resistance ranging between 1 and 2 MΩ) and an Axoclamp 2B amplifier (Axon Instruments/Molecular Devices) in bridge mode as previously described (47). Once rupture of the membrane patch was achieved, APs were initiated by intracellular current injection and the resulting transmembrane voltage (Vm) changes recorded continuously by means of AxoScope software (Axon instruments/Molecular Devices) at a sampling rate of 50 kHz. The rectangular shaped stimulus current pulses (Istim) delivered at the test cycle length (CL) were 3–4 ms in duration. The current magnitude was set above the activation threshold current (Ithresh), determined for each cell upon patch formation, such that Istim/Ithresh was in average 1.13 ± 0.03 (group-wise differences in this value were not significant).
Experimental procedure and pacing protocols.
Data was obtained from 21 myocytes: 10 from the RVOT samples of 5 hearts (RVOT group); 11 from the LV samples of 7 hearts (LV group). Once the membrane patch and cellular activation was established, the myocytes were continuously paced at a constant CL of 1,000 ms. Myocytes were then perfused with the control solution for 4 min, followed by perfusion with 2.75 μM KN93 containing solution for 7 min, and perfused again with control solution to washout the drug thereafter. At minutes 3 and 5 of perfusion with control and KN93 solutions, respectively, myocytes were transiently subject to rapid pacing by changing the CL from 1,000 ms to 360 ms for a 30 s interval. Additionally, 30 s before rapid pacing initiation, 10–20 hyperpolarizing current pulses (0.04–0.24 nA) were applied at the test CL during consecutive diastolic intervals to determine membrane resistance (Rm) of each cell before and after perfusion with the drug.
AP Parameters
To calculate the physiological parameters describing each recorded AP we first computed the temporal derivative of the recorded Vm signal (dVm/dt). We then used the Vm and dVm/dt signals to determine for each activation cycle (i.e., the time between consecutive stimulus pulses), referred to herein as “activation cycle j”, the following: 1) the resting membrane potential (Vr) defined as the Vm value immediately preceding the initiation of the stimulus current; 2) the AP upstroke velocity defined as the maximal value of dVm/dt (dVm/dtmax) in units of V/s; 3) the AP activation time defined as the absolute time at which dVm/dtmax occurred; 4) the AP amplitude defined as the maximal voltage excursion of Vm with respect to Vr; 5) the AP duration at 90% repolarization (APD90) defined as the time interval between the AP activation time and the time at which the repolarizing Vm signal attained 90% of the AP amplitude; and 6) the diastolic interval (DI) defined as the time interval between the time at which the repolarizing Vm signal attained 90% of the AP amplitude in a given activation cycle j-1, and the activation time of an AP in the consecutive activation cycle j. Additionally, in the instances where the hyperpolarizing stimulus current (Ihyp) was applied to the cell membrane, we determined the amplitude of the resulting hyperpolarizing voltage deflection (Vhyp) to calculate the membrane resistance using the formula Rm = Vhyp/Ihyp.
Reported AP parameter values corresponding to the 1,000-ms test CL were calculated by averaging the parameter values of 10 sequential APs immediately preceding the rapid pacing interval. AP parameter values corresponding to the 360-ms test CL were calculated by averaging the parameter values of three sequential APs immediately preceding the switch back to the slower 1,000-ms test CL. Given the apparent rate dependency of dVm/dtmax during perfusion with KN93, cases in which the rhythm was transformed during rapid pacing (i.e., no 1:1 activation) were excluded from the pool of data used to calculate AP parameters at 360-ms CL.
Statistical Analysis
The optical mapping part of this study has a complex set of outcomes influenced by at least three independent factors: the intervention (the presence or absence of different drugs); the heart chamber (RV vs. LV); and the perfusion condition (normal perfusion vs. ischemia). The straightforward approach would be to use three-way ANOVA and analyze all the interactions between three factors. It would be difficult, however, to interpret outcomes in physiologically meaningful way. Therefore, we performed two-way ANOVA with factors of drug and the ventricular chamber separately for preischemia and 4 min of ischemia. One-way ANOVA was used to compare the time of ischemic VF initiation in different drug groups. Two-way ANOVA was used for analysis of dVm/dtmax in isolated cardiomyocytes. The exact Fisher’s test was used to compare the incidence of 1:1 activation failure in cardiac myocytes subjected to rapid pacing in the presence of KN93. Tests were performed using XLSTAT (Addinsoft, https://www.xlstat.com/) and MATLAB Statistics Toolbox (MathWorks version 9.0). Specific post hoc tests are indicated with the presentation of respective results. Data are given as means ± SE. Differences of P < 0.05 were considered statistically significant.
RESULTS
CaMKII Blockade Causes Conduction Slowing in Ventricles, Especially in the RVOT
Perfusing the heart with the CaMKII blocker KN93 had a profound chamber-specific effect on conduction of excitation through the ventricles. Figure 2 shows representative examples of activation and the local conduction delay maps in a Control and a High_KN93 experiment. Activation and local conduction delay maps in High_KN92 and Low_KN93 groups were very similar to those in the Control group and are not shown here.
Fig. 2.
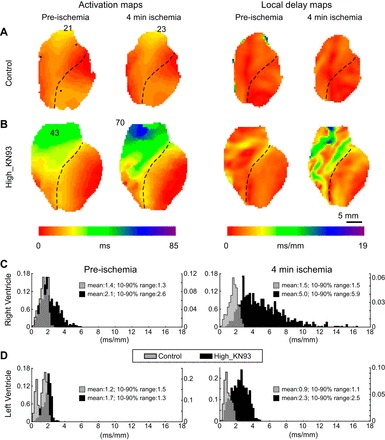
Effect of KN93 on ventricular activation and local delays in normally perfused and ischemic hearts. A and B: representative experiments from the Control and High_KN93 series, respectively. Two leftmost columns: activation maps before ischemia and at 4 min of ischemia, respectively. Two rightmost columns: local delay maps before ischemia and at 4 min of ischemia, respectively. The numbers on the activation maps indicate the total time from the earliest to the latest activation (in ms). Histograms of local delay distribution (RV vs. LV) derived from the local delay maps shown in A and B are depicted in C (gray for Control and black for High_KN93). Rows (top to bottom) represent chambers (RV vs. LV), whereas columns (left to right) represent time points (preischemia vs. 4 min of ischemia). The values of the mean and 10–90% range of distribution are indicated with respective colors for each histogram.
In Control, the propagation in both the RV and the LV was fast and uniform both before and at 4 min of ischemia, so that the waves originating from the RV and the LV pacing electrodes spread in an approximately symmetric fashion, colliding at or near the interventricular septum (see the two leftmost maps in Fig. 2A). The site of the latest activation was at the very top of the RVOT, and the total activation time was almost identical at preischemia and 4 min of ischemia: 21 and 23 ms, respectively. Accordingly, the local delay maps (the two rightmost maps in Fig. 2A) show a smooth distribution of delays (all within 2–3 ms/mm) over the entire mapped area, with little difference between preischemia and 4 min of ischemia.
Figure 2B shows a representative example from the High_KN93 group. One can see that the effect of KN93 (if compared with Control) has several striking aspects: 1) overall slowing of conduction in both chambers; 2) enhanced slowing of conduction in the basal anterior RV, roughly corresponding to the RVOT; and 3) exaggerated effect in the RVOT at 4 min of ischemia. Before ischemia, the latest activation time in the High_KN93 group is increased by ~100% as compared with the preischemic time point in Control. At 4 min of ischemia, the latest activation time in the High_KN93 group is increased by ~200% as compared with the ischemic time point in Control (compare activation maps in Fig. 2, A and B). The local conduction delay maps in Fig. 2B reveal the highly heterogeneous nature of the KN93 effect in the RV. Whereas in many RV locations the delays are within the range of those observed in Control (1–3 ms/mm), in some RV locations the delays are far beyond the control range. Specifically, the longest local delay in the RV before ischemia is 5.7 ms/mm and at 4 min of ischemia is 16.2 ms/mm.
Figure 2, C and D, depicts the histograms of local delay distribution generated from the local delay maps shown in Fig. 2, A and B. The histograms help to reveal a complex nature of CaMKII blockade effect. Before ischemia, in both chambers KN93 causes a shift of the distribution towards longer conduction delays (compare black and gray plots). However, the range (10–90%) of the distribution is prominently increased in the RV (2-fold the spread in the Control RV) but not in the LV. The heterogeneous effect of KN93 is clearly exaggerated at 4 min of ischemia, yielding in this case a fourfold increase in the RV range of local delays as compared with the ischemic RV value from the Control heart (black vs. gray in Fig. 2C), but a much more modest (2.3-fold) increase in the distribution range in the LV (black vs. gray in Fig. 2D).
Figure 3 summarizes the statistical analysis of the mean and the 10–90% range of local delays in all groups. Among all interventions, only the high concentration of KN93 (2.75 μM, High_KN93 group) caused a significant increase in both mean delay and the range of delays. This effect was significant in both ventricular chambers and at both normoxic and ischemic conditions. Notably, the effects of the high KN93 concentration were much more pronounced in the RV than in the LV. Specifically, high KN93 led to statistically significant interchamber difference in mean delay and the range of delays both before ischemia and at 4 min of ischemia, not present in Control. Lastly, ischemia exacerbated the effect of high KN93 concentration, further increasing both intrachamber and interchamber differences in local delays. Specifically, the combined effect of high KN93 and ischemia increased the range of local delays by more than 2.5-fold in the LV and by more than 6-fold in the RV (see Fig. 3, C and D).
Fig. 3.
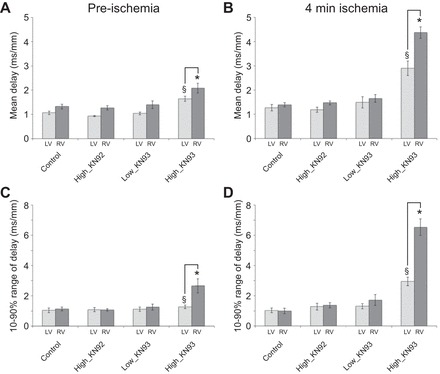
Statistical analysis of local delay distribution in all experimental groups. The LV data are shown in light gray, and the RV data are shown in dark gray. Rows (top to bottom) show the group-wise average values of the mean and 10–90% range of the chamber-specific local delay distribution, respectively. Columns (left to right) show data obtained before ischemia and at 4 min of ischemia, respectively. Two-way ANOVA analysis with REGWQ post hoc test was performed separately for each A to D. Values represent means ± SE; n = 5 in each of the Control, High_KN92, and Low_KN93 groups and n = 6 in the High_KN93 group. *P < 0.05 vs. Control RV (at the same time point); §P < 0.05 vs. Control LV (at the same time point). Solid brackets, P < 0.05 LV vs. RV in the same group and at the same time point.
CaMKII Blockade Causes Heterogeneous Decrease in dV/dtmax
Heterogeneous slowing of conduction velocity resulting from CaMKII blockade can be due to reduced membrane excitability and/or reduced intercellular coupling in the affected regions, since CaMKII regulates both pore-forming subunits of Na channel Nav1.5 (2, 4, 21, 26, 43, 49) and gap junctional proteins Cx43 (20, 32). If the slow conduction were due to reduced excitability (mostly determined by the availability of sodium channels), then we would expect that the regions with slower conduction have slower upstroke velocity of the AP (lower dV/dtmax) than the regions with faster (less affected) conduction (35). We analyzed spatial distribution of the dV/dtmax values derived from OAPs as a surrogate of the cellular dV/dtmax. Note that the absolute calibration of the optically derived dV/dtmax in terms of V/s cannot be reliably achieved; hence, all local values in each heart were normalized to the maximum preischemic value (see materials and methods).
Figure 4 shows the distribution of OAP dV/dtmax maps in representative experiments from the Control and High_KN93 groups (the same experiments as shown in Fig. 2). One can see that in both groups the higher dV/dtmax values were predominantly located in the LV rather than in the RV, both before ischemia and at 4 min of ischemia. Ischemia reduced the dV/dtmax in both groups in comparison to preischemia. Additionally, the largest depression of dV/dtmax during ischemia occurred in the High_KN93 experiment in which most RV pixels have values around 25% of the preischemic LV dV/dtmax.
Fig. 4.
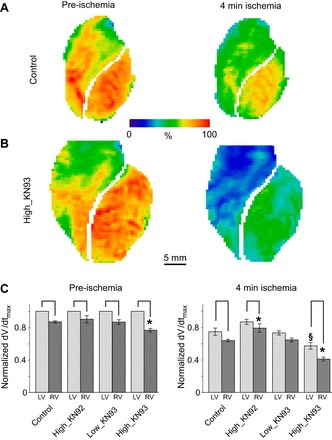
Effect of KN93 on the optical action potential (OAP) dV/dtmax distribution in normally perfused and ischemic hearts. A and B: representative experiments from the Control and the High_KN93 series, respectively (the same experiments as shown in Fig. 2). Columns (left to right) show the dV/dtmax maps before ischemia and at 4 min of ischemia, respectively. In these maps, the values of dV/dtmax are normalized to the maximum preischemic value (always found in the LV) in the same experiment. C: group-wise comparisons of the average RV and LV dV/dtmax values (normalized to the average preischemic LV value) before ischemia (left) and after 4 min of ischemia (right). Two-way ANOVA analysis with the Tukey-Kramer post hoc test was performed separately for preischemic and ischemic data. Values represent means ± SE; n = 5 in each of the Control, High_KN92, and Low_KN93 groups and n = 6 in the High_KN93 group. *P < 0.05 vs. Control RV (at the same time point); §P < 0.05 vs. Control LV (at the same time point). Solid brackets, P < 0.05 LV vs. RV in the same group and at the same time point.
Figure 4C summarizes statistical analysis of the OAP dV/dtmax in all groups before ischemia (Fig. 4C, left) and at 4 min of ischemia (Fig. 4C, right). Since dV/dtmax values in all chambers and at all time points were normalized to the LV value observed before ischemia (see materials and methods), the effects of drugs on the preischemic LV dV/dtmax values could not be established. Nevertheless, we could assess interchamber differences as well as interactions between drug and ischemia in each chamber. Before ischemia (Fig. 4C, left), all four groups exhibited significant RV-to-LV difference in dV/dtmax, which was enhanced in the High_KN93 group (0.77 ± 0.02 vs. 0.87 ± 0.01 of the LV value in Control, P < 0.05). At 4 min of ischemia (Fig. 4C, right), dV/dtmax values retained significant LV-to-RV difference in all groups but the Low_KN93. Also, during ischemia both the LV and the RV dV/dtmax values in the High_KN93 group were significantly lower than the respective values in Control (LV: 0.57 ± 0.04 vs. 0.75 ± 0.05, P < 0.05; RV: 0.41 ± 0.02 vs. 0.64 ± 0.01, P < 0.05). Interestingly, during ischemia KN92 exerted an effect opposite to that of KN93 applied at the same concentration (2.75 μM). Namely, KN92 antagonized, whereas KN93 enhanced, the decrease in dV/dtmax induced by ischemia.
CaMKII Block and Ischemic Arrhythmogenesis
During ischemia, CaMKII blockade was often associated with the early development of conduction abnormalities and initiation of VF. Specific to High_KN93 group was alternans of conduction velocity, AP amplitude and the AP upstroke velocity occurring in the first minutes of ischemia. Figure 5, A and B, shows representative cases from the Control and High_KN93 groups, respectively. In the Control experiment (Fig. 5A), the activation patterns and the shapes of OAPs at selected locations (labeled a, b, and c) remained the same in consecutive beats, both preischemia and at 4 min of ischemia. In the High_KN93 experiment (Fig. 5B), before ischemia the activation maps and individual OAPs also show the lack of beat-to-beat variation, despite the marked slowing of conduction in the RVOT (Fig. 5B, top row). However, at 4 min of ischemia, conduction slowing occurring prominently in the RVOT is now associated to a beat-to-beat change in activation pattern (Fig. 5B, bottom row). Specifically, a highly localized region of very slow conduction (red pixels) occurs every other beat in the RVOT. Accordingly, OAPs from pixel a located in the RVOT show 2:1 fluctuations (alternans) in the AP amplitude and the AP upstroke velocity (see Fig. 8B, red arrows). Such alternans are faintly visible in pixel b situated close to the junction of RVOT and the LV but are fully absent in pixel c situated in the LV apex.
Fig. 5.
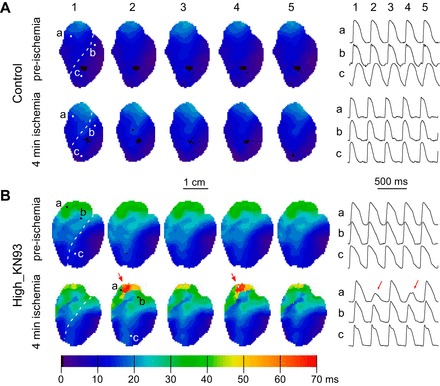
CaMKII block by KN93 promotes 2:1 conduction patterns in the RV outflow tract (RVOT) during early ischemia. Data are from a representative Control heart (A) and a High_KN93 heart (B). In both A and B, the top and the bottom represent preischemia and 4 min of ischemia, respectively. Left: activation maps from 5 consecutive beats (1-5). Right: OAP recordings from selected pixels (a−c) whose position is indicated in the activation maps. Numeric labels above the OAPs indicate the correspondence to each activation map. Red arrows in B highlight the beat-to-beat fluctuations (alternans) occurring in the RVOT of the High_KN93 heart at 4 min of ischemia.
Fig. 8.
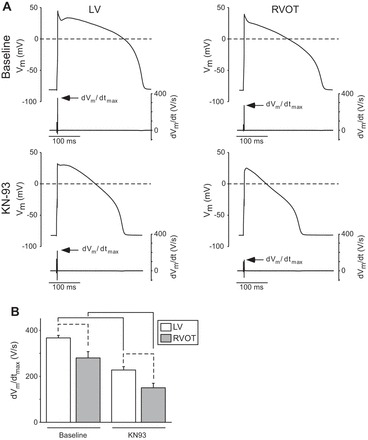
The effect of KN93 on dVm/dtmax of rabbit cardiomyocytes isolated from the RVOT and the LV. A: representative recordings from cells located in the LV (left) and RVOT (right) at baseline (top row) and after perfusion with KN93 (bottom row). Each panel shows the action potential (top trace) and the corresponding temporal derivative (dVm/dt, bottom trace). Arrows point to the maximum value of the derivative (dVm/dtmax). B: means ± SE values of dVm/dtmax in the LV (white) and RVOT (gray) at baseline and after KN93. Data are from 10 RVOT myocytes (5 hearts) and 11 LV myocytes (7 hearts). Two-way ANOVA with the Tukey-Kramer post hoc test were used to determine statistical significance of difference between means. Solid brackets indicate significant differences induced by KN93 in cells from the same location. Dashed brackets indicate significant differences between cells from different locations under the same experimental condition.
Patterns including 2:1 conduction changes or conduction block occurred in all (6/6) High_KN93 hearts (between 3 and 6 min of ischemia) but none (0/5) of the Control hearts. In four out of six cases the earliest signs of conduction alternans or block were observed in the RV base roughly corresponding to RVOT; in two out of six cases conduction abnormalities were observed first in the LV but were followed by conduction abnormalities in the RV base within 1 min.
The crescendo in abnormal conduction events observed in the High_KN93 group culminated in the initiation of VF at much earlier time of ischemia than in the Control group (6.7 ± 0.9 min vs. 18.2 ± 0.8 min in Control; P < 0.0001; see Fig. 6). This detrimental effect was not present in the High_KN92 group (21.2 ± 1.2 min) or in the Low_KN93 group (15.2 ± 2.0 min).
Fig. 6.
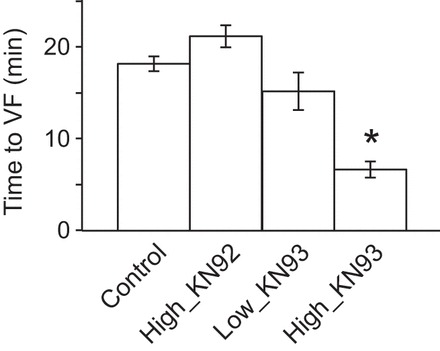
CaMKII block by KN93 promotes ventricular fibrillation (VF) initiation during ischemia. The bar plot depicts the mean time to VF for each experimental group. Values represent means ± SE; n = 5 in each of the Control, High_KN92, and Low_KN93 groups and n = 6 in the High_KN93 group. *P < 0.05 vs. control, one-way ANOVA and the Bonferroni post hoc test.
KN93 also markedly reduced both the activation rate and the degree of periodicity during ischemic VF. Figure 7 shows examples from the Control and High_KN93 groups. In the Control experiment (Fig. 7A, top), the dominant frequency (DF) of excitation was in the range of 5–12 Hz vs. 1–4 Hz observed in the High_KN93 experiment (Fig. 7A, bottom). Figure 7B shows the time–space plots along the pixel lines x–x′ indicated in the respective Control and High_KN93 DF maps in Fig. 7A. In the Control experiment (Fig. 7B, left), a highly periodic activity could be seen in the RV and part of the LV. In fact, a stable “mother rotor” was present in the RV throughout the entire recording in this experiment (not shown). In contrast, in the High_KN93 experiment (Fig. 7B, right), neither RV nor LV exhibited any locations with highly periodic activity. Figure 7C shows single pixel OAP recordings from RV locations in the Control and High_KN93 experiments identified by a red/white square in the respective DF maps depicted in Fig. 7A. The OAP recordings further reinforce the notion that KN93 markedly reduced the frequency and periodicity of activations during ischemic VF. No stable reentrant activity during ischemic VF was observed in High_KN93 group (not shown).
Fig. 7.
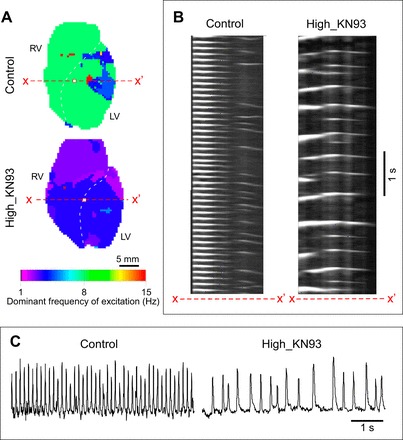
CaMKII block by KN93 is associated with slow and aperiodic dynamics of ischemic ventricular fibrillation (VF). A: the dominant frequency (DF) map of a VF episode in a Control (top) and High_KN93 (bottom) experiment. B: time space plots (TSP) of excitation in the Control (left) and High_KN93 (right) experiments constructed for the selected rows of pixels x–x′ depicted in the respective maps in A. C: single pixel recordings from Control (left) and High_KN93 (right) hearts (pixel locations are denoted with white squares in the respective maps in A).
CaMKII Blockade Causes Heterogeneous Decrease in the dVm/dtmax in Isolated Cardiomyocytes
To further understand the origin of chamber-specific conduction differences elicited by CaMKII block with KN93 (2.75 μM), we investigated how 2.75 μM KN93 altered the AP recorded from single cardiomyocytes isolated from the LV and RVOT regions of the rabbit hearts. Figure 8A shows representative AP recordings and their respective time derivatives (dVm/dt) from an LV (left) and an RVOT (right) myocyte paced at the cycle length of 1,000 ms before (top row) and after (bottom row) administration of KN93. Note that even in the absence of the drug the maximum upstroke velocity (dVm/dtmax) is lower in the myocyte from the RVOT than in the one from the LV. The recordings obtained from the same RVOT and LV myocytes after 5 min of KN93 perfusion (Fig. 8A, bottom row) show that KN93 markedly reduced the dVm/dtmax in each cell, retaining however the difference (LV > RVOT) in the values of dVm/dtmax.
Figure 8B shows statistical analysis of the dVm/dtmax in single myocytes paced at the CL of 1,000 ms. At baseline, the upstroke velocity in the RVOT cells was 76% of the value measured in the LV cells. KN93 reduced dVm/dtmax by 38% in the LV cells and by 47% in the RVOT cells, slightly enhancing the RVOT-LV difference (34% in the presence of KN93 vs. 24% in the absence of KN93). Two-way ANOVA indicated a significant effect of both the location (LV vs. RVOT) and the drug (KN93) on the dVm/dtmax.
CaMKII Block Markedly Alters the Rate Adaptation of dVm/dtmax in the RVOT
Figure 9A shows the beat-by-beat changes in dVm/dtmax during an abrupt change of the CL from 1,000 to 360 ms in a representative LV (black traces) and an RVOT (gray traces) myocyte. Each trace follows the dVm/dtmax evolution during the final beats before the rate change and during the initial beats after the change, both in baseline conditions (Fig. 9A, solid lines) and after perfusion with KN93 (Fig. 9A, dashed lines). At baseline, dVm/dtmax changed very little during the rate transition in both the LV and the RVOT cell. In contrast, repetition of the maneuver after perfusion with KN93 resulted in a prominent and fast dVm/dtmax reduction upon an abrupt shortening of the pacing CL in both cells.
Fig. 9.
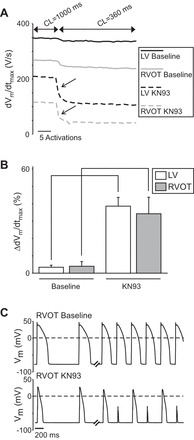
Effects of abrupt increase in pacing rate on the dVm/dtmax of isolated cardiomyocytes in the absence and in the presence of KN93. A: plot depicting the beat-to-beat evolution of dVm/dtmax during an abrupt change in cycle length from 1,000 to 360 ms in representative cells from the LV (black) and RVOT (gray) at baseline (solid line) and after perfusion with KN93 (dashed line). Tilted arrows point to the abrupt and prominent reduction in dVm/dtmax elicited by the change in rate, occurring only during perfusion with KN93. B: statistical analysis of the percent change of decrease in dVm/dtmax (ΔdVm/dtmax) in response to the abrupt rate increase in LV (white) and RVOT (gray) cells before and after perfusion with KN93. Values represent means ± SE; data from 5 RVOT myocytes (5 hearts) and 10 LV myocytes (5 hearts). Two-way ANOVA and the Tukey-Kramer post hoc test were used to determine differences between means. Solid brackets indicate significant differences induced by KN93 in the same cell type. C: An example of 2:1 activation failure, which occurred in an RVOT cell after an abrupt change in rate in the presence (bottom trace) but not in the absence (top trace) of KN93.
Figure 9B show s statistical analysis of dVm/dtmax changes (ΔdVm/dtmax) in response to the abrupt CL change (expressed as the percentage of the dVm/dtmax values before the rate change) in all studied RVOT and LV myocytes. At baseline, the decrease in dVm/dtmax due to the rate change was barely noticeable (~3% in both locations). However, in the presence of KN93 the reduction of dVm/dtmax in response to the rate change was very prominent (34.3% in the RVOT and 38.6% in the LV; both P < 0.05). No regional differences in ΔdVm/dtmax either at baseline or after KN93 were detected.
Interestingly, in some cells the abrupt shortening of the CL during KN93 perfusion led to a failure of activation in a 1:1 manner. Figure 9C shows an example RVOT myocyte in which the rate transition bore no detrimental consequence on the efficient 1:1 activation at baseline (top trace), yet after perfusion with KN93 the rate transition compromised the effective AP formation leading to a 2:1 activation pattern (bottom traces). This phenomenon tended to occur more often in the myocytes isolated from the RVOT than those isolated from the LV (5/10 vs. 1/11, respectively; P = 0.06 by exact Fisher’s test).
Table 1 summarizes the statistical analysis of all quantified AP parameters. Apart from dVmdtmax and ΔdVm/dtmax, these include Vr, APD90, and Rm. Neither cell location nor KN93 treatment had a significant effect on Vr. Considering the main effects of the two factors (the location and the drug), two-way ANOVA revealed a significant effect of KN93 on APD90 (reduction by the drug) and a significant effect of location on Rm (LV < RVOT). There was no significant interaction between the location and the drug in their effects on any of the measured AP parameters.
Table 1.
Action potential parameters in isolated cardiomyocytes from the LV and RVOT of the rabbit heart
| Factor of Location |
Factor of Drug |
Interaction |
Pairwise Comparisons (Tukey-Kramer test) |
||||||||
|---|---|---|---|---|---|---|---|---|---|---|---|
| Baseline |
KN93 |
Baseline | KN93 | LV | RVOT | ||||||
| Parameter | LV | RVOT | LV | RVOT | P value RVOT vs. LV | P value baseline vs. KN93 | P value location × drug | P value LV vs. RVOT | P value LV vs. RVOT | P value baseline vs. KN93 | P value baseline vs. KN93 |
| dVm/dtmax, V/s | 367 ± 13 | 280 ± 29 | 228 ± 16 | 150 ± 21 | 0.0002 | <0.0001 | 0.8122 | 0.021 | 0.047 | 0.0001 | 0.0004 |
| ΔdVm/dtmax, % | 3.4 ± 1.4 | 4.0 ± 2.7 | 38.6 ± 5.2 | 34.3 ± 8.8 | 0.7081 | <0.0001 | 0.6253 | 0.999 | 0.926 | <0.0001 | 0.0033 |
| Vr, mV | −79.6 ± 0.6 | −78.1 ± 1.1 | −79.4 ± 0.7 | −76.4 ± 1.8 | 0.0507 | 0.4148 | 0.5007 | 0.78 | 0.242 | 0.9996 | 0.73 |
| APD90, ms | 255 ± 35 | 215 ± 18 | 175 ± 26 | 148 ± 17 | 0.1974 | 0.0059 | 0.8069 | 0.691 | 0.875 | 0.1174 | 0.2678 |
| Rm, MΩ | 15 ± 1 | 24 ± 3 | 20 ± 2 | 28 ± 3 | 0.0014 | 0.0547 | 0.9695 | 0.08 | 0.09 | 0.469 | 0.542 |
Data are given as means ± SE. Two-way ANOVA with the Tukey-Kramer post hoc test is used to determine statistical significance of difference between means. RVOT, right ventricular outflow tract; LV, left ventricle; dVm/dtmax, maximal temporal derivative of the recorded membrane potential (Vm) signal; Vr, resting membrane potential; APD90, action potential duration at 90% repolarization Rm, membrane resistance.
DISCUSSION
This study demonstrates that CaMKII is a major regulator of conduction in the intact heart. We showed that blockade of CaMKII with KN93 leads to nonuniform depression of conduction that is most prominent in the RVOT and this effect is concentration dependent. Additionally, global ischemia enhanced KN93-induced nonuniform depression of conduction, which eventually led to prominent and predictable conduction abnormalities (2:1 patterns of conduction block) originating in the most vulnerable region located at the RVOT. The conduction abnormalities become precursors of turbulent conduction leading to the early onset of VF. RVOT increased vulnerability to slow conduction and block is associated with an inherently reduced excitability of this region (i.e., reduced upstroke during phase 0 of the AP), which upon block of CaMKII leads to a lower depolarization reserve and increased vulnerability to activation failure.
Cardiac Conduction Is Constitutively Regulated by CaMKII
Recent studies showed that phosphorylated CaMKII is present in healthy human hearts (36). Others showed that CaMKII regulates membrane channels directly involved in the propagation of cardiac impulse such as INa, IK1, and gap junctions (2, 20, 43, 44, 49). Taken together, the evidence suggests that in normal myocardium CaMKII may constitutively regulate cardiac conduction. Indeed, our finding that blockade of CaMKII with KN93 heterogeneously depresses conduction, making the basal RV especially vulnerable to conduction block, strongly supports the notion that a constitutively active CaMKII fine-tunes membrane excitability, perhaps compensating for some intrinsic ventricular heterogeneities, to establish fast and uniform conduction across the entire ventricular mass. Since CaMKII is a “stress” kinase sensitive to both elevated intracellular Ca2+ concentration ([Ca2+]i) as well as increased sympathetic tone (13), it is possible that there is a physiological necessity to adjust ionic components of cardiac excitability in response to stress. The fact that the blockade of CaMKII activity is more detrimental during the first minutes of ischemia, which otherwise has little effect on conduction, further suggests that upregulation of CaMKII in response to ischemia may be an important adaptive mechanism to avoid conduction block and lethal arrhythmias under metabolic stress. Whereas global ischemia used in our study is clearly a case of extreme stress, similar conditions and similar physiological demands may occur during more physiological stresses such as increased workload and/or increased heart rate, which can lead to “demand ischemia.” The dynamic regulation of CaMKII activity under conditions of acute electrophysiological stresses in the intact heart remains largely unknown and definitely merits further studies.
Ionic Mechanisms Underlying Regulation of Excitability by CaMKII
The analysis of the optical APs in whole hearts revealed a significant decrease in optically derived dV/dtmax in the RV (and especially in the RVOT) after treatment with 2.75 μM KN93. Since all the measurements of OAP dV/dtmax were normalized to the preischemic LV value, it was not possible to assess how KN93 affected the OAP upstroke velocity in the normally perfused LV. However, we were able to detect a significant reduction of OAP dV/dtmax by KN93 in the ischemic LV. The dV/dtmax derived from the OAPs may be distorted due to multiple myocytes contributing signal to each pixel, so that the spatial averaging of the wavefront could translate into an apparent reduction in dV/dt. However, using the patch clamp technique, we found that 2.75 μM KN93 induced a significant reduction of dV/dtmax in single myocytes isolated from both RVOT and LV myocytes. Thus the reduction of OAP dV/dtmax in response to KN93 observed in intact hearts most likely reflects a real phenomenon.
Importantly, our findings that KN93 reduces dV/dtmax in single rabbit cardiomyocytes provides a bridge between our whole heart studies and previously reported detailed analysis of regulation of INa by CaMKII. Specifically, Yoon et al. (49) showed that blockade of CaMKII by KN93 or autocamtide 2-related inhibitory peptide (AIP) markedly altered the biophysical properties of INa in adult rat ventricular myocytes, including a reduction of the peak current, shift of the steady-state inactivation to more negative potentials, enhancement of the intermediate inactivation, and slowing of the recovery from fast inactivation. All these changes can alone or in cooperation lead to an INa loss-of-function (i.e., reduced fraction of available Na+ channels at a given Vm and interbeat interval) and indeed, these authors reported a marked reduction of dV/dtmax by KN93 (49). It is noteworthy that the vulnerability to an abrupt increase in pacing rate which we observed in isolated myocytes (more prominently in RVOT cells, see Fig. 9C) could be related to the increase in INa intermediate inactivation reported by Yoon et al. (49). In line with this work, Aiba et al. (2) showed that injecting active CaMKIIα into guinea pig ventricular myocytes resulted in altered biophysical properties of INa consistent with an INa gain-of-function (positive shift of the voltage dependence of Na channel availability, accelerated recovery from inactivation, and decreased entry into intermediate or slow inactivation), and that both KN93 and AIP induced a prominent reduction of the AP dV/dtmax. Thus our results corroborate previous findings in rat and guinea pig cardiomyocytes supporting the notion that CaMKII positively regulates INa and excitability and extend this notion to the level of the whole heart.
Apart from effects of CaMKII on INa, previous studies indicated that CaMKII regulates other factors of cardiac excitability. In particular, inhibition of CaMKII with AIP acutely reduces both inward and outward components of IK1 (44). It was also shown that phospho-mimetic mutations applied to specific residues of Cx43 protein targeted by CaMKII markedly reduced the gap junctional conductance (20, 32). Regarding the role of IK1, our study did not detect any baseline regional differences in either Rm or Vrest (both parameters are principally determined by IK1) or significant changes in these parameters after perfusion with 2.75 μM KN93 (see Table 1). It should also be noted that a reduction in outward component of IK1 due to blockade of CaMKII should in principle result in increased excitability, which is contrary to our observations. Our data neither support nor refute the possibility that CaMKII-mediated changes in gap junction conductance contribute to heterogeneous depression of conduction exerted by KN93.
CaMKII as a “Homogenizer” of Ventricular Conduction
Our data demonstrate a consistent difference in OAP dV/dtmax between the LV and the RV (RV < LV) even in the absence of any intervention (see Fig. 4). It is of interest that the regional differences do not translate into a detectable difference in the distribution of conduction delays across the mapped surface (see Fig. 3). The lower value of dV/dtmax in the RV could reflect lower level of expression of Na+ channels [e.g., the protein level of Nav1.5 is lower in the RV than in the LV (14, 41)] or different kinetic properties of INa between chambers. Indeed, our data from isolated cardiomyocytes support the notion of functional INa differences, leading to lower dV/dtmax in RVOT than in the LV. In any case, given the underlying INa differences, these have to be compensated by other factor(s) to account for uniform conduction throughout the ventricles. Veeraraghavan and Poelzing (41) proposed that the heterogeneous distribution of Kir2.1 proteins underlying IK1 (lower in the RV than in the LV) (45) may counterbalance the concordant distribution of Nav1.5 in such a way that higher outward IK1 opposes the higher inward INa in the same chamber (LV) (41).
Our data reveals CaMKII-mediated regulation as another potential “homogenizing” factor, which compensates for intrinsic heterogeneities in Nav1.5 expression/function, or other potential factors determining excitability, which are different between the RV and the LV. In our interpretation, the fact that acutely blocking CaMKII causes heterogeneous decrease in dV/dtmax and conduction velocity must mean there is an intrinsically lower excitability in the vulnerable region (RVOT), which is compensated, under basal physiological conditions, by CaMKII-mediated upregulation of excitability in this region. By the same logic, CaMKII-mediated regulation is also capable of compensating for even larger heterogeneity of excitability and conduction under ischemic conditions.
Two different scenarios can be envisioned here. In one, CaMKII confers a uniform baseline action upon a single heterogeneously distributed ion channel, but a uniform reduction of CaMKII activity causes nonuniform reduction in excitability. Assuming INa as the most plausible target, and a nonlinear (saturating) relationship between the maximal INa (reflected in dV/dtmax) and conduction velocity, a uniform reduction of CaMKII activity would lead to diverging effect on conduction velocity in the RV and the LV. In the other scenario there is a chamber-specific or regional distribution of CaMKII “constitutive” activity such that the coordinated differential action of the kinase on the relevant ion channels leads to uniform conduction of excitation. Upon block of CaMKII, nonuniformities in conduction are then revealed. Our findings in myocytes isolated from the RVOT and the LV support the first scenario, i.e., there is an intrinsic heterogeneity in excitability at least between these two locations, and blockade of CaMKII exerts apparently similar relative reduction in excitability. However, as a result the excitability in the RVOT is brought to the threshold of safe conduction. Under stress, such as an increased pacing rate (see Fig. 9C) or mild ischemia (see Fig. 5B), the RVOT becomes vulnerable to intermittent activation failure potentially leading to VF. Clearly, much more needs to be done to understand the spatial aspect of CaMKII signaling and its relationship to the heterogeneities in the ionic mechanism underlying normal and pathological cardiac conduction.
CaMKII Blockade Jeopardizes Conduction and Is Proarrhythmic During Ischemia
An important result of this study is that the slowing of conduction due to CaMKII blockade is dramatically exacerbated by ischemia. The epicenter of the effect remains the same; the RVOT, with the aggravating circumstance that conduction slowing in some RV locations becomes extreme, leading to 2:1 conduction alternans, conduction block, and eventual VF. The fact that the blockade of CaMKII activity is more detrimental during the first minutes of ischemia, a time window in which Control hearts exhibit negligible changes in conduction, implies by converse logic that the CaMKII regulation of excitability may be increased under this condition. It is plausible therefore that CaMKII regulation of excitability becomes more important to maintain conduction during ischemia as compared with the normally oxygenated heart. CaMKII activation may potentially be increased during early ischemia due to a progressive increase of [Ca2+]i (10), as well as due to excessive formation of ROS (30). The latter event could promote sustained CaMKII activation given that oxidation of the Met281/282 site confers an autonomous activity to the kinase akin to that elicited by phosphorylation at Thr287 (12). In light of this, it is possible that ischemic conduction in untreated hearts is modulated by the enhanced activity of CaMKII, operating to compensate for the reduced excitability triggered by ischemia. Upon block of CaMKII, the absence of the aforementioned conduction upregulation would cause nonuniform depression of conduction to be more prominently revealed, and this is indeed consistent with our observations.
Facilitation of conduction slowing and block during ischemia by CaMKII blockade could occur through the modulation of established ischemia-mediated mechanisms promoting conduction slowing/block such as: elevated extracellular K+ and ensuing changes in resting membrane potential, leading to reduced availability of Na+ channels; changing IK1 conductance; and closure of gap junctional channels (10). One mechanism that is most likely involved, is the increase in extracellular K+ ([K+]o) concentration leading to the membrane depolarization. Assuming that CaMKII blockade induces negative shifts of the INa steady-state inactivation (2), even slight shift of the resting membrane potential toward less negative values may lead to marked changes in the availability of Na+ channels. The effect of CaMKII block-mediated reduction in IK1 (44) on conduction is difficult to predict, but theoretically it could affect the resting potential and thus modulate Na+ availability. The role of gap junction closure in mediating early slow conduction is more unlikely given that it occurs much later during ischemia (11).
Block of CaMKII prominently advanced the onset of ischemic VF as compared with controls, and KN92 (inactive analog of KN93) did not reproduce this effect (Fig. 6). Interestingly, conduction block (or slowing) preceding VF was a dynamic phenomenon that mostly took the form of 2:1 patterns of conduction, with every other beat consistently blocking (or slowing) at the vulnerable region in the RV (see Fig. 5). As discussed above, the marked and progressive conduction slowing occurring during ischemia in KN93-treated hearts likely results from a prominent downregulation of Na+ current that is further exacerbated by the ischemia-induced changes in excitability. The conduction alternans likely result from dynamic changes in the availability of Na+ channels, which may be related to increases in the intermediate inactivation of INa (49). The KN93-mediated propensity of RVOT myocytes to activation failure during rapid (but not slow) pacing supports the notion that increases in INa intermediate inactivation dynamically limit Na+ channel availability.
Once initiated, ischemic VF in the KN93-treated hearts was also markedly distinct from the controls. We previously reported that ischemic VF in rabbit hearts was characterized by highly periodic and fast activation patterns developing predominantly in the RV, whereas the LV exhibited progressive loss of excitability, which eventually spread to the RV leading to the onset of cardiac asystole (16). In contrast, VF occurring in the presence of CaMKII block was much slower (lower dominant frequency of excitation), aperiodic in nature, and once initiated did not precipitate the onset of tissue inexcitability within the 30-min ischemic episode. A study by Kneller et al. (24) reported that inhibition of the Na+ current resulted in a reduction of the dominant frequency of atrial fibrillation, which further supports the notion that the changes in patterns of conduction we observed during pacing and during VF are mediated (at least in part) by a reduction in the Na+ current as a consequence of CaMKII block.
Clinical Significance
CaMKII is upregulated in failing hearts (1, 18, 22). Furthermore, CaMKII activation has been implicated in the initiation of arrhythmias secondary to abnormal Ca2+ cycling (1, 3, 19, 31, 34, 39, 43). These observations have prompted researchers to consider the pharmacological blockade of CaMKII as a potential therapeutic target for heart failure patients. Our findings suggest that in the normal heart CaMKII blockade may in fact become proarrhythmic by causing heterogeneous depression of conduction with the epicenter in RVOT. Clearly, in the failing heart the effect may be significantly different, but it has never been studied, and our data emphasizes the urgency of such analysis.
We should note that in our study the depression of conduction occurred at the high (2.75 µM) but not at the low (1.0 µM) concentration of KN93. Several groups found antiarrhythmic effect of KN93 at the concentration of 1.0 µM or lower (5, 23, 27, 29, 31). Therefore, there may be a therapeutic window for an antiarrhythmic effect against Ca2+-mediated arrhythmias before depression of conduction occurs. Nevertheless, certain patients may be more sensitive to a CaMKII blocking drug depending on individual variations in clearance and metabolization of the drug, as well as relevant comorbidities such as conduction diseases. Thus in the drug design and evaluation it remains important to bear in mind the potential proarrhythmic effect of CaMKII blockade.
This brings us to a very intriguing finding that CaMKII blockade induced depression of conduction predominantly in the RVOT, which recapitulates RVOT conduction slowing observed in patients with Brugada syndrome (40, 50). This observation is clinically relevant in two ways. First, it suggests that Brugada patients may be at increased risk of VF if treated with CaMKII blockers. Second, it brings up a possibility that dysfunction in the CaMKII regulation of conduction via phosphorylating action on INa and/or gap junctions may underlie some instances of Brugada syndrome. Note that in ~70% of Brugada cases the underlying abnormality is not related to known mutations of ionic channels and the cause remains unknown) (9). It is noteworthy the arrhythmic manifestations of Brugada patients are prevalent during enhanced vagal activity, as, for example, during sleep, a condition that would theoretically lead to reduced CaMKII activity both via a reduced heart rate and reduced adrenergic tone (13).
Limitations
The general limitations of optical mapping in isolated nonworking hearts were discussed in our previous publication (16). Regarding the present work, conduction of excitation was triggered by simultaneous pacing from the sites at the lateral LV and RV free walls (see Fig. 1A), which led to activation sequence distinct from that during normal ventricular activation occurring through the His-Purkinje system. It is unlikely, however, that the principal observation of conduction depression in the RVOT would depend critically on the wavefront orientation. KN93 has known off-target effects including ion channels (3, 17, 33) and other kinases (15). However, the standard approach to compare the effects of KN93 with those induced by the inactive analogue KN92 incapable of blocking CaMKII addresses most of known off-target effects of KN93. Note that in our experimental set, KN92 had a zero or even slightly opposite effect to that achieved by KN93. Importantly, all prior studies addressing regulation of Nav1.5 demonstrated concordance between the effects of KN93 and the (so far undisputed selective) peptide inhibitor AIP, and none of the previous studies ever reported any direct influence of KN93 on the sodium channel, not mediated by CaMKII. Nonetheless, we cannot completely exclude a possibility that the effect of KN93 on excitability and ventricular conduction is due to some currently unknown molecular effect of this drug. Unfortunately, there was no practical possibility to use peptide CaMKII inhibitors in intact rabbit hearts. However, in combination with prior cellular studies (2, 49), we believe that our novel results in whole hearts are best explained in terms of blockade of CaMKII by KN93. Lastly, the heart isolation removes physiological regulation exerted by the autonomous nervous system, which may potentially modulate CaMKII function in the heart. Future experiments involving different representations of the autonomic activity will be required to determine the extent to which autonomic input is important for CaMKII-mediated regulation of ventricular conduction.
GRANTS
This work was supported by a Nora Eccles Treadwell Foundation Research Grant (to A. V. Zaitsev) and National Heart, Lung, and Blood Institute Grants 1R0-1HL-103877 (to A. V. Zaitsev) and R0-1HL-128752 (to M. Warren).
DISCLOSURES
No conflicts of interest, financial or otherwise, are declared by the authors.
AUTHOR CONTRIBUTIONS
M.W., K.W.S., and A.V.Z. conceived and designed research; M.W., K.J.S., T.G.T., V.G., N.S.T., J.S., K.W.S., and A.V.Z. performed experiments; M.W., K.J.S., T.G.T., V.G., and A.V.Z. analyzed data; M.W., K.W.S., and A.V.Z. interpreted results of experiments; M.W. and A.V.Z. prepared figures; M.W. and A.V.Z. drafted manuscript; M.W. and A.V.Z. edited and revised manuscript; M.W., K.J.S., T.G.T., V.G., N.S.T., J.S., K.W.S., and A.V.Z. approved final version of manuscript.
ACKNOWLEDGMENTS
We thank Alicja Booth for excellent technical support and Dennis King, Wilson Lobaina, and Bruce Steadman for invaluable help with various hardware and software necessary for this study.
REFERENCES
- 1.Ai X, Curran JW, Shannon TR, Bers DM, Pogwizd SM. Ca2+/calmodulin-dependent protein kinase modulates cardiac ryanodine receptor phosphorylation and sarcoplasmic reticulum Ca2+ leak in heart failure. Circ Res 97: 1314–1322, 2005. doi: 10.1161/01.RES.0000194329.41863.89. [DOI] [PubMed] [Google Scholar]
- 2.Aiba T, Hesketh GG, Liu T, Carlisle R, Villa-Abrille MC, O’Rourke B, Akar FG, Tomaselli GF. Na+ channel regulation by Ca2+/calmodulin and Ca2+/calmodulin-dependent protein kinase II in guinea-pig ventricular myocytes. Cardiovasc Res 85: 454–463, 2010. doi: 10.1093/cvr/cvp324. [DOI] [PMC free article] [PubMed] [Google Scholar]
- 3.Anderson ME, Braun AP, Wu Y, Lu T, Wu Y, Schulman H, Sung RJ. KN-93, an inhibitor of multifunctional Ca++/calmodulin-dependent protein kinase, decreases early afterdepolarizations in rabbit heart. J Pharmacol Exp Ther 287: 996–1006, 1998. [PubMed] [Google Scholar]
- 4.Ashpole NM, Herren AW, Ginsburg KS, Brogan JD, Johnson DE, Cummins TR, Bers DM, Hudmon A. Ca2+/calmodulin-dependent protein kinase II (CaMKII) regulates cardiac sodium channel NaV1.5 gating by multiple phosphorylation sites. J Biol Chem 287: 19856–19869, 2012. doi: 10.1074/jbc.M111.322537. [DOI] [PMC free article] [PubMed] [Google Scholar]
- 5.Bell JR, Raaijmakers AJ, Curl CL, Reichelt ME, Harding TW, Bei A, Ng DC, Erickson JR, Vila Petroff M, Harrap SB, Delbridge LM. Cardiac CaMKIIδ splice variants exhibit target signaling specificity and confer sex-selective arrhythmogenic actions in the ischemic-reperfused heart. Int J Cardiol 181: 288–296, 2015. doi: 10.1016/j.ijcard.2014.11.159. [DOI] [PubMed] [Google Scholar]
- 6.Bers DM, Grandi E. Calcium/calmodulin-dependent kinase II regulation of cardiac ion channels. J Cardiovasc Pharmacol 54: 180–187, 2009. doi: 10.1097/FJC.0b013e3181a25078. [DOI] [PMC free article] [PubMed] [Google Scholar]
- 7.Bers DM, Morotti S. Ca2+ current facilitation is CaMKII-dependent and has arrhythmogenic consequences. Front Pharmacol 5: 144, 2014. doi: 10.3389/fphar.2014.00144. [DOI] [PMC free article] [PubMed] [Google Scholar]
- 8.Braun AP, Schulman H. The multifunctional calcium/calmodulin-dependent protein kinase: from form to function. Annu Rev Physiol 57: 417–445, 1995. doi: 10.1146/annurev.ph.57.030195.002221. [DOI] [PubMed] [Google Scholar]
- 9.Brugada R, Campuzano O, Sarquella-Brugada G, Brugada J, Brugada P. Brugada syndrome. Methodist DeBakey Cardiovasc J 10: 25–28, 2014. doi: 10.14797/mdcj-10-1-25. [DOI] [PMC free article] [PubMed] [Google Scholar]
- 10.Carmeliet E. Cardiac ionic currents and acute ischemia: from channels to arrhythmias. Physiol Rev 79: 917–1017, 1999. [DOI] [PubMed] [Google Scholar]
- 11.Cinca J, Warren M, Carreño A, Tresànchez M, Armadans L, Gómez P, Soler-Soler J. Changes in myocardial electrical impedance induced by coronary artery occlusion in pigs with and without preconditioning: correlation with local ST-segment potential and ventricular arrhythmias. Circulation 96: 3079–3086, 1997. doi: 10.1161/01.CIR.96.9.3079. [DOI] [PubMed] [Google Scholar]
- 12.Erickson JR, Joiner ML, Guan X, Kutschke W, Yang J, Oddis CV, Bartlett RK, Lowe JS, O’Donnell SE, Aykin-Burns N, Zimmerman MC, Zimmerman K, Ham AJ, Weiss RM, Spitz DR, Shea MA, Colbran RJ, Mohler PJ, Anderson ME. A dynamic pathway for calcium-independent activation of CaMKII by methionine oxidation. Cell 133: 462–474, 2008. doi: 10.1016/j.cell.2008.02.048. [DOI] [PMC free article] [PubMed] [Google Scholar]
- 13.Erickson JR, Patel R, Ferguson A, Bossuyt J, Bers DM. Fluorescence resonance energy transfer-based sensor Camui provides new insight into mechanisms of calcium/calmodulin-dependent protein kinase II activation in intact cardiomyocytes. Circ Res 109: 729–738, 2011. doi: 10.1161/CIRCRESAHA.111.247148. [DOI] [PMC free article] [PubMed] [Google Scholar]
- 14.Fahmi AI, Patel M, Stevens EB, Fowden AL, John JE III, Lee K, Pinnock R, Morgan K, Jackson AP, Vandenberg JI. The sodium channel beta-subunit SCN3b modulates the kinetics of SCN5a and is expressed heterogeneously in sheep heart. J Physiol 537: 693–700, 2001. doi: 10.1113/jphysiol.2001.012691. [DOI] [PMC free article] [PubMed] [Google Scholar]
- 15.Gao Y, Davies SP, Augustin M, Woodward A, Patel UA, Kovelman R, Harvey KJ. A broad activity screen in support of a chemogenomic map for kinase signalling research and drug discovery. Biochem J 451: 313–328, 2013. doi: 10.1042/BJ20121418. [DOI] [PubMed] [Google Scholar]
- 16.Garg V, Taylor T, Warren M, Venable P, Sciuto K, Shibayama J, Zaitsev A. β-Adrenergic stimulation and rapid pacing mutually promote heterogeneous electrical failure and ventricular fibrillation in the globally ischemic heart. Am J Physiol Heart Circ Physiol 308: H1155–H1170, 2015. doi: 10.1152/ajpheart.00768.2014. [DOI] [PMC free article] [PubMed] [Google Scholar]
- 17.Hegyi B, Chen-Izu Y, Jian Z, Shimkunas R, Izu LT, Banyasz T. KN-93 inhibits IKr in mammalian cardiomyocytes. J Mol Cell Cardiol 89, Pt B: 173–176, 2015. doi: 10.1016/j.yjmcc.2015.10.012. [DOI] [PMC free article] [PubMed] [Google Scholar]
- 18.Hoch B, Meyer R, Hetzer R, Krause EG, Karczewski P. Identification and expression of delta-isoforms of the multifunctional Ca2+/calmodulin-dependent protein kinase in failing and nonfailing human myocardium. Circ Res 84: 713–721, 1999. doi: 10.1161/01.RES.84.6.713. [DOI] [PubMed] [Google Scholar]
- 19.Hoeker GS, Hanafy MA, Oster RA, Bers DM, Pogwizd SM. Reduced arrhythmia inducibility with calcium/calmodulin-dependent protein kinase ii inhibition in heart failure rabbits. J Cardiovasc Pharmacol 67: 260–265, 2016. doi: 10.1097/FJC.0000000000000343. [DOI] [PMC free article] [PubMed] [Google Scholar]
- 20.Huang RY, Laing JG, Kanter EM, Berthoud VM, Bao M, Rohrs HW, Townsend RR, Yamada KA. Identification of CaMKII phosphorylation sites in Connexin43 by high-resolution mass spectrometry. J Proteome Res 10: 1098–1109, 2011. doi: 10.1021/pr1008702. [DOI] [PMC free article] [PubMed] [Google Scholar]
- 21.Hund TJ, Koval OM, Li J, Wright PJ, Qian L, Snyder JS, Gudmundsson H, Kline CF, Davidson NP, Cardona N, Rasband MN, Anderson ME, Mohler PJ. A β(IV)-spectrin/CaMKII signaling complex is essential for membrane excitability in mice. J Clin Invest 120: 3508–3519, 2010. doi: 10.1172/JCI43621. [DOI] [PMC free article] [PubMed] [Google Scholar]
- 22.Kirchhefer U, Schmitz W, Scholz H, Neumann J. Activity of cAMP-dependent protein kinase and Ca2+/calmodulin-dependent protein kinase in failing and nonfailing human hearts. Cardiovasc Res 42: 254–261, 1999. doi: 10.1016/S0008-6363(98)00296-X. [DOI] [PubMed] [Google Scholar]
- 23.Kirchhof P, Fabritz L, Kilić A, Begrow F, Breithardt G, Kuhn M. Ventricular arrhythmias, increased cardiac calmodulin kinase II expression, and altered repolarization kinetics in ANP receptor deficient mice. J Mol Cell Cardiol 36: 691–700, 2004. doi: 10.1016/j.yjmcc.2004.03.007. [DOI] [PubMed] [Google Scholar]
- 24.Kneller J, Kalifa J, Zou R, Zaitsev AV, Warren M, Berenfeld O, Vigmond EJ, Leon LJ, Nattel S, Jalife J. Mechanisms of atrial fibrillation termination by pure sodium channel blockade in an ionically-realistic mathematical model. Circ Res 96: e35–e47, 2005. doi: 10.1161/01.RES.0000160709.49633.2b. [DOI] [PubMed] [Google Scholar]
- 25.Maier LS, Bers DM. Role of Ca2+/calmodulin-dependent protein kinase (CaMK) in excitation-contraction coupling in the heart. Cardiovasc Res 73: 631–640, 2007. doi: 10.1016/j.cardiores.2006.11.005. [DOI] [PubMed] [Google Scholar]
- 26.Marionneau C, Lichti CF, Lindenbaum P, Charpentier F, Nerbonne JM, Townsend RR, Mérot J. Mass spectrometry-based identification of native cardiac Nav1.5 channel α subunit phosphorylation sites. J Proteome Res 11: 5994–6007, 2012. doi: 10.1021/pr300702c. [DOI] [PMC free article] [PubMed] [Google Scholar]
- 27.Mitsuyama H, Yokoshiki H, Watanabe M, Mizukami K, Shimokawa J, Tsutsui H. Ca2+/calmodulin-dependent protein kinase II increases the susceptibility to the arrhythmogenic action potential alternans in spontaneously hypertensive rats. Am J Physiol Heart Circ Physiol 307: H199–H206, 2014. doi: 10.1152/ajpheart.00387.2012. [DOI] [PubMed] [Google Scholar]
- 28.Morotti S, Edwards AG, McCulloch AD, Bers DM, Grandi E. A novel computational model of mouse myocyte electrophysiology to assess the synergy between Na+ loading and CaMKII. J Physiol 592: 1181–1197, 2014. doi: 10.1113/jphysiol.2013.266676. [DOI] [PMC free article] [PubMed] [Google Scholar]
- 29.Park H, Park H, Lee D, Oh S, Lim J, Hwang HJ, Park S, Pak HN, Lee MH, Joung B. Increased phosphorylation of Ca(2+) handling proteins as a proarrhythmic mechanism in myocarditis. Circ J 78: 2292–2301, 2014. doi: 10.1253/circj.CJ-14-0277. [DOI] [PubMed] [Google Scholar]
- 30.Pasdois P, Beauvoit B, Tariosse L, Vinassa B, Bonoron-Adèle S, Dos Santos P. Effect of diazoxide on flavoprotein oxidation and reactive oxygen species generation during ischemia-reperfusion: a study on Langendorff-perfused rat hearts using optic fibers. Am J Physiol Heart Circ Physiol 294: H2088–H2097, 2008. doi: 10.1152/ajpheart.01345.2007. [DOI] [PubMed] [Google Scholar]
- 31.Pezhouman A, Singh N, Song Z, Nivala M, Eskandari A, Cao H, Bapat A, Ko CY, Nguyen TP, Qu Z, Karagueuzian HS, Weiss JN. Molecular basis of hypokalemia-induced ventricular fibrillation. Circulation 132: 1528–1537, 2015. doi: 10.1161/CIRCULATIONAHA.115.016217. [DOI] [PMC free article] [PubMed] [Google Scholar]
- 32.Procida K, Jørgensen L, Schmitt N, Delmar M, Taffet SM, Holstein-Rathlou NH, Nielsen MS, Braunstein TH. Phosphorylation of connexin43 on serine 306 regulates electrical coupling. Heart Rhythm 6: 1632–1638, 2009. doi: 10.1016/j.hrthm.2009.07.043. [DOI] [PMC free article] [PubMed] [Google Scholar]
- 33.Rezazadeh S, Claydon TW, Fedida D. KN-93 (2-[N-(2-hydroxyethyl)]-N-(4-methoxybenzenesulfonyl)]amino-N-(4-chlorocinnamyl)-N-methylbenzylamine), a calcium/calmodulin-dependent protein kinase II inhibitor, is a direct extracellular blocker of voltage-gated potassium channels. J Pharmacol Exp Ther 317: 292–299, 2006. doi: 10.1124/jpet.105.097618. [DOI] [PubMed] [Google Scholar]
- 34.Sag CM, Wadsack DP, Khabbazzadeh S, Abesser M, Grefe C, Neumann K, Opiela MK, Backs J, Olson EN, Brown JH, Neef S, Maier SK, Maier LS. Calcium/calmodulin-dependent protein kinase II contributes to cardiac arrhythmogenesis in heart failure. Circ Heart Fail 2: 664–675, 2009. doi: 10.1161/CIRCHEARTFAILURE.109.865279. [DOI] [PMC free article] [PubMed] [Google Scholar]
- 35.Shaw RM, Rudy Y. Ionic mechanisms of propagation in cardiac tissue. Roles of the sodium and L-type calcium currents during reduced excitability and decreased gap junction coupling. Circ Res 81: 727–741, 1997. doi: 10.1161/01.RES.81.5.727. [DOI] [PubMed] [Google Scholar]
- 36.Sossalla S, Fluschnik N, Schotola H, Ort KR, Neef S, Schulte T, Wittköpper K, Renner A, Schmitto JD, Gummert J, El-Armouche A, Hasenfuss G, Maier LS. Inhibition of elevated Ca2+/calmodulin-dependent protein kinase II improves contractility in human failing myocardium. Circ Res 107: 1150–1161, 2010. doi: 10.1161/CIRCRESAHA.110.220418. [DOI] [PubMed] [Google Scholar]
- 37.Stratton MM, Chao LH, Schulman H, Kuriyan J. Structural studies on the regulation of Ca2+/calmodulin dependent protein kinase II. Curr Opin Struct Biol 23: 292–301, 2013. doi: 10.1016/j.sbi.2013.04.002. [DOI] [PMC free article] [PubMed] [Google Scholar]
- 38.Swaminathan PD, Purohit A, Hund TJ, Anderson ME. Calmodulin-dependent protein kinase II: linking heart failure and arrhythmias. Circ Res 110: 1661–1677, 2012. doi: 10.1161/CIRCRESAHA.111.243956. [DOI] [PMC free article] [PubMed] [Google Scholar]
- 39.Toischer K, Hartmann N, Wagner S, Fischer TH, Herting J, Danner BC, Sag CM, Hund TJ, Mohler PJ, Belardinelli L, Hasenfuss G, Maier LS, Sossalla S. Role of late sodium current as a potential arrhythmogenic mechanism in the progression of pressure-induced heart disease. J Mol Cell Cardiol 61: 111–122, 2013. doi: 10.1016/j.yjmcc.2013.03.021. [DOI] [PMC free article] [PubMed] [Google Scholar]
- 40.Tukkie R, Sogaard P, Vleugels J, de Groot IK, Wilde AA, Tan HL. Delay in right ventricular activation contributes to Brugada syndrome. Circulation 109: 1272–1277, 2004. doi: 10.1161/01.CIR.0000118467.53182.D1. [DOI] [PubMed] [Google Scholar]
- 41.Veeraraghavan R, Poelzing S. Mechanisms underlying increased right ventricular conduction sensitivity to flecainide challenge. Cardiovasc Res 77: 749–756, 2008. doi: 10.1093/cvr/cvm090. [DOI] [PubMed] [Google Scholar]
- 42.Vincent KP, McCulloch AD, Edwards AG. Toward a hierarchy of mechanisms in CaMKII-mediated arrhythmia. Front Pharmacol 5: 110, 2014. doi: 10.3389/fphar.2014.00110. [DOI] [PMC free article] [PubMed] [Google Scholar]
- 43.Wagner S, Dybkova N, Rasenack EC, Jacobshagen C, Fabritz L, Kirchhof P, Maier SK, Zhang T, Hasenfuss G, Brown JH, Bers DM, Maier LS. Ca2+/calmodulin-dependent protein kinase II regulates cardiac Na+ channels. J Clin Invest 116: 3127–3138, 2006. doi: 10.1172/JCI26620. [DOI] [PMC free article] [PubMed] [Google Scholar]
- 44.Wagner S, Hacker E, Grandi E, Weber SL, Dybkova N, Sossalla S, Sowa T, Fabritz L, Kirchhof P, Bers DM, Maier LS. Ca/calmodulin kinase II differentially modulates potassium currents. Circ Arrhythm Electrophysiol 2: 285–294, 2009. doi: 10.1161/CIRCEP.108.842799. [DOI] [PMC free article] [PubMed] [Google Scholar]
- 45.Warren M, Guha PK, Berenfeld O, Zaitsev A, Anumonwo JM, Dhamoon AS, Bagwe S, Taffet SM, Jalife J. Blockade of the inward rectifying potassium current terminates ventricular fibrillation in the guinea pig heart. J Cardiovasc Electrophysiol 14: 621–631, 2003. doi: 10.1046/j.1540-8167.2003.03006.x. [DOI] [PubMed] [Google Scholar]
- 46.Warren M, Sciuto K, Shibayama J, Zaitsev AV. Blockade of calcium/calmodulin-dependent kinase II (CaMKII) induces heterogeneous depression of conduction and promotes ischemic ventricular fibrillation. Biophys J 110: 273a, 2016. doi: 10.1016/j.bpj.2015.11.1484. [DOI] [Google Scholar]
- 47.Warren M, Spitzer KW, Steadman BW, Rees TD, Venable P, Taylor T, Shibayama J, Yan P, Wuskell JP, Loew LM, Zaitsev AV. High-precision recording of the action potential in isolated cardiomyocytes using the near-infrared fluorescent dye di-4-ANBDQBS. Am J Physiol Heart Circ Physiol 299: H1271–H1281, 2010. doi: 10.1152/ajpheart.00248.2010. [DOI] [PMC free article] [PubMed] [Google Scholar]
- 48.Yamamoto T, Swietach P, Rossini A, Loh SH, Vaughan-Jones RD, Spitzer KW. Functional diversity of electrogenic Na+-HCO3− cotransport in ventricular myocytes from rat, rabbit and guinea pig. J Physiol 562: 455–475, 2005. doi: 10.1113/jphysiol.2004.071068. [DOI] [PMC free article] [PubMed] [Google Scholar]
- 49.Yoon JY, Ho WK, Kim ST, Cho H. Constitutive CaMKII activity regulates Na+ channel in rat ventricular myocytes. J Mol Cell Cardiol 47: 475–484, 2009. doi: 10.1016/j.yjmcc.2009.06.020. [DOI] [PubMed] [Google Scholar]
- 50.Zhang J, Sacher F, Hoffmayer K, O’Hara T, Strom M, Cuculich P, Silva J, Cooper D, Faddis M, Hocini M, Haïssaguerre M, Scheinman M, Rudy Y. Cardiac electrophysiological substrate underlying the ECG phenotype and electrogram abnormalities in Brugada syndrome patients. Circulation 131: 1950–1959, 2015. doi: 10.1161/CIRCULATIONAHA.114.013698. [DOI] [PMC free article] [PubMed] [Google Scholar]