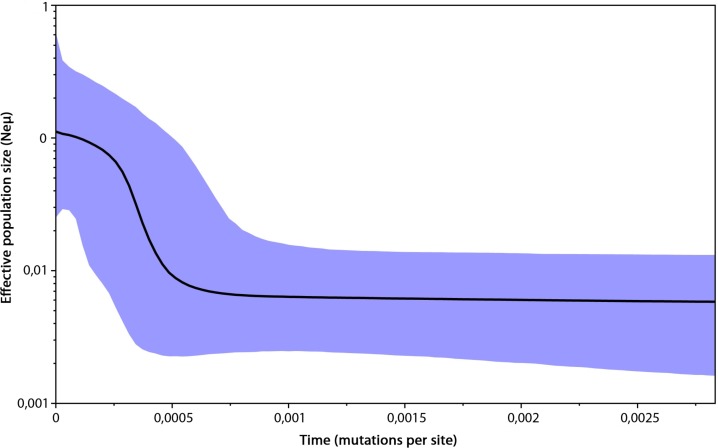
Figure 4. Bayesian skyline plot based on mtDNA of 296 Erinaceus roumanicus samples.
The X axis represents the time in mutation units per nucleotide position. The Y axis represents a correlate of the population size (Ne). The black line shows the median of the Ne estimation, and the 95% confidence intervals are indicated by the blue areas.

