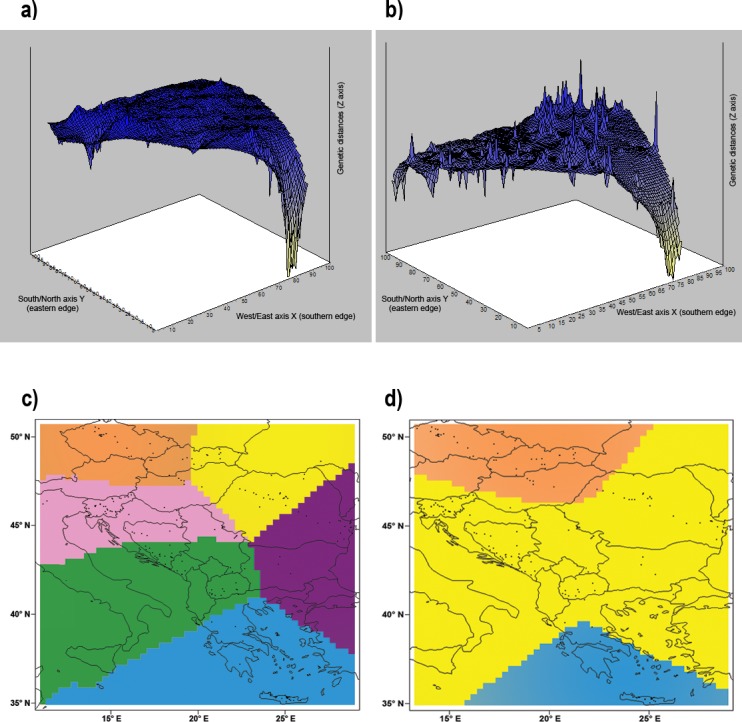
Figure 5. Genetic landscape shape interpolation analysis.

Genetic landscape shape interpolation analysis based on variation of (A) the control region of mtDNA using 296 Erinaceus roumanicus samples and (B) nine nuclear microsatellite loci using 260 E. roumanicus samples. The X and Y axes reflect the geographic coordinates within the study area, while the Z axis represents the average genetic distances between the analysed samples. The Bayesian landscape genetic analysis using Geneland illustrates the spatial distribution of the populations using (C) the control region of mtDNA and (D) nine nuclear microsatellite loci. Figure was done using publicly available outlines (https://CRAN.R-project.org/ package=rworldmap) and edited in Photoshop CS3 (Adobe).
