Abstract
Phase-sensitive optical coherence tomography (PhOCT) offers exquisite sensitivity to mechanical vibration in biological tissues. There is growing interest in using PhOCT for imaging the nanometer scale vibrations of the ear in animal models of hearing disorders. Swept-source-based systems offer fast acquisition speeds, suppression of common mode noise via balanced detection, and good signal roll-off. However, achieving high phase stability is difficult due to nonlinear laser sweeps and trigger jitter in a typical swept laser source. Here, we report on the initial application of a Vernier-tuned distributed Bragg reflector (VT-DBR) swept laser as the source for a fiber-based PhOCT system. The VT-DBR swept laser is electronically tuned and precisely controls sweeps without mechanical movement, resulting in highly linear sweeps with high wavelength stability and repeatability. We experimentally measured a phase sensitivity of 0.4 pm standard deviation, within a factor of less than 2 of the computed shot-noise limit. We further demonstrated the system by making ex vivo measurements of the vibrations of the mouse middle ear structures.
Optical coherence tomography (OCT) is a noninvasive optical imaging modality that can image subsurface biological tissues with high axial resolution in vivo. Recent interest in the application of OCT for imaging the morphology of the ear has included animal studies of the middle/inner ear [1–3] and pilot studies for clinical imaging of the middle ear [4]. Functional vibrometry using phase-sensitive OCT (PhOCT) also has been used to visualize the nanometer scale motion in the inner ear (cochlea) of animal models of hearing disorders [5,6]. In vivo PhOCT imaging of the intact mouse cochlea has lead to new insights into the mechanical motion of the soft tissues within the cochlea [7]. Together, these studies indicate the potential of OCT for basic and applied research into hearing disorders and clinical diagnosis.
Functional vibrometry with PhOCT has largely been limited to spectrometer-based OCT systems, i.e., spectral domain OCT, due to the inherent phase stability [8]. The phase stability is due in part to the lack of moving parts. Nevertheless, the application of swept-source OCT technology is attractive for applications in the ear because of the fast acquisition speeds that enable imaging of high-frequency motion in animal models, the suppression of common mode noise and artifacts via balanced detection, and the typically more favorable signal roll-off.
Phase instability of swept-source-based PhOCT is currently a major limiting factor in achieving accurate vibratory measurements in biological samples. For a typical swept laser, the frequency sweeping is not linear and leads to a nonuniform sampling interval, posing a problem for using the fast Fourier transform in processing the spectral interferogram. A common solution to this problem is to simultaneously acquire data from a Mach–Zehnder interferometer (MZI) with a fixed pathlength difference and resample the OCT interferograms. This method improves the axial resolution as well as to some degree the phase stability at the cost of additional resource requirements for data storage and postprocessing [9]. Alternatively, the MZI can be used to directly trigger the data acquisition. In both cases, jitter due to instabilities in the laser will severely limit the phase stability of PhOCT system unless additional efforts are made to compensate.
Intersweep variability is caused by the lack of synchronization between the laser sweep and the trigger signal, i.e., these signals are not phase locked in a typical swept-source laser used in OCT. Such lasers can have up to π radians of phase noise [10]. Choi et al. demonstrated a method that utilized a fiber Bragg grating (FBG) to align the MZI data and OCT interferograms in postprocessing [11]. The frequency of the FBG had to be carefully selected to prevent alteration of the image. A numerical method utilizing a cross-correlation procedure to measure the shift between two sequential A-scans prior to re-sampling also has been demonstrated [12]. However, this method requires additional processing time and computational resources. There are a number of solutions developed thus far for intersweep variability compensation to enable near shot-noise-limited phase sensitivity, some of which are summarized above. However, they all consume substantial resources and complicate the design of the PhOCT system.
Here, we describe the use of a new type of swept-laser source, the Vernier-tuned distributed Bragg reflector (VT-DBR) laser, which obviates the need for intersweep variability compensation, thus significantly simplifying PhOCT system development. The VT-DBR swept laser uses electronic tuning to execute changes in wavelength and precisely controls sweeps without any mechanical movement in the tuning mechanism. Removal of mechanical movement enables the laser cavity, in addition to all tuning regions, to reside on a monolithic structure without the need of external cavity coupling within a semiconductor and allows for low intersweep variability (<0.002%) and accurate sampling trigger (<300 fs), which provides 10 times more accurate sampling triggers than any other k-clock [13]. As we will show below, this increased trigger stability leads to good phase noise characteristics without applying any intersweep variability compensation. The trigger stability and linear k sweeps make the VT-DBR swept laser an attractive choice for PhOCT.
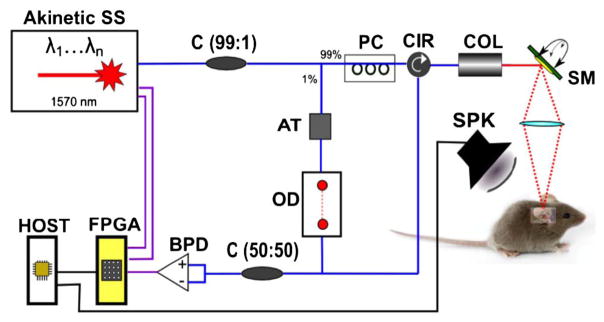
The fiber-based swept-source OCT system is shown in Fig. 1. A prototype 1570 nm VT-DBR semiconductor swept laser with a bandwidth of ~90 nm, sweep frequency of 45 kHz, and average power of ~13 mW served as the light source (Akinetic Swept Laser, Insight Photonic Solutions, Inc.). The basic characterization and performance (e.g., duty cycle, sweep efficiency, roll-off, and relative intensity noise) of a similar VT-DBR laser has been reported previously [13]. Laser light was split using a 2 × 2 (99:1) single mode coupler so that 99% of light went to the sample arm through a circulator. The light in the sample arm was scanned using a two-axis scanning MEMS mirror (Mirrorcle Technologies, Inc.) and was focused on the sample specimen via a 50 mm achromatic doublet lens (#45-797, Edmund Optics) yielding an effective NA of 0.249. The remaining 1% went to the reference arm through a fiber-based variable attenuator for the power adjustment and an optical delay line and patch cable for optical path length matching between two arms. The reflected light from both arms was combined with another 2 × 2 (50:50) SM coupler. Resulting OCT spectral interferograms were measured using a balanced detector (PDB460C, Thorlabs, Inc.).
Fig. 1.
Schematic of phase-sensitive OCT: SS, swept source; C (A:B), fiber coupler with A to B coupling ratio; AT, attenuator; OD, optical delay line; PC, polarization controller; CIR, circulator; COL, collimator; SM, scanning mirror; OL, objective lens; BPD, balanced photodetector; FPGA, FPGA module; HOST, host computer; SPK; speaker. Blue lines: optical connections. Purple lines: electrical SMA connections. Black lines: electrical BNC connections.
A 12-bit high-speed digitizer with a sampling rate of 1.6 GS/s (NI 5772, National Instruments) and an FPGA module (NI PXIe-7966R FlexRIO, National Instruments) were employed for fast data acquisition and processing, which enabled real-time structural and vibrational middle ear imaging. The sweep trigger and sample clock from the laser were used directly as the trigger and sampling clock for the digitizer. Customized FPGA-based software written in LabVIEW was developed and used to control data acquisition and processing. The signal-to-noise ratio of the system was 105 dB for a perfect reflector, within 6 dB of the shot-noise limit.
The essential procedure for vibrometry using PhOCT has been described elsewhere [5,6]. Briefly, an OCT M-scan is acquired at a position of interest while simultaneously supplying sound stimulation. Normal OCT processing is done to generate the complex OCT A-line as a function of time. A second Fourier transform along the time axis of the interferometric phase provided the vibration magnitude and phase. The magnitudes with units of radian (rad) were converted to units of nanometer (nm) by multiplying by λo/(4nπ), where λo is the center wavelength of the swept laser and n is the sample refractive index. The refractive index of the tympanic membrane was assumed to be 1.44 [14]. The theoretical phase sensitivity in the frequency domain follows a Rician distribution; hence, it has a nonzero mean [15]. Therefore, we express the phase sensitivity of the PhOCT system as mean (δpmean) ± standard deviation (δpstd) (nm). The equations that apply to any PhOCT system are
| (1) |
where λo is the center wavelength of the swept laser, N is total number of acquired A-scans in the M-scan, and SNR is the signal-to-noise ratio on a dB scale.
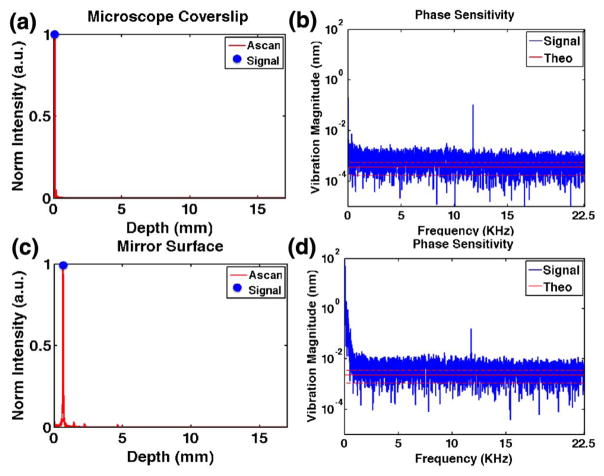
In order to separate contributions to the phase noise from the mechanical vibrations in the interferometer and instabilities in the laser, we blocked the reference arm and set up a simple common-path interferometer using a microscope coverslip. The interference due to reflections from the top and bottom of the coverslip has nearly identical optical paths, which cancel contributions to the phase noise from mechanical motion in the interferometer. The autocorrelation is generally suppressed by balanced detection, so for these measurements one fiber was unplugged from the balanced detector. Figure 2(a) shows the A-scan of the microscope coverslip with 79 dB of measured SNR at the peak. A 10,000 line M-scan with a sample interval of 22 μs was recorded while applying a 0 V signal to the scanning mirror. The phase stability of the laser was computed from the maximum intensity in the A-scan (blue point). Figure 2(b) shows the phase signal in the frequency domain (blue trace). The mean and standard deviations of the theoretical shot-noise-limited phase noise as calculated by Eq. (1) with λ0 = 1570 nm and n = 1 are shown as a solid and dashed red lines, respectively. With the exception of a noise spike at 11.75 kHz, the noise appears consistent across the entire frequency range. The mean and standard deviation of the measured phase signal between 0.7 and 22.5 kHz is less than 0.7 ± 0.4 pm (5.6 ± 3.2 μrad) within a factor of ~2 of the theoretical shot-noise limit of 0.4 ± 0.2 pm (3.2 ± 1.6 μrad), excluding the noise spike. These results are consistent with sensitivities we have measured using conventional swept-source lasers that have been well compensated for intersweep variability. We tested two laser prototypes in our system, and only one exhibited the noise spike. Furthermore, the spike appeared to be an aliased signal since the frequency could be changed at will by varying the repetition rate of the laser, thus changing the Nyquist frequency. This spike was simply a peculiarity of this prototype laser source and not a feature fundamental to its architecture. We chose to present data from this laser prototype with the noise spike because it also had the widest spectral bandwidth, although the other prototype had a higher maximum sweep rate (140 kHz).
Fig. 2.
Phase sensitivity of VT-DBR swept laser. A-scans of a microscope coverslip autocorrelation (a) and a −40 dB reflector (c). The phase signal in the frequency domain from the peak signal [blue dot in (a) and (c)] based on a 10,000 line M-scan. The mean and standard deviations of theoretical phase noise are shown as solid and dashed red lines, respectively.
In order to evaluate the phase sensitivity of the entire PhOCT system under normal conditions, we measured a static mirror reflector with the same M-scan protocol as above. A 20 dB neutral density filter was placed in the sample path to prevent saturation and resulted in a measured SNR of 64 dB. Figures 2(c) and 2(d) show the A-scan and the phase signal in the frequency domain (blue trace), respectively. The mean and standard deviation of the measured phase signal between 0.7 and 22.5 kHz was less than 4.8 ± 2.8 pm (38.4 ± 22.4 μrad) within a factor of ~2 of the theoretical shot-noise limit of 2.1 ± 1.1 pm (16.8 ± 8.8 μrad). The additional phase noise at low frequency is likely due to mechanical motion in the interferometer, including the MEMS mirror. Placing the system on a floated optical table would likely remove most of the low-frequency noise, although position drifts of the mirror (e.g., zero drift and gain drift) over time, and temperature also can degrade the phase stability.
Next, we turned to imaging vibrations in the mouse middle ear. Before beginning, a calibration of the speaker had to be conducted in order to maintain consistent sound pressure level (dB SPL) throughout the entire test frequency range. A high-precision microphone (M31, LinearX System Inc.) was positioned at the approximate orientation where the tympanic membrane (eardrum) would be positioned. The speaker’s response was calculated by playing a reference tone that was measured by the microphone. Multiple measurements were made and averaged to establish a lookup table of voltages required to output a specific sound pressure level at a given frequency.
A C57BL/6 male mouse was sacrificed under the protocol approved by the Texas A&M University Institutional Animal Care and Use Committee. The pinna and muscle of the outer ear were surgically removed along with the external canal under a dissecting microscope, exposing the tympanic membrane for the experiment. The mouse was positioned on a movable platform under the OCT system so that the tympanic membrane of the mouse was at the previous position of the calibration microphone. Two- and three-dimensional structural images of the middle ear were then acquired at several locations without any sound stimuli. Using these, a region of interest was selected for the vibration measurement. M-scan acquisition at the region of interest was performed with sinusoidal sound stimuli generated by a function generator and amplified by a power amplifier.
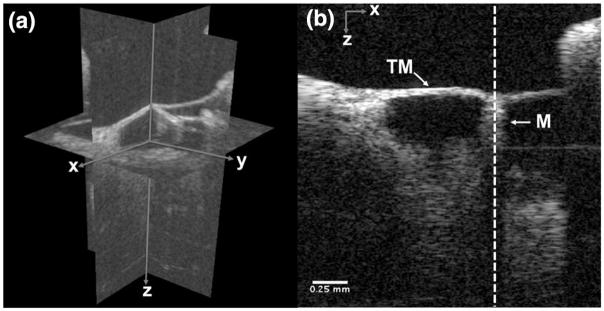
Representative volumetric and cross-sectional images of the middle ear are shown in Fig. 3. The volumetric image was acquired with a field of view of 2.4 (x) by 2.4 (y) by 2.6 (z) mm. Individual structures and connections between the tympanic membrane and the manubrium can be clearly identified in the cross-sectional B-scan image.
Fig. 3.
Volumetric (a) and B-scan (b) OCT image of mouse middle ear. Anatomical structures (TM, tympanic membrane; M, malleus) are clearly displayed. The white dotted A-scan was selected for the sound-induced vibration measurement. Scale bar is 0.25 mm.
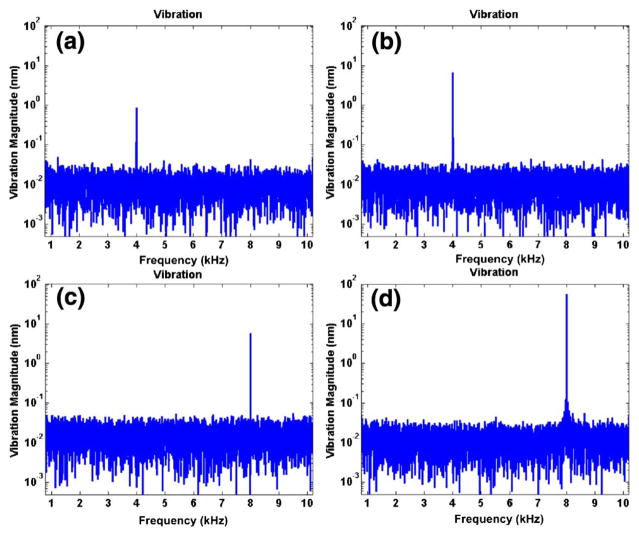
The M-scans were comprised of 10,000 A-scans at the malleus denoted by the dashed vertical white line in Fig. 3(b). M-scans were acquired using sound stimulus ranging from 4–10 kHz and 50–70 dB SPL. Figure 4 shows example vibrational magnitudes with four different sinusoidal stimuli [(a) 50 dB SPL at 4 kHz; (b) 70 dB SPL at 4 kHz; (c) 50 dB SPL at 8 kHz; (d) 70 dB SPL at 8 kHz] as a function of frequency. As expected, strong peaks were observed only at the frequency corresponding to the stimulus with the magnitude increasing with increasing sound pressure level. The magnitude at 4 kHz [Figs. 4(a) and 4(b)] increased from 1 to 7 nm for 50 and 70 dB SPL, respectively. At 8 kHz, the magnitude increased from 6 to 55 nm for 50 and 70 dB SPL, respectively. The larger magnitude at equal sound pressure level for 8 kHz stimulation over 4 kHz stimulation was expected based on the fact that 4 kHz represents the lower edge of the hearing range in a mouse. We also can glean a sense of the phase sensitivity in a biological sample using the noise floor on either side of the signal peaks in Fig. 4. Excluding the frequency of the peaks, the mean and standard deviation over all four traces was 20.1 ± 10.6 pm.
Fig. 4.
Vibration magnitudes of the manubrium in ex vivo mouse middle ear. The vibration magnitudes were acquired with 10,000 A-scans with respect to the different sinusoidal frequencies and intensities [(a) 50 dB SPL at 4 kHz; (b) 70 dB SPL at 4 kHz; (c) 50 dB SPL at 8 kHz; (d) 70 dB SPL at 8 kHz] as a function of frequency. The maximum vibration magnitudes were (a) ~1 nm; (b) ~7 nm; (c) ~6 nm; (d) and ~55 nm.
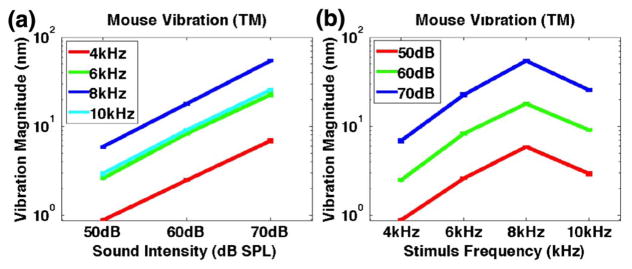
Figure 5 summarizes results over a wider range of stimulus frequencies and sound pressure levels. In total, 12 different sinusoidal stimuli were presented to the mouse: 50, 60, and 70 dB SPL at 4, 6, 8, and 10 kHz. Only the magnitude at the stimulus frequency is plotted in Fig. 5. Figure 5(a) shows the linear relationship between the sound pressure level and vibration magnitude at all frequencies measured; thus, the expected response of the middle ear. Figure 5(b) shows the vibrational magnitude as a function of the stimulus frequency. As expected, the smallest response was measured at the lowest frequency, 4 kHz. There was clear evidence of a bandpass filter response with a peak near 8 kHz. This is consistent with the findings of a recent study [16] using laser Doppler vibrometry to measure sound-induced vibrations in the malleus in the C57BL mouse.
Fig. 5.
Vibration magnitudes of ex vivo mouse middle ear as a function of (a) sound intensity and (b) stimulus frequency.
The use of the prototype VT-DBR laser source has permitted the development of a PhOCT system with near shot-noise-limited phase sensitivity. The highly linear and repeatable sweeps of the laser obviated the need for the typical measures necessary to stabilize a swept-source-based PhOCT system. This advance greatly simplifies the system design and frees up system resources. While we have demonstrated phase stability in the context of PhOCT and vibrometry, the findings also are important for other extensions of OCT that directly utilize the interferometric phase, e.g., Doppler OCT, phase-variance OCT, photothermal OCT, and magneto-motive OCT.
Acknowledgments
We would like to thank Jason Ensher, Michael Minneman, and Michael Crawford for helpful discussions. This work was supported by a grant from the Department of Defense (CDMRP DM090212).
Footnotes
OCIS codes: (110.4500) Optical coherence tomography; (120.5050) Phase measurement; (120.7280) Vibration analysis; (140.5960) Semiconductor lasers.
References
- 1.Sepehr A, Djalilian HR, Chang JE, Chen ZP, Wong BJF. Laryngoscope. 2008;118:1449. doi: 10.1097/MLG.0b013e318173dd6c. [DOI] [PMC free article] [PubMed] [Google Scholar]
- 2.Subhash HM, Davila V, Sun H, Nguyen-Huynh AT, Nuttall AL, Wang RK. J Biomed Opt. 2010;15:036024. doi: 10.1117/1.3456554. [DOI] [PMC free article] [PubMed] [Google Scholar]
- 3.Gao SS, Xia A, Yuan T, Raphael PD, Shelton RL, Applegate BE, Oghalai JS. Opt Express. 2011;19:15415. doi: 10.1364/OE.19.015415. [DOI] [PMC free article] [PubMed] [Google Scholar]
- 4.Nguyen CT, Jung W, Kim J, Chaney EJ, Novak M, Stewart CN, Boppart SA. Proc Natl Acad Sci USA. 2012;109:9529. doi: 10.1073/pnas.1201592109. [DOI] [PMC free article] [PubMed] [Google Scholar]
- 5.Chen FY, Zha DJ, Fridberger A, Zheng JF, Choudhury N, Jacques SL, Wang RK, Shi XR, Nuttall AL. Nat Neurosci. 2011;14:770. doi: 10.1038/nn.2827. [DOI] [PMC free article] [PubMed] [Google Scholar]
- 6.Gao SS, Raphael PD, Wang R, Park J, Xia AP, Applegate BE, Oghalai JS. Biomed Opt Express. 2013;4:230. doi: 10.1364/BOE.4.00230. [DOI] [PMC free article] [PubMed] [Google Scholar]
- 7.Gao SS, Wang R, Raphael PD, Moayedi Y, Groves AK, Zuo J, Applegate BE, Oghalai JS. J Neurophysiol. 2014 doi: 10.1152/jn.00306.2014. [DOI] [PMC free article] [PubMed] [Google Scholar]
- 8.Choma MA, Ellerbee AK, Yang CH, Creazzo TL, Izatt JA. Opt Lett. 2005;30:1162. doi: 10.1364/ol.30.001162. [DOI] [PubMed] [Google Scholar]
- 9.Srinivasan VJ, Huber R, Gorczynska I, Fujimoto JG, Jiang JY, Reisen P, Cable AE. Opt Lett. 2007;32:361. doi: 10.1364/ol.32.000361. [DOI] [PubMed] [Google Scholar]
- 10.Manapuram RK, Manne VGR, Larin KV. J Appl Phys. 2009;105:102040. [Google Scholar]
- 11.Choi W, Potsaid B, Jayaraman V, Baumann B, Grulkowski I, Liu JJ, Lu CD, Cable AE, Huang D, Duker JS, Fujimoto JG. Opt Lett. 2013;38:338. doi: 10.1364/OL.38.000338. [DOI] [PMC free article] [PubMed] [Google Scholar]
- 12.Braaf B, Vermeer KA, Sicam VADP, van Zeeburg E, van Meurs JC, de Boer JF. Opt Express. 2011;19:20886. doi: 10.1364/OE.19.020886. [DOI] [PubMed] [Google Scholar]
- 13.Bonesi M, Minneman MP, Ensher J, Zabihian B, Sattmann H, Boschert P, Hoover E, Leitgeb RA, Crawford M, Drexler W. Opt Express. 2014;22:2632. doi: 10.1364/OE.22.002632. [DOI] [PubMed] [Google Scholar]
- 14.Van der Jeught S, Dirckx JJ, Aerts JR, Bradu A, Podoleanu AG, Buytaert JA. J Assoc Res Otolaryngol. 2013;14:483. doi: 10.1007/s10162-013-0394-z. [DOI] [PMC free article] [PubMed] [Google Scholar]
- 15.Szkulmowski M, Grulkowski I, Szlag D, Szkulmowska A, Kowalczyk A, Wojtkowski M. Opt Express. 2009;17:14281. doi: 10.1364/oe.17.014281. [DOI] [PubMed] [Google Scholar]
- 16.Dong W, Varavva P, Olson ES. Hear Res. 2013;301:27. doi: 10.1016/j.heares.2012.11.015. [DOI] [PMC free article] [PubMed] [Google Scholar]


