

Abstract
Context
The mechanisms mediating the short- and long-term improvements in glucose homeostasis following bariatric/metabolic surgery remain incompletely understood.
Objective
To investigate whether a reduction in adipose tissue inflammation plays a role in the metabolic improvements seen after bariatric/metabolic surgery, both in the short-term and longer-term.
Design
Fasting blood and subcutaneous abdominal adipose tissue were obtained before (n=14), at one month (n=9), and 6–12 months (n=14) after bariatric/metabolic surgery from individuals with obesity who were not on insulin or anti-diabetes medication. Adipose tissue inflammation was assessed by a combination of whole-tissue gene expression and flow cytometry-based quantification of tissue leukocytes.
Results
One month after surgery, body weight was reduced by 13.5±4.4 kg (p<0.001), with improvements in glucose tolerance reflected by a decrease in area-under-the-curve (AUC) glucose in 3-h oral glucose tolerance tests (−105±98 mmol/L*min; p=0.009) and enhanced pancreatic β-cell function (insulinogenic index: +0.8±0.9 pmol/mmol; p=0.032), but no change in estimated insulin sensitivity (Matsuda insulin sensitivity index [ISI]; p=0.720). Furthermore, although biomarkers of systemic inflammation and pro-inflammatory gene expression in adipose tissue remained unchanged, the number of neutrophils increased in adipose tissue 15–20 fold (p<0.001), with less substantial increases in other leukocyte populations. By the 6–12 month follow-up visit, body weight was reduced by 34.8±10.8 kg (p<0.001) relative to baseline, and glucose tolerance was further improved (AUC glucose −276±229; p<0.001) along with estimated insulin sensitivity (Matsuda ISI: +4.6±3.2; p<0.001). In addition, improvements in systemic inflammation were reflected by reductions in circulating C-reactive protein (CRP; −2.0±5.3 mg/dL; p=0.002), and increased serum adiponectin (+1,358±1,406 pg/mL; p=0.003). However, leukocyte infiltration of adipose tissue remained elevated relative to baseline, with pro-inflammatory cytokine mRNA expression unchanged, while adiponectin mRNA expression trended downward (p=0.069).
Conclusion
Both the short- and longer-term metabolic improvements following bariatric/metabolic surgery occur without significant reductions in measures of adipose tissue inflammation, as assessed by measuring the expression of genes encoding key mediators of inflammation and by flow cytometric immunophenotyping and quantification of adipose tissue leukocytes.
Keywords: adipose tissue inflammation, bariatric surgery, metabolic surgery, insulin resistance
1. Introduction
The ongoing obesity pandemic represents a profound public health crisis with far-reaching societal and economic consequences. In addition to incurring greater healthcare costs [1], individuals with obesity have shorter life expectancies associated with increased risk for developing cardiovascular disease, many forms of cancer, and diabetes [2–5]. A major link between these undesirable outcomes and obesity is a state of chronic, low-grade inflammation, characterized by increased circulating levels of the acute phase protein C-reactive protein (CRP) and pro-inflammatory cytokines such as the interleukins (IL) IL-1β and IL-6 [6–8].
This state of chronic, low-grade inflammation is thought to result at least in part from low-grade chronic inflammatory processes in the expanded adipose tissue [9]. Although the specific cause of this inflammation is unknown, it appears to occur in response to the physiological stress associated with overfeeding [10, 11], wherein adipose tissue must expand to accommodate this nutrient excess. Adipose tissue inflammation is defined by the recruitment and accumulation of leukocytes in adipose tissue [12–14]. Once present in that tissue, these cells may become activated by the interstitial milieu [11] or other factors, resulting in the production and release of pro-inflammatory cytokines [15]. Several of these cytokines, such as tumor necrosis factor (TNF)-α and IL-1β are known to antagonize insulin action [9, 16], enhance lipolysis [2, 8, 17], and affect adipocyte secretion of adiponectin, leptin, and resistin [2, 6, 12, 17, 18]. It is through this process that adipose tissue inflammation is linked to insulin resistance and lipid accumulation in the liver and skeletal muscle, thereby promoting systemic insulin resistance and inflammation [17]. Despite abundant evidence for this paradigm in rodent models, there remains a paucity of direct evidence correlating adipose tissue inflammation with adiposity and insulin resistance in humans.
Because of its striking ability to effectively reverse metabolic disease [5, 19], bariatric/metabolic surgery serves as an intriguing model to study these relationships. Systemically, bariatric/metabolic surgery reduces circulating levels of pro-inflammatory markers CRP and IL-6, but not typically before six months [20–25]. Importantly, patients at this stage have lost substantial body weight [5]. Similarly, subcutaneous adipose tissue expression of CRP, IL-6, TNFα, and many other pro-inflammatory genes have been shown to decline six months after surgery [20–22, 26, 27]. However, the onset of metabolic improvements associated with bariatric/metabolic surgery is rapid, usually within days [5, 19]. We have recently shown that modest (7%) weight loss from Roux-en-Y gastric bypass (RYGB) surgery or an intensive lifestyle modification did not reduce measures of adipose tissue inflammation [28], and therefore was unable to explain the rapid metabolic improvements that occur within days after this operation. However, it remains unclear as to whether reductions in adipose tissue inflammation may contribute to further improvements in insulin sensitivity and glucose tolerance that occur with greater weight loss following bariatric/metabolic surgery.
The purpose of this investigation was to better define the relationships between leukocyte infiltration and activation in adipose tissue and systemic inflammation, adiposity, and insulin resistance, in the context of substantial weight loss following bariatric/metabolic surgery.
2. RESEARCH DESIGN AND METHODS
2.1 Study design and subjects
Seventeen men and women with obesity, scheduled for bariatric/metabolic surgery, either RYGB (n=7) at the University of Washington Medical Center (UWMC) or vertical sleeve gastrectomy (VSG; n=10) at Puget Sound Surgery Center, were enrolled into the study between June 2011 and May 2013. Participant body mass index (BMI) at enrollment ranged from 36.0–62.6 kg/m2. Exclusion criteria included smoking; pregnancy or plans to become pregnant in the ensuing 12 months; use of insulin or any other antidiabetic medications; any chronic inflammatory condition; or the use of selective serotonin-reuptake inhibitors, lipid-lowering drugs, β-blockers, glucocorticoids, or anabolic steroids.
2.2 Clinical procedures
Subjects completed up to three outpatient clinic visits at the UWMC Clinical Research Center. The first (baseline) visit was scheduled in the two weeks prior to surgery. A second, optional study visit was performed 4–6 weeks after surgery (‘1-month visit’), and a third visit was conducted 6–12 months after surgery (’12-month visit’). Three participants withdrew because they were unable or unwilling to complete all study procedures. Of the 14 subjects who completed the study, nine elected to participate in the optional 1-month clinic visit. Procedures for all study visits included anthropometric measurements (height, weight, waist and hip circumference) for calculation of BMI and the body adiposity index (BAI; [29]), a fasting blood draw, and a 3-hour oral glucose tolerance test (OGTT) with blood collected at 0, 10, 20, 30, 60, 90, 120, and 180 min. As the risk of post-operative hypoglycemia and dumping syndrome is elevated among RYGB recipients, 45 g of glucose was administered as a beverage in all OGTT (rather than the typical 75 g), including at the pre-surgery visits, to reduce the likelihood of these adverse events. Abdominal subcutaneous adipose tissue samples were collected at surgery and again at each of the post-surgery study visits. At follow-up visits, adipose tissue was obtained by needle aspiration biopsy, as described previously [30].
The Institutional Review Board at the Fred Hutchinson Cancer Research Center (FHCRC) approved all study procedures. All participants provided written informed consent. Adverse events were generally mild, consisting of bruises and skin discolorations from the adipose tissue biopsies or phlebotomy, and mild cases of hypoglycemia and/or dumping syndrome during the OGTT after surgery.
2.3 Sample collection and processing
Following collection, adipose tissue was first rinsed with sterile PBS. Several pieces were flash frozen on dry ice for mRNA gene expression analysis, and the remainder was transferred to a tube containing 20 mL of PBS with 1% BSA. Tissues were then immediately transported to the FHCRC for processing and analysis by flow cytometry. Fasting blood and OGTT samples were drawn from an intravenous line, placed on ice, spun at ~1,000 × g immediately after collection for 10 min at 4°C, with the exception of serum tubes, which was allowed to clot at room temperature for 20 min. Serum and EDTA-plasma were stored at −70°C until analyses. CRP, IL-6, and adiponectin measures in fasting blood were used to assess systemic inflammation. Glucose and insulin measures from OGTT samples were used to assess glucose tolerance (fasting glucose, 120 min glucose, area-under-the-curve [AUC] glucose during 3-hour OGTT), estimated insulin sensitivity (homeostasis model assessment insulin resistance index [HOMA-IR] [31] and Matsuda insulin sensitivity index [ISI] [32]), and pancreatic β-cell function (insulinogenic index [IGI] [33] and oral disposition index [DI] [34]), based on the spreadsheet available at http://mmatsuda.diabetes-smc.jp/MIndex.html. Adipose tissue inflammation was assessed by measuring the absolute and relative abundance of major leukocyte populations in adipose tissue by flow cytometry, and by measuring the mRNA expression of TNFα, IL-1β, IL-6 and adiponectin.
2.4 Laboratory methods
Plasma concentrations of glucose, insulin, and high sensitivity CRP were measured at the UW Northwest Lipid Research Laboratory, Seattle, Washington. Glucose was measured on a Hitachi 917 autoanalyzer (Boehringer Mannheim, Mannheim, Germany), insulin by immunoenzymatic assay on AIA 600 II autoanalyzers (Tosoh Bioscience Inc., San Francisco, CA), and CRP by immunonephelometry using a Behring Nephelometer II (Behring Diagnostics, Somerville, NJ).
Total adiponectin was measured by ELISA (Linco/Millipore, Billerica, MA), and IL-6 by high sensitivity ELISA (R&D systems, Minneapolis, MN). All ELISA measurements were performed in triplicate, and all samples from each subject were analyzed on the same plate. Intra- and inter-assay coefficients of variance for these assays were below 10% and 15%, respectively.
2.5 Immunophenotyping of adipose tissue stromal vascular cells
Subcutaneous adipose tissue was digested and labeled for flow cytometric analysis, as described previously [35]. Briefly, the adipose tissue was digested using Collagenase I (Worthington, Lakewood, NJ; final concentration 1.0 mg/mL) in PBS with 50 U/mL DNAse I for 60 min at 37°C. After lysing red blood cells and separating the stromal vascular cells (SVC) from adipocytes, the SVC were labeled using a combination of directly conjugated primary antibodies to identify, characterize, and quantify leukocyte populations. Selected markers included the pan leukocyte marker CD45; CD15 and CD16 for neutrophils; CD1c, CD11c, CD14, and CD206 for adipose tissue macrophages (ATM) and dendritic cells; and CD3, CD4, CD8 for T cells. All antibodies were purchased from BD Pharmagen (San Jose, CA), Beckman Coulter (Brea, CA) or BioLegend (San Diego, CA). Samples were analyzed immediately following labeling using a LSRII flow cytometer (Beckton Dickinson, Franklin Lakes, NJ) to collect up to 30,000 events in a broad gate defined by forward- and side-scatter attributes. Analysis was performed with FlowJo software, version 9.3.2 (TreeStar, Ashland, OR). Live cells were defined by fluorescence levels associated with the lower uptake of 4′,6-diamidino-2-phenylindole, 2HCl (DAPI), a reactive dye that binds strongly to A-T rich regions in DNA.
2.6 Adipose tissue gene expression analysis
Total RNA was extracted from whole adipose tissue using the RNeasy Lipid Tissue kit (Qiagen, Hilden, Germany) and quantified using RiboGreen (Invitrogen Corp., Carlsbad, CA). cDNA synthesis was carried out on ~1 μg of total RNA using the RETROscript® Kit (Applied Biosystems, Austin, TX) and PCR performed using pre-designed TaqMan® Gene Expression Assays (Applied Biosystems) on an ABI Prism® 7900HT. Gene targets included adiponectin, IL-6, IL-1β, and TNFα. β-glucuronidase and 18s rRNA were measured as housekeeping genes, as they have previously been shown to be stably expressed in adipose tissue across different conditions [36]. A normalization factor based on these two genes was calculated using the method proposed by Vandesompele et al. [37], and was applied to all target genes.
2.7 Statistics
Data are presented as means ± standard deviation or medians (25th, 75th percentiles). All statistical analyses were performed using the Statistical Package for the Social Sciences, version 21 (SPSS Inc., Chicago, IL). The distribution of variables was analyzed by checking histograms and normal plots of the data, and normality was tested by Kolmogorov-Smirnov and Shapiro-Wilk tests. All statistical tests were initially conducted on non log-transformed variables. If the standardized residuals were not normally distributed, the data were log-transformed and the statistical tests repeated on transformed data. Variables that were log-transformed included fasting plasma glucose and insulin, HOMA-IR, AUC glucose, 120 min glucose, Matsuda ISI, plasma CRP, IL-6 and adiponectin, adipose tissue expression of TNFα, IL-1β, IL-6, and adiponectin mRNA, and the adipose tissue leukocyte populations of neutrophils, dendritic cells, ATM and CD11c+ ATM, CD4+ and CD8+ T cell populations normalized per gram of adipose tissue, as well as neutrophils and CD4+ and CD8+ T cells expressed as a percentage of CD45+ cells, and the CD4+/CD8+ ratio. Changes over time in study variables between baseline and the 1-month follow up, and baseline and the 12-month follow up, were compared by repeated measures analysis of variance (RM-ANOVA). A secondary analysis was carried out with adjustment for changes in weight to determine the relative contribution of weight loss to any significant findings. For all analyses, several measures were used to assess ‘systemic inflammation’ and ‘adipose tissue inflammation’. Therefore, we did not adjust for multiple testing, but instead interpreted and report all such data together (i.e., one single significantly changed variable was not considered indicative of a change in the overall biological process in the absence of consistent changes in related variables). The level of significance was set to p<0.05 for all analyses.
3. RESULTS
3.1 Rapid improvements in metabolic status following bariatric/metabolic surgery occur in spite of increased leukocyte infiltration of subcutaneous adipose tissue
The 1-month post-operative assessment consisted of nine participants, three with RYGB and six with VSG, who were studied 38±4 days after surgery (mean±standard deviation). Subjects had lost 13.5±4.4 kg (mean±standard deviation, p<0.001), with comparable reductions in BMI (−4.8±1.2 kg/m2; p<0.001) and BAI (−4.2±2.4 %; p=0.001; Table 1). Fasting glucose did not change significantly (p=0.109), while fasting insulin (p=0.090) and HOMA-IR (p=0.078) tended to be reduced. Glucose tolerance was markedly improved (Table 1 and Figure 1A), with significant reductions in both AUC glucose (−105±98 mmol/L*min; p=0.009) and 120-min glucose level during OGTT (−1.2±1.2 mmol/L; p=0.020; Table 1). Insulin levels during the OGTT were elevated relative to baseline (Figure 1B), and there was no change in the Matsuda ISI (p=0.720). Improvements in beta-cell function were reflected by increases in the IGI by 0.8±0.9 (p=0.032), which led to an increase in the DI of 2.9±1.9 (p=0.002; Table 1).
Table 1.
Comparison of clinical and biological parameters between baseline and follow up 1 month after bariatric/metabolic surgery (n=9 unless otherwise noted).1
| Baseline | 1-month follow up | P(time) | |
|---|---|---|---|
| Weight (kg) | 132.6 ± 28.6 | 119.1 ± 24.9 | <0.001 |
| BMI (kg/m2) | 47.7 ± 7.5 | 42.8 ± 6.5 | <0.001 |
| Body Adiposity Index (%) | 49.6 ± 7.3 | 45.4 ± 7.5 | 0.001 |
| Fasting Plasma Glucose (mmol/L) | 5.4 (5.2 – 5.7) | 5.1 (5.0 – 5.6) | 0.109 |
| Fasting Plasma Insulin (μU/L) | 10.9 (9.6 – 16.0) | 9.6 (6.1 – 10.9) | 0.090 |
| HOMA-IR | 2.7 (2.1 – 3.7) | 2.2 (1.3 – 2.6) | 0.078 |
| 120 min Glucose (mmol/L, OGTT) | 6.7 (5.7 – 7.5) | 4.7 (4.2 – 6.9) | 0.020 |
| AUC Glucose (mmol/L*min, OGTT) | 1,261 (1,147 – 1,349) | 1,118 (1,037 – 1,194) | 0.009 |
| Insulinogenic Index (pmol/mmol) | 1.4 ± 0.6 | 2.2 ± 0.9 | 0.032 |
| Matsuda Index | 3.4 (1.9 – 4.8) | 3.5 (2.5 – 4.7) | 0.720 |
| Oral Disposition Index | 4.2 ± 1.4 | 7.1 ± 1.8 | 0.002 |
| Fasting Plasma CRP (mg/L) | 2.2 (1.4 – 4.8) | 2.0 (0.8 – 3.3) | 0.421 |
| Fasting Plasma IL-6 (pg/mL) | 1.7 (1.6 – 3.4) | 1.7 (1.4 – 3.3) | 0.875 |
| Fasting Plasma Adiponectin (pg/mL) | 6,214 (3,198 – 8,007) | 5,438 (4,512 – 8,508) | 0.744 |
| SQAT TNFα mRNA (copies/ng RNA) | 2.6 (2.0 – 2.9) | 2.9 (2.6 – 3.7) | 0.380 |
| SQAT IL-1β mRNA (copies/ng RNA) | 2.1 (1.5 – 2.3) | 2.4 (1.0 – 2.8) | 0.530 |
| SQAT IL-6 mRNA (copies/ng RNA) | 1.8 (1.3 – 2.6) | 2.2 (1.7 – 2.4) | 0.928 |
| SQAT Adiponectin mRNA (copies/ng RNA) | 2,981 (2,328 – 4,345) | 2,604 (2,109 – 3,248) | 0.219 |
| CD15+CD16+ Neutrophils (n=8): | |||
| per g SQAT | 14,492 (7,435 – 18,601) | 146,313 (83,039 – 373,945) | <0.001 |
| as % of CD45+ fraction | 5.8 (4.8 – 7.4) | 24.9 (15.6 – 47.9) | <0.001 |
| CD1c+CD11c+ Dendritic cells (n=7): | |||
| per g SQAT | 8,082 (3,307 – 11,098) | 9,275 (4,147 – 12,818) | 0.963 |
| as % of CD45+ fraction | 2.4 ± 1.2 | 1.4 ± 0.9 | 0.044 |
| CD14+CD206+ ATM (n=8): | |||
| per g SQAT | 26,502 (14,452 – 32,973) | 61,605 (26,093 – 103,110) | 0.105 |
| as % of CD45+ fraction | 11.3 ± 5.5 | 9.9 ± 6.1 | 0.614 |
| CD14+CD206+CD11c+ ATM (n=8): | |||
| per g SQAT | 7,318 (5,272 – 12,564) | 13,651 (8,209 – 45,262) | 0.167 |
| as % of CD45+ fraction | 4.0 ± 2.1 | 3.3 ± 2.3 | 0.429 |
| CD3+CD4+ T cells (n=8): | |||
| per g SQAT | 24,262 (17,567 – 48,297) | 65,810 (35,646 – 74,146) | 0.027 |
| as % of CD45+ fraction | 10.8 (8.3 – 16.7) | 9.2 (6.9 – 10.5) | 0.154 |
| CD3+CD8+ T cells (n=8): | |||
| per g SQAT | 18,116 (10,376 – 27,316) | 45,588 (14,990 – 65,832) | 0.056 |
| as % of CD45+ fraction | 7.8 (5.3 – 8.2) | 4.7 (3.2 – 6.5) | 0.067 |
| CD4+/CD8+ T cell ratio (n=8) | 1.5 (1.0 – 2.5) | 1.7 (1.5 – 2.0) | 0.551 |
Values are means ± standard deviation for normally distributed data or medians (25th, 75th percentiles) for non-normally distributed, log-transformed data. P-values are based repeated measures analysis of variance (ANOVA). HOMA-IR, homeostasis model assessment-insulin resistance (index); CRP, C-reactive protein; IL, interleukin; OGTT, oral glucose tolerance test; TNF, tumor necrosis factor; SQAT, subcutaneous adipose tissue; ATM, adipose tissue macrophage.
Figure 1.
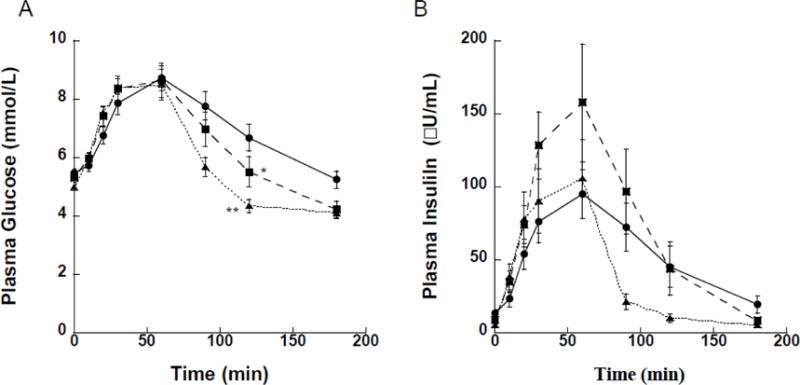
Glucose (A) and insulin (B) concentrations during oral glucose tolerance tests (OGTT) performed at baseline (●), and at one (■) and 12 (▲) months after bariatric/metabolic surgery. (A) Significant reductions in AUC glucose were observed at both one month (p=0.009) and 12 months (p<0.001) relative to baseline (pre-surgery). Glucose concentrations at the 120 min time point were similarly reduced at one month (*, p=0.020) and 12 months (**, p<0.001) relative to baseline (no statistical tests were conducted at other time points during the OGTT). (B) The rise in insulin secretion in the first 30 min relative to the rise in glucose concentrations (i.e., the insulinogenic index) was greater at one month (p=0.032) compared to baseline, but returned to baseline levels with a greater increase in insulin sensitivity by the 12-month time point.
Inflammation was assessed both systemically and in adipose tissue at the 1-month postoperative follow-up visit. Relative to baseline, there were no significant changes in the circulating inflammatory markers CRP (p=0.421) and IL-6 (p=0.875), or in the plasma concentration of the insulin-sensitizing hormone adiponectin (p=0.744), (Table 1 and Figure 2A). In adipose tissue, there were no differences in mRNA expression levels for TNFα (p=0.380), IL-6 (p=0.928), IL-1β (p=0.530), or adiponectin (p=0.219) during this same time frame (Table 1 and Figure 2B). However, we did observe large, significant increases in the leukocyte populations within adipose tissue. Specifically, the number of neutrophils increased roughly 15–20 fold (p<0.001), while ATM (p=0.105), and the CD4+ (p=0.027) and CD8+ (p=0.056) T cell populations approximately doubled (Table 1).
Figure 2.
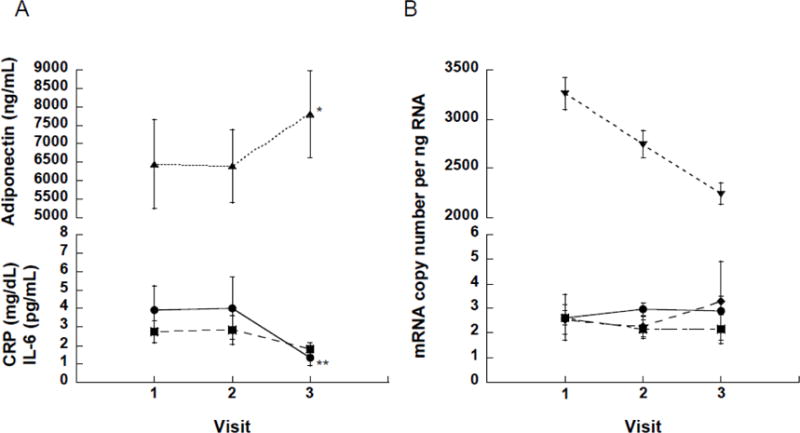
Changes in circulating plasma markers and mRNA expression in subcutaneous adipose tissue from baseline (visit 1) to one (visit 2) and 12 (visit 3) months after bariatric/metabolic surgery. (A) No change in circulating CRP (●), IL-6 (■), and adiponectin (▲) within the first month of surgery. By 12 months, relative to baseline levels, circulating adiponectin exhibited a marked increase (*, p=0.003), while CRP (**, p=0.002) but not IL-6 (p=0.183) concentrations were significantly reduced. (B) There were no significant changes in mRNA expression patterns for TNFα (●), IL-1β (◆), IL-6 (■) and adiponectin (▼) in subcutaneous adipose tissue from baseline out to 12 months post-surgery, except for a downward trend in adiponectin expression (p=0.069).
3.2 Longer-term improvements in metabolic status following bariatric/metabolic surgery are not associated with reduced subcutaneous adipose tissue inflammation
Four RYGB and 10 VSG patients completed the 12-month post-surgery visit, which occurred 243±60 days after surgery. Weight loss at 12 months after surgery averaged −34.8±10.8 kg relative to pre-surgery weight (p<0.001; Table 2). Body mass index (−12.6±3.4 kg/m2; (p<0.001) and BAI (−10.7±3.7 %; p<0.001) were similarly reduced. In addition, progressive improvements in metabolic status were observed. Compared to the baseline/pre-surgery visit, fasting plasma glucose was reduced (−0.8±0.9 mmol/L; p=0.003), as were insulin (−8.9±6.0 μU/mL; p<0.001) and HOMA-IR (−2.7±2.4; p<0.001). Glucose tolerance at 12 months was significantly improved over baseline (Figure 1A), with AUC glucose reduced by 276±229 mmol/L*min (p=<0.001) and 120-min glucose was reduced by 2.4±1.4 mmol/L (p<0.001). There was a clear improvement in Matsuda ISI (+4.6±3.2; p<0.001), associated with a decline in secreted insulin in response to oral glucose challenge (Figure 1B), leading to an overall increase in the DI of 4.3±3.1 (p<0.001; Table 2).
Table 2.
Comparison of clinical and biological parameters between baseline and follow up 12 months after bariatric/metabolic surgery (n=14 unless otherwise noted).2
| Baseline | 12-month follow up | P(time) | |
|---|---|---|---|
| Weight (kg) | 131.7 ± 27.1 | 96.9 ± 18.0 | <0.001 |
| BMI (kg/m2) | 46.2 ± 7.5 | 34.0 ± 4.5 | <0.001 |
| Body Adiposity Index (%) | 47.8 ± 8.5 | 37.1 ± 5.8 | <0.001 |
| Fasting Plasma Glucose (mmol/L) | 5.7 (5.2 – 6.0) | 5.0 (4.7 – 5.3) | 0.003 |
| Fasting Plasma Insulin (μU/L) | 11.3 (9.6 – 17.5) | 4.3 (2.5 – 7.2) | <0.001 |
| HOMA-IR | 2.9 (2.1 – 4.6) | 1.0 (0.5 – 1.6) | <0.001 |
| 120 min Glucose (mmol/L, OGTT) | 6.6 (5.9 – 7.5) | 4.5 (3.8 – 5.0) | <0.001 |
| AUC Glucose (mmol/L*min, OGTT) | 1,310 (1,147 – 1,458) | 1,085 (975 – 1,138) | <0.001 |
| Insulinogenic Index (pmol/mmol) | 1.2 ± 0.6 | 1.2 ± 0.7 | 0.854 |
| Matsuda Index | 3.3 (1.9 – 4.8) | 7.4 (4.9 – 9.2) | <0.001 |
| Oral Disposition Index | 3.5 ± 1.6 | 7.8 ± 3.1 | <0.001 |
| Fasting Plasma CRP (mg/L) | 4.6 (1.7 – 6.3) | 1.5 (0.6 – 2.6) | 0.002 |
| Fasting Plasma IL-6 (pg/mL) | 1.8 (1.5 – 3.0) | 1.4 (1.2 – 2.2) | 0.183 |
| Fasting Plasma Adiponectin (pg/mL) | 4,608 (3,024 – 8,007) | 5,807 (5,095 – 8,224) | 0.003 |
| SQAT TNFα mRNA (copies/ng RNA) | 2.6 (2.2 – 3.8) | 2.8 (1.7 – 5.0) | 0.651 |
| SQAT IL-1β mRNA (copies/ng RNA) | 1.8 (1.5 – 2.3) | 2.5 (0.9 – 5.2) | 0.793 |
| SQAT IL-6 mRNA (copies/ng RNA) | 2.0 (1.3 – 2.6) | 2.1 (1.2 – 2.9) | 0.535 |
| SQAT Adiponectin mRNA (copies/ng RNA) | 2,816 (1,839 – 4,086) | 2,328 (2,073 – 2,688) | 0.069 |
| CD15+CD16+ Neutrophils (n=13): | |||
| per g SQAT | 12,019 (5,845 – 21,287) | 141,006 (92,300 – 194,407) | <0.001 |
| as % of CD45+ fraction | 5.1 (3.9 – 7.4) | 12.7 (8.6 – 38.4) | <0.001 |
| CD1c+CD11c+ Dendritic cells (n=12): | |||
| per g SQAT | 7,167 (3,722 – 11,172) | 20,976 (12,723 – 27,874) | 0.015 |
| as % of CD45+ fraction | 2.7 ± 1.1 | 1.8 ± 1.0 | 0.032 |
| CD14+CD206+ ATM (n=13): | |||
| per g SQAT | 20,948 (13,808 – 32,988) | 62,124 (20,222 – 114,951) | 0.019 |
| as % of CD45+ fraction | 10.2 ± 4.6 | 7.3 ± 4.1 | 0.092 |
| CD14+CD206+CD11c+ ATM (n=13): | |||
| per g SQAT | 7,477 (3,722 – 11,172) | 9,363 (12,723 – 27,874) | 0.116 |
| as % of CD45+ fraction | 3.8 ± 2.2 | 1.9 ± 1.2 | 0.01 |
| CD3+CD4+ T cells (n=12): | |||
| per g SQAT | 24,519 (17,567 – 48,297) | 84,178 (57,838 – 114,757) | 0.002 |
| as % of CD45+ fraction | 11.0 (8.3 – 13.7) | 9.0 (7.4 – 10.5) | 0.138 |
| CD3+CD8+ T cells (n=12): | |||
| per g SQAT | 18,116 (12,237 – 28,520) | 52,524 (32,760 – 92,953) | 0.006 |
| as % of CD45+ fraction | 7.7 (6.0 – 9.1) | 6.1 (4.3 – 6.9) | 0.08 |
| CD4+/CD8+ T cell ratio (n=12) | 1.3 (1.0 – 2.2) | 1.7 (1.5 – 1.8) | 0.441 |
Values are means ± standard deviation for normally distributed data or medians (25th, 75th percentiles) for non-normally distributed, log-transformed data. P-values are based repeated measures analysis of variance (ANOVA). HOMA-IR, homeostasis model assessment-insulin resistance (index); CRP, C-reactive protein; IL, interleukin; OGTT, oral glucose tolerance test; TNF, tumor necrosis factor; SQAT, subcutaneous adipose tissue; ATM, adipose tissue macrophage.
Systemically, circulating CRP had dropped by −2.0±5.3 mg/dL (p=0.002), while plasma adiponectin concentrations had increased by 1,358±1,406 pg/mL (p=0.003) (Figure 2A and Table 2). Interleukin-6 levels remained unchanged from baseline (p=0.183). In contrast, there were no differences in adipose tissue expression of TNFα (p=0.651), IL-1β (p=0.793), or IL-6 (p=0.535) mRNA between baseline and the 12-month follow-up visit (Figure 2B, Table 2). Curiously, adiponectin tissue mRNA levels trended downwards by −658±1,121 copies per ng RNA (p=0.069), despite observed increases in plasma adiponectin concentrations. As with the 1-month post-operative follow-up, the number of immune cells in subcutaneous adipose tissue was significantly elevated relative to pre-surgery levels. Neutrophils rose from just over 12,000 to more than 141,000 per gram of adipose tissue (p<0.001). Similarly, the number of dendritic cells (p=0.015), macrophages (p=0.019), and CD4+ (p=0.002) and CD8+ (p=0.006) T cells all exhibited significant increases over baseline (see Table 2).
Substantial reductions in body weight (−32.1±7.5 kg; p<0.001), BMI (−8.3±2.5 kg/m2; p<0.001), and BAI (−7.2±3.3 %; p<0.001) were observed between the 1-month and 12-month follow-up visits (Supplemental Table 1). Correspondingly, there were further improvements in fasting glucose (reduced from a median of 5.1 [interquartile range 5.0–5.6] to 5.0 [4.9–5.0] mmol/L; p=0.089) and insulin (reduced from 9.6 [6.1–10.9] to 4.2 [2.5–7.2] μU/mL; p=0.036), and HOMA-IR (reduced from 2.2 [1.3–2.6] to 0.9 [0.5–1.6]; p=0.034). Improvements in peripheral insulin sensitivity as measured by Matsuda ISI (7.0 [4.6–9.2] at 12 months versus 3.5 [2.5–4.7] 1-month after surgery; p=0.01) were associated with a decline in the IGI (from 2.2±0.9 to 1.3±0.8; p=0.005), leaving the DI largely unchanged.
Median circulating CRP and IL-6 levels declined from 2.0 (0.8–3.3) to 0.9 (0.5–1.8) mg/L (p=0.024) and 1.7 (1.4–3.3) to 1.5 (1.2–2.2) pg/mL (p=0.04), respectively. Circulating adiponectin levels increased from 5,437 [4,512–8,508] to 5,833 [5,760–9,700] pg/mL (p=0.011). In contrast, there were no significant differences in adipose tissue mRNA expression of the pro-inflammatory cytokines TNFα (p=0.482), IL-6 (p=0.652) and IL-1β (p=0.819), while adiponectin expression tended to decline further (p=0.099). The degree of leukocyte infiltration in adipose tissue remained significantly elevated from baseline but overall did not change to a statistically significant degree relative to the 1-month visit, with the notable exception of a substantial increase in the number of dendritic cells (from 9,469 [4,147–13,495] to 20,524 [8,465–27,874] cells per g of adipose tissue; p=0.008).
3.3 Improvements in metabolic status following bariatric/metabolic surgery appear largely driven by weight loss
As weight change was substantial across all time points of this study we repeated our statistical analyses with an adjustment for changes in body weight. The result of this secondary analysis was that the main effects of ‘time’ in RM-ANOVA were significantly attenuated, and no longer statistically significant, for all study variables previously found to have changed to a statistically significant degree between the baseline and the 1-month or 12-month follow-up visits.
4. Discussion
In this prospective clinical study, we investigated whether the rapid remission of metabolic dysfunction following bariatric/metabolic surgery was associated with a resolution of adipose tissue inflammation. We saw no clear evidence of a reduction in adipose tissue inflammation, as assessed by gene expression analyses and flow cytometric immunophenotyping and quantification of adipose tissue leukocytes, either before or after substantial weight loss, that could explain the metabolic improvements observed in patients following bariatric/metabolic surgery. To the contrary, several key leukocyte populations in adipose tissue exhibited marked increases within the first four postoperative weeks. Moreover, elevated leukocyte numbers persisted for up to 12 months, despite observed further improvements in metabolic health.
The rationale for our approach was based on the presumed causal link between obesity, adipose tissue inflammation, and insulin resistance. For several reasons, bariatric/metabolic surgery presents an intriguing opportunity to study these relationships. Following surgery, individuals typically lose between 25–35% of their pre-surgery body weight within the first 12 months, exhibit rapid improvements in glucose tolerance, and improved insulin sensitivity and reduced systemic inflammation [21–25, 38–44]. These findings are consistent with the prevailing hypothesis that obesity is associated with inflammation, and that adipose tissue inflammation may contribute to the development of insulin resistance. As such, the resolution of adipose tissue inflammation has been proposed as one mechanism by which bariatric/metabolic surgery may improve insulin sensitivity and glucose tolerance.
Systemic inflammation is known to persist at least through the first month following bariatric/metabolic surgery [21, 45]. We similarly observed no decline in markers of systemic inflammation during this time frame, as reported herein and previously [28]. However, within adipose tissue, the data are equivocal. At 12 months postoperatively, expression of the chemoattractant adipokine, chemerin, which regulates adipogenesis, is reduced in both subcutaneous and visceral adipose tissue depots [43]. For other pro-inflammatory cytokines, such as TNFα and IL-6, reductions in adipose tissue mRNA expression have been observed 4–6 months after laparoscopic adjustable gastric banding or RYGB [20, 27]. Even within three months of surgery the expression of genes involved in macrophage recruitment, as well as histological detection of ATM in adipose tissue, have exhibited reductions [46]. Correspondingly, gene expression of the insulin sensitizing adipokine, adiponection, increases during this time frame [47]. Paradoxically, however, while Xu et al. [44] observed improvements at three months after surgery in circulating high-molecular weight adiponectin and 5′ adenosine monophosphate-activated protein kinase (AMPK) activation, along with reductions in malonyl-CoA and oxidative stress in subcutaneous adipose tissue, there were no changes in the expression of inflammatory markers. In addition, two other studies involving morbidly obese bariatric surgery patients observed no significant reductions in the expression of TNFα or IL-6, along with several other key pro-inflammatory markers at either six or 12 months after surgery [21, 22]. We similarly observed no significant reductions in pro-inflammatory gene expression, at either one or 12 months after surgery, as reported herein, and in another recent study comparing 7% weight loss from RYGB versus an intensive lifestyle intervention [28]. Furthermore, in contrast to Cancello et al. [46], Trachta and colleagues [22] reported that the expression of CD68 in adipose tissue, a marker of cells of the myeloid lineage, increased. Likewise, Viardot and colleagues [26] observed an increase in the number of granulocytes and Th1 cells in adipose tissue following bariatric surgery. These data align more closely with our findings in this and our prior study [28], which indicate that leukocyte populations in adipose tissue likely increase after surgery and may remain elevated for considerable time. In a similar vein, at least as it pertains to rapid weight loss, studies involving severe energy restriction or surgery similarly fail to demonstrate biologically meaningful reductions with regard to ATM number [48] or pro-inflammatory gene expression in adipose tissue [44, 49, 50], despite significant improvements in plasma insulin or CRP. While inconsistent, these data collectively support the notion that at least acutely, weight loss does not attenuate inflammatory processes in adipose tissue, in part at least due to the efflux and associated trafficking of lipids [51]. Furthermore, existing evidence suggests that a period of weight stabilization may be required before reductions in pro-inflammatory cytokine gene expression, as well as immune cell number, can consistently be observed [27, 49, 52, 53].
How then do these observations support a link between adipose tissue inflammation and the development of insulin resistance? We previously speculated [28], as also suggested by data from Nannipieri et al. [54], that the very early improvements in glucose tolerance in response to bariatric/metabolic surgery are likely due to improved hepatic insulin sensitivity and pancreatic beta-cell function, while peripheral insulin sensitivity initially remains unchanged. Thus, our previous finding of no reduction in adipose tissue inflammation ~12 days after gastric bypass surgery did not preclude a direct role for adipose tissue inflammation in the etiology of insulin resistance. However, in the present study, we expand on our prior findings by now also demonstrating that the initial increase in adipose tissue inflammation seen in our previous study [28] persists over several months, in a time frame when systemic insulin sensitivity improves dramatically. While subject to some limitations, as discussed below, these new data are hard to reconcile with the evidence from rodent models that strongly implicates adipose tissue inflammation as a causal factor in establishing insulin resistance. This therefore suggests that the link between adipose tissue inflammation and insulin resistance is weaker in humans, or that bariatric/metabolic surgery alters the nature of this relationship.
An emerging hypothesis that might explain the persistent inflammation in adipose tissue with even substantial weight loss is that macrophages, and possibly other immune cells, up regulate the expression of pro-inflammatory mediators in response to exposure to excess fatty acids [11, 51]. In the context of chronically excessive calorie intake and weight gain, macrophages are required to help adipose tissue expand in a healthy fashion [10]. This low-grade pro-inflammatory activation of macrophages and the downstream insulin resistance could therefore be seen as one mechanism through which these cells retard the rapid expansion of adipocytes and associated hypoxic stress [55]. Alternatively, adipocyte lipolysis during calorie restriction-induced weight loss similarly exposes macrophages to elevated levels of free fatty acids. In response, macrophages may remain activated, pro-inflammatory cells as they are buffering and trafficking these lipids [11, 51, 56].
Among the strengths of this study were the thorough assessments of glucose tolerance, the exclusion of individuals using anti-diabetes medications with the potential to confound study endpoints, repeated assessments within individuals over time, and the use of qPCR and flow cytometry to characterize adipose tissue inflammation. Nevertheless, this study had several limitations, including a small sample size, and assessments of pro- and anti-inflammatory gene expression from a single subcutaneous adipose tissue depot. Although it is known that differences in the absolute expression of pro-inflammatory cytokines exist between visceral and subcutaneous adipose tissue in humans, gene expression patterns in both depots are equivalently associated with obesity [43, 57] and metabolic disease [43, 58, 59]. Related to this issue, Dadson et al. [60] observed differences in insulin-stimulated glucose uptake between visceral and subcutaneous adipose tissue depots. However, the relative change in glucose uptake following bariatric/metabolic surgery was similar in both depots [60]. Collectively, these findings suggest that assessments based solely on subcutaneous adipose tissue samples are not likely to grossly misrepresent the underlying processes associated with obesity-driven inflammation and metabolic dysfunction. Although the small sample size prevented subgroup and sensitivity analyses, we observed no consistent trends in gene expression or immune cell infiltration indicative of a reduction in adipose tissue inflammation. In fact, and contrary to predictions, immune cell numbers in adipose tissue increased significantly, and remained elevated, while adiponectin expression declined. All of this collectively argues against a reduction in adipose tissue inflammation. Moreover, there were clear improvements in glucose tolerance and its determinants in this cohort despite the fact that our subjects were likely a metabolically healthier subset of the obese population, as we excluded individuals on insulin or anti-diabetes medications. Importantly, the absence of manifest diabetes among the study cohort eliminated potential confounding by post-bariatric surgery changes in the use of anti-diabetes medicines, likely strengthening our analysis. It is also worth noting that the results related to inflammation of the present study are very consistent with those published recently in a population with manifest T2DM [28]. As such, we feel confident that if the resolution of inflammation in adipose tissue were indeed a contributing factor to the rapid metabolic improvements associated with bariatric/metabolic surgery, we would have observed at least a trend in that direction.
In summary, we detected no reductions in adipose tissue-specific inflammation, as assessed by gene expression analysis and flow cytometric quantification and characterization of adipose tissue leukocytes, despite clear metabolic improvements in glucose homeostasis within the first four weeks following bariatric/metabolic surgery. Moreover, although systemic inflammation was attenuated by 12 months after surgery, there were no signs of a reduction in adipose tissue inflammation, despite substantially increased insulin sensitivity and improved glucose tolerance. Therefore, although improvements in systemic inflammation follow significant weight loss over many months, a reduction in chronic low-grade inflammation of adipose tissue does not appear to be a mechanism by which bariatric/metabolic surgery improves glucose tolerance and insulin sensitivity in humans.
Supplementary Material
Acknowledgments
We would also like to thank Drs. Elena Geamanu, Andrew Wright, Carlos Pellegrini, E. Patchen Dellinger, Saurabh Khandelwal, Brant Oelschlager, Mika Sinanan, and Juan Parra, as well as the nursing staff at the UW Medical Center’s Clinical Research Center for their efforts on behalf of this study. We would also like to thank the participants for their involvement in the study.
Funding Information
This work was supported by National Institutes of Health (NIH) Grant R21 CA143248 (to M.K.), American Diabetes Association (ADA) Grant 7-09-CT-36 (to M.K.), the University of Washington Diabetes Research Center (P30 DK017047), and the University of Washington Institute of Translational Health Sciences (UL1TR000423).
Footnotes
Publisher's Disclaimer: This is a PDF file of an unedited manuscript that has been accepted for publication. As a service to our customers we are providing this early version of the manuscript. The manuscript will undergo copyediting, typesetting, and review of the resulting proof before it is published in its final citable form. Please note that during the production process errors may be discovered which could affect the content, and all legal disclaimers that apply to the journal pertain.
Conflict of Interest Statement
The authors declare no conflict of interest exists.
Author Contributions
MK, KM, DEC, and DRF designed the study; IL and GC: identified and recruited subjects for the main trial; KEF-S and KBR oversaw all clinical visits and conducted adipose tissue biopsies; MK, DKH, and IL: completed statistical analysis of data and the first draft of the manuscript; DKH and JNK: collected/processed biological specimens and carried out the flow cytometry and ELISA analyses; BvY: measured expression of genes in adipose tissue. PSB, RWL and MC recruited participants, performed bariatric surgeries, and collected adipose tissue. All authors contributed to the preparation of the final manuscript.
References
- 1.Arterburn DE, Maciejewski ML, Tsevat J. Impact of morbid obesity on medical expenditures in adults. Int J Obes (Lond) 2005;29:334–9. doi: 10.1038/sj.ijo.0802896. [DOI] [PubMed] [Google Scholar]
- 2.Shoelson SE, Herrero L, Naaz A. Obesity, inflammation, and insulin resistance. Gastroenterology. 2007;132:2169–80. doi: 10.1053/j.gastro.2007.03.059. [DOI] [PubMed] [Google Scholar]
- 3.Berg AH, Scherer PE. Adipose tissue, inflammation, and cardiovascular disease. Circulation research. 2005;96:939–49. doi: 10.1161/01.RES.0000163635.62927.34. [DOI] [PubMed] [Google Scholar]
- 4.Calle EE, Rodriguez C, Walker-Thurmond K, Thun MJ. Overweight, obesity, and mortality from cancer in a prospectively studied cohort of U.S. adults. The New England journal of medicine. 2003;348:1625–38. doi: 10.1056/NEJMoa021423. [DOI] [PubMed] [Google Scholar]
- 5.Buchwald H, Avidor Y, Braunwald E, Jensen MD, Pories W, Fahrbach K, et al. Bariatric surgery: a systematic review and meta-analysis. Jama. 2004;292:1724–37. doi: 10.1001/jama.292.14.1724. [DOI] [PubMed] [Google Scholar]
- 6.Tilg H, Moschen AR. Adipocytokines: mediators linking adipose tissue, inflammation and immunity. Nat Rev Immunol. 2006;6:772–83. doi: 10.1038/nri1937. [DOI] [PubMed] [Google Scholar]
- 7.Maachi M, Pieroni L, Bruckert E, Jardel C, Fellahi S, Hainque B, et al. Systemic low-grade inflammation is related to both circulating and adipose tissue TNFalpha, leptin and IL-6 levels in obese women. Int J Obes Relat Metab Disord. 2004;28:993–7. doi: 10.1038/sj.ijo.0802718. [DOI] [PubMed] [Google Scholar]
- 8.Schenk S, Saberi M, Olefsky JM. Insulin sensitivity: modulation by nutrients and inflammation. The Journal of clinical investigation. 2008;118:2992–3002. doi: 10.1172/JCI34260. [DOI] [PMC free article] [PubMed] [Google Scholar]
- 9.Hotamisligil GS. Inflammation and metabolic disorders. Nature. 2006;444:860–7. doi: 10.1038/nature05485. [DOI] [PubMed] [Google Scholar]
- 10.Wernstedt Asterholm I, Tao C, Morley TS, Wang QA, Delgado-Lopez F, Wang ZV, et al. Adipocyte inflammation is essential for healthy adipose tissue expansion and remodeling. Cell Metab. 2014;20:103–18. doi: 10.1016/j.cmet.2014.05.005. [DOI] [PMC free article] [PubMed] [Google Scholar]
- 11.Kratz M, Coats BR, Hisert KB, Hagman D, Mutskov V, Peris E, et al. Metabolic dysfunction drives a mechanistically distinct proinflammatory phenotype in adipose tissue macrophages. Cell Metab. 2014;20:614–25. doi: 10.1016/j.cmet.2014.08.010. [DOI] [PMC free article] [PubMed] [Google Scholar]
- 12.Xu H, Barnes GT, Yang Q, Tan G, Yang D, Chou CJ, et al. Chronic inflammation in fat plays a crucial role in the development of obesity-related insulin resistance. The Journal of clinical investigation. 2003;112:1821–30. doi: 10.1172/JCI19451. [DOI] [PMC free article] [PubMed] [Google Scholar]
- 13.Weisberg SP, McCann D, Desai M, Rosenbaum M, Leibel RL, Ferrante AW., Jr Obesity is associated with macrophage accumulation in adipose tissue. J ClinInvest. 2003;112:1796–808. doi: 10.1172/JCI19246. [DOI] [PMC free article] [PubMed] [Google Scholar]
- 14.Kintscher U, Hartge M, Hess K, Foryst-Ludwig A, Clemenz M, Wabitsch M, et al. T-lymphocyte infiltration in visceral adipose tissue: a primary event in adipose tissue inflammation and the development of obesity-mediated insulin resistance. Arteriosclerosis, thrombosis, and vascular biology. 2008;28:1304–10. doi: 10.1161/ATVBAHA.108.165100. [DOI] [PubMed] [Google Scholar]
- 15.Zeyda M, Farmer D, Todoric J, Aszmann O, Speiser M, Gyori G, et al. Human adipose tissue macrophages are of an anti-inflammatory phenotype but capable of excessive pro-inflammatory mediator production. Int J Obes (Lond) 2007;31:1420–8. doi: 10.1038/sj.ijo.0803632. [DOI] [PubMed] [Google Scholar]
- 16.Xu H, Hirosumi J, Uysal KT, Guler AD, Hotamisligil GS. Exclusive action of transmembrane TNF alpha in adipose tissue leads to reduced adipose mass and local but not systemic insulin resistance. Endocrinology. 2002;143:1502–11. doi: 10.1210/endo.143.4.8715. [DOI] [PubMed] [Google Scholar]
- 17.Tilg H, Moschen AR. Inflammatory mechanisms in the regulation of insulin resistance. Molecular medicine (Cambridge, Mass. 2008;14:222–31. doi: 10.2119/2007-00119.Tilg. [DOI] [PMC free article] [PubMed] [Google Scholar]
- 18.Hotta K, Funahashi T, Arita Y, Takahashi M, Matsuda M, Okamoto Y, et al. Plasma concentrations of a novel, adipose-specific protein, adiponectin, in type 2 diabetic patients. Arteriosclerosis Thrombosis And Vascular Biology. 2000;20:1595–9. doi: 10.1161/01.atv.20.6.1595. [DOI] [PubMed] [Google Scholar]
- 19.Pories WJ, Swanson MS, MacDonald KG, Long SB, Morris PG, Brown BM, et al. Who would have thought it? An operation proves to be the most effective therapy for adult-onset diabetes mellitus. Annals of surgery. 1995;222:339–50. doi: 10.1097/00000658-199509000-00011. discussion 50–2. [DOI] [PMC free article] [PubMed] [Google Scholar]
- 20.Moschen AR, Molnar C, Geiger S, Graziadei I, Ebenbichler CF, Weiss H, et al. Anti-inflammatory effects of excessive weight loss: potent suppression of adipose interleukin 6 and tumour necrosis factor alpha expression. Gut. 2010;59:1259–64. doi: 10.1136/gut.2010.214577. [DOI] [PubMed] [Google Scholar]
- 21.Pardina E, Ferrer R, Baena-Fustegueras JA, Rivero J, Lecube A, Fort JM, et al. Only C-reactive protein, but not TNF-alpha or IL6, reflects the improvement in inflammation after bariatric surgery. Obes Surg. 2012;22:131–9. doi: 10.1007/s11695-011-0546-3. [DOI] [PubMed] [Google Scholar]
- 22.Trachta P, Dostalova I, Haluzikova D, Kasalicky M, Kavalkova P, Drapalova J, et al. Laparoscopic sleeve gastrectomy ameliorates mRNA expression of inflammation-related genes in subcutaneous adipose tissue but not in peripheral monocytes of obese patients. Molecular and cellular endocrinology. 2014;383:96–102. doi: 10.1016/j.mce.2013.11.013. [DOI] [PubMed] [Google Scholar]
- 23.Illan-Gomez F, Gonzalvez-Ortega M, Orea-Soler I, Alcaraz-Tafalla MS, Aragon-Alonso A, Pascual-Diaz M, et al. Obesity and inflammation: change in adiponectin, C-reactive protein, tumour necrosis factor-alpha and interleukin-6 after bariatric surgery. Obes Surg. 2012;22:950–5. doi: 10.1007/s11695-012-0643-y. [DOI] [PubMed] [Google Scholar]
- 24.Vendrell J, Broch M, Vilarrasa N, Molina A, Gomez JM, Gutierrez C, et al. Resistin, adiponectin, ghrelin, leptin, and proinflammatory cytokines: relationships in obesity. Obesity research. 2004;12:962–71. doi: 10.1038/oby.2004.118. [DOI] [PubMed] [Google Scholar]
- 25.Holdstock C, Lind L, Engstrom BE, Ohrvall M, Sundbom M, Larsson A, et al. CRP reduction following gastric bypass surgery is most pronounced in insulin-sensitive subjects. Int J Obes (Lond) 2005;29:1275–80. doi: 10.1038/sj.ijo.0803000. [DOI] [PubMed] [Google Scholar]
- 26.Viardot A, Lord RV, Samaras K. The effects of weight loss and gastric banding on the innate and adaptive immune system in type 2 diabetes and prediabetes. The Journal of clinical endocrinology and metabolism. 2010;95:2845–50. doi: 10.1210/jc.2009-2371. [DOI] [PubMed] [Google Scholar]
- 27.Bradley D, Conte C, Mittendorfer B, Eagon JC, Varela JE, Fabbrini E, et al. Gastric bypass and banding equally improve insulin sensitivity and beta cell function. The Journal of clinical investigation. 2012;122:4667–74. doi: 10.1172/JCI64895. [DOI] [PMC free article] [PubMed] [Google Scholar]
- 28.Kratz M, Hagman DK, Kuzma JN, Foster-Schubert KE, Chan CP, Stewart S, et al. Improvements in glycemic control after gastric bypass occur despite persistent adipose tissue inflammation. Obesity (Silver Spring) 2016;24:1438–45. doi: 10.1002/oby.21524. [DOI] [PMC free article] [PubMed] [Google Scholar]
- 29.Bergman RN, Stefanovski D, Buchanan TA, Sumner AE, Reynolds JC, Sebring NG, et al. A better index of body adiposity. Obesity (Silver Spring) 2011;19:1083–9. doi: 10.1038/oby.2011.38. [DOI] [PMC free article] [PubMed] [Google Scholar]
- 30.Campbell KL, Makar KW, Kratz M, Foster-Schubert KE, McTiernan A, Ulrich CM. A pilot study of sampling subcutaneous adipose tissue to examine biomarkers of cancer risk. Cancer Prev Res (Phila Pa) 2009;2:37–42. doi: 10.1158/1940-6207.CAPR-08-0073. [DOI] [PMC free article] [PubMed] [Google Scholar]
- 31.Matthews DR, Hosker JP, Rudenski AS, Naylor BA, Treacher DF, Turner RC. Homeostasis model assessment: insulin resistance and beta-cell function from fasting plasma glucose and insulin concentrations in man. Diabetologia. 1985;28:412–9. doi: 10.1007/BF00280883. [DOI] [PubMed] [Google Scholar]
- 32.Matsuda M, DeFronzo RA. Insulin sensitivity indices obtained from oral glucose tolerance testing: comparison with the euglycemic insulin clamp. Diabetes care. 1999;22:1462–70. doi: 10.2337/diacare.22.9.1462. [DOI] [PubMed] [Google Scholar]
- 33.Herzberg-Schafer SA, Staiger H, Heni M, Ketterer C, Guthoff M, Kantartzis K, et al. Evaluation of fasting state-/oral glucose tolerance test-derived measures of insulin release for the detection of genetically impaired beta-cell function. PLoS One. 2010;5:e14194. doi: 10.1371/journal.pone.0014194. [DOI] [PMC free article] [PubMed] [Google Scholar]
- 34.Utzschneider KM, Prigeon RL, Faulenbach MV, Tong J, Carr DB, Boyko EJ, et al. Oral disposition index predicts the development of future diabetes above and beyond fasting and 2-h glucose levels. Diabetes care. 2009;32:335–41. doi: 10.2337/dc08-1478. [DOI] [PMC free article] [PubMed] [Google Scholar]
- 35.Hagman DK, Kuzma JN, Larson I, Foster-Schubert KE, Kuan LY, Cignarella A, et al. Characterizing and quantifying leukocyte populations in human adipose tissue: impact of enzymatic tissue processing. Journal of immunological methods. 2012;386:50–9. doi: 10.1016/j.jim.2012.08.018. [DOI] [PMC free article] [PubMed] [Google Scholar]
- 36.Catalan V, Gomez-Ambrosi J, Rotellar F, Silva C, Rodriguez A, Salvador J, et al. Validation of endogenous control genes in human adipose tissue: relevance to obesity and obesity-associated type 2 diabetes mellitus. Hormone and metabolic research = Hormon- und Stoffwechselforschung = Hormones et metabolisme. 2007;39:495–500. doi: 10.1055/s-2007-982502. [DOI] [PubMed] [Google Scholar]
- 37.Vandesompele J, De Preter K, Pattyn F, Poppe B, Van Roy N, De Paepe A, et al. Accurate normalization of real-time quantitative RT-PCR data by geometric averaging of multiple internal control genes. Genome Biol. 2002;3:RESEARCH0034. doi: 10.1186/gb-2002-3-7-research0034. [DOI] [PMC free article] [PubMed] [Google Scholar]
- 38.Viana EC, Araujo-Dasilio KL, Miguel GP, Bressan J, Lemos EM, Moyses MR, et al. Gastric Bypass and Sleeve Gastrectomy: the Same Impact on IL-6 and TNF-alpha. Prospective Clinical Trial Obes Surg. 2013;23:1252–61. doi: 10.1007/s11695-013-0894-2. [DOI] [PubMed] [Google Scholar]
- 39.Iannelli A, Martini F, Rodolphe A, Schneck AS, Gual P, Tran A, et al. Body composition, anthropometrics, energy expenditure, systemic inflammation, in premenopausal women 1 year after laparoscopic Roux-en-Y gastric bypass. Surg Endosc. 2014;28:500–7. doi: 10.1007/s00464-013-3191-1. [DOI] [PubMed] [Google Scholar]
- 40.Iannelli A, Anty R, Schneck AS, Tran A, Gugenheim J. Inflammation, insulin resistance, lipid disturbances, anthropometrics, and metabolic syndrome in morbidly obese patients: a case control study comparing laparoscopic Roux-en-Y gastric bypass and laparoscopic sleeve gastrectomy. Surgery. 2011;149:364–70. doi: 10.1016/j.surg.2010.08.013. [DOI] [PubMed] [Google Scholar]
- 41.Iannelli A, Anty R, Piche T, Dahman M, Gual P, Tran A, et al. Impact of laparoscopic Roux-en-Y gastric bypass on metabolic syndrome, inflammation, and insulin resistance in super versus morbidly obese women. Obes Surg. 2009;19:577–82. doi: 10.1007/s11695-008-9764-8. [DOI] [PubMed] [Google Scholar]
- 42.Morinigo R, Casamitjana R, Delgado S, Lacy A, Deulofeu R, Conget I, et al. Insulin resistance, inflammation, and the metabolic syndrome following Roux-en-Y gastric bypass surgery in severely obese subjects. Diabetes care. 2007;30:1906–8. doi: 10.2337/dc07-0189. [DOI] [PubMed] [Google Scholar]
- 43.Chakaroun R, Raschpichler M, Kloting N, Oberbach A, Flehmig G, Kern M, et al. Effects of weight loss and exercise on chemerin serum concentrations and adipose tissue expression in human obesity. Metabolism: clinical and experimental. 2012;61:706–14. doi: 10.1016/j.metabol.2011.10.008. [DOI] [PubMed] [Google Scholar]
- 44.Xu XJ, Apovian C, Hess D, Carmine B, Saha A, Ruderman N. Improved Insulin Sensitivity 3 Months After RYGB Surgery Is Associated With Increased Subcutaneous Adipose Tissue AMPK Activity and Decreased Oxidative Stress. Diabetes. 2015;64:3155–9. doi: 10.2337/db14-1765. [DOI] [PMC free article] [PubMed] [Google Scholar]
- 45.Miller GD, Nicklas BJ, Fernandez A. Serial changes in inflammatory biomarkers after Roux-en-Y gastric bypass surgery. Surgery for obesity and related diseases: official journal of the American Society for Bariatric Surgery. 2011;7:618–24. doi: 10.1016/j.soard.2011.03.006. [DOI] [PMC free article] [PubMed] [Google Scholar]
- 46.Cancello R, Henegar C, Viguerie N, Taleb S, Poitou C, Rouault C, et al. Reduction of macrophage infiltration and chemoattractant gene expression changes in white adipose tissue of morbidly obese subjects after surgery-induced weight loss. Diabetes. 2005;54:2277–86. doi: 10.2337/diabetes.54.8.2277. [DOI] [PubMed] [Google Scholar]
- 47.Sams VG, Blackledge C, Wijayatunga N, Barlow P, Mancini M, Mancini G, et al. Effect of bariatric surgery on systemic and adipose tissue inflammation. Surg Endosc. 2015 doi: 10.1007/s00464-015-4638-3. [DOI] [PubMed] [Google Scholar]
- 48.Kovacikova M, Sengenes C, Kovacova Z, Siklova-Vitkova M, Klimcakova E, Polak J, et al. Dietary intervention-induced weight loss decreases macrophage content in adipose tissue of obese women. Int J Obes (Lond) 2011;35:91–8. doi: 10.1038/ijo.2010.112. [DOI] [PubMed] [Google Scholar]
- 49.Capel F, Klimcakova E, Viguerie N, Roussel B, Vitkova M, Kovacikova M, et al. Macrophages and adipocytes in human obesity: adipose tissue gene expression and insulin sensitivity during calorie restriction and weight stabilization. Diabetes. 2009;58:1558–67. doi: 10.2337/db09-0033. [DOI] [PMC free article] [PubMed] [Google Scholar]
- 50.Tam CS, Covington JD, Ravussin E, Redman LM, Pennington CT. Little evidence of systemic and adipose tissue inflammation in overweight individuals. Front Genet. 2012;3:58. doi: 10.3389/fgene.2012.00058. [DOI] [PMC free article] [PubMed] [Google Scholar]
- 51.Xu X, Grijalva A, Skowronski A, van Eijk M, Serlie MJ, Ferrante AW., Jr Obesity activates a program of lysosomal-dependent lipid metabolism in adipose tissue macrophages independently of classic activation. Cell Metab. 2013;18:816–30. doi: 10.1016/j.cmet.2013.11.001. [DOI] [PMC free article] [PubMed] [Google Scholar]
- 52.Belza A, Toubro S, Stender S, Astrup A. Effect of diet-induced energy deficit and body fat reduction on high-sensitive CRP and other inflammatory markers in obese subjects. Int J Obes (Lond) 2009;33:456–64. doi: 10.1038/ijo.2009.27. [DOI] [PubMed] [Google Scholar]
- 53.Gonzalez-Plaza JJ, Gutierrez-Repiso C, Garcia-Serrano S, Rodriguez-Pacheco F, Garrido-Sanchez L, Santiago-Fernandez C, et al. Effect of Roux-en-Y gastric bypass-induced weight loss on the transcriptomic profiling of subcutaneous adipose tissue. Surgery for obesity and related diseases: official journal of the American Society for Bariatric Surgery. 2016;12:257–63. doi: 10.1016/j.soard.2015.07.007. [DOI] [PubMed] [Google Scholar]
- 54.Nannipieri M, Baldi S, Mari A, Colligiani D, Guarino D, Camastra S, et al. Roux-en-Y gastric bypass and sleeve gastrectomy: mechanisms of diabetes remission and role of gut hormones. The Journal of clinical endocrinology and metabolism. 2013;98:4391–9. doi: 10.1210/jc.2013-2538. [DOI] [PubMed] [Google Scholar]
- 55.Trayhurn P, Wang B, Wood IS. Hypoxia in adipose tissue: a basis for the dysregulation of tissue function in obesity? Br J Nutr. 2008;100:227–35. doi: 10.1017/S0007114508971282. [DOI] [PubMed] [Google Scholar]
- 56.Kosteli A, Sugaru E, Haemmerle G, Martin JF, Lei J, Zechner R, et al. Weight loss and lipolysis promote a dynamic immune response in murine adipose tissue. The Journal of clinical investigation. 2010;120:3466–79. doi: 10.1172/JCI42845. [DOI] [PMC free article] [PubMed] [Google Scholar]
- 57.Veilleux A, Blouin K, Rheaume C, Daris M, Marette A, Tchernof A. Glucose transporter 4 and insulin receptor substrate-1 messenger RNA expression in omental and subcutaneous adipose tissue in women. Metabolism: clinical and experimental. 2009;58:624–31. doi: 10.1016/j.metabol.2008.12.007. [DOI] [PubMed] [Google Scholar]
- 58.Klimcakova E, Roussel B, Marquez-Quinones A, Kovacova Z, Kovacikova M, Combes M, et al. Worsening of obesity and metabolic status yields similar molecular adaptations in human subcutaneous and visceral adipose tissue: decreased metabolism and increased immune response. The Journal of clinical endocrinology and metabolism. 96:E73–82. doi: 10.1210/jc.2010-1575. [DOI] [PubMed] [Google Scholar]
- 59.Klimcakova E, Roussel B, Kovacova Z, Kovacikova M, Siklova-Vitkova M, Combes M, et al. Macrophage gene expression is related to obesity and the metabolic syndrome in human subcutaneous fat as well as in visceral fat. Diabetologia. 2011;54:876–87. doi: 10.1007/s00125-010-2014-3. [DOI] [PubMed] [Google Scholar]
- 60.Dadson P, Landini L, Helmio M, Hannukainen JC, Immonen H, Honka MJ, et al. Effect of Bariatric Surgery on Adipose Tissue Glucose Metabolism in Different Depots in Patients With or Without Type 2 Diabetes. Diabetes care. 2016;39:292–9. doi: 10.2337/dc15-1447. [DOI] [PubMed] [Google Scholar]
Associated Data
This section collects any data citations, data availability statements, or supplementary materials included in this article.