Abstract
Melanomas are notoriously difficult to classify because of a lack of discrete clinical and pathological stages. Here, we show that primary uveal melanomas surprisingly cluster into two distinct molecular classes based on gene expression profile. Genes that discriminate class 1 (low-grade) from class 2 (high-grade) include highly significant clusters of down-regulated genes on chromosome 3 and up-regulated genes on chromosome 8q, which is consistent with previous cytogenetic studies. A three-gene signature allows biopsy-size tumor samples to be assigned accurately to tumor classes using either array or PCR platforms. Most importantly, this molecular classification strongly predicts metastatic death and outperforms other clinical and pathological prognostic indicators. These studies offer new insights into melanoma pathogenesis, and they provide a practical foundation for effective clinical predictive testing.
Introduction
Melanomas have a strong propensity to metastasize, after which, they are highly resistant to therapy. Accurate predictive testing may allow systemic prophylaxis in high-risk patients. However, it is difficult to predict clinical outcome in individual melanoma patients because of the spectrum of clinical, morphologic, and cytologic changes and a lack of discrete stages (1, 2). In uveal melanoma, alterations on chromosomes 3, 6, and 8q have been linked to metastatic death (3, 4), but the clinical use of these findings has not been established. Furthermore, it remains unclear whether these gross chromosomal changes are associated with deregulation of specific genes or whether they are simply markers of tumor progression (5).
Few reports have analyzed global gene expression patterns in primary melanomas. Bittner et al. (6) identified a gene expression cluster, largely in metastatic melanoma cell lines, that correlated with invasive behavior in vitro. Tschentscher et al. (7) identified a correlation between gene expression profile and monosomy of chromosome 3 in uveal melanomas, but a relationship between gene expression and patient survival was not reported. Here, we present results of gene expression profiling in primary uveal melanomas from patients with long-term clinical follow-up. This study represents the largest number of primary melanomas of any site that have been analyzed for gene expression to date. Surprisingly, these tumors clustered naturally into two classes that correlated strongly with risk of metastasis. Furthermore, we provide evidence that clinical predictive testing may be feasible using this novel molecular signature.
Materials and Methods
Tumor Samples and Clinicopathological Data
Fresh tumor samples were obtained from primary uveal melanomas at the time of eye removal. Diagnosis was confirmed by a surgical pathologist in all cases. Normal melanocytes were harvested from choroid in eight patients at eye removal and cultured as described previously (8). Institutional Review Board approval was obtained. Paraffin-embedded tumor sections were stained with H&E and evaluated by two examiners. Cytologic ranking by proportion of epithelioid melanoma cells was performed as described previously (9). Statistical significance of correlations was determined using χ2 analysis, t test, and Pearson correlation coefficient as appropriate. Survival analysis was performed using Kaplan-Meier life table analysis on MedCalc Software (version 7.2.0.2). Survival was defined as the elapsed interval from date of eye removal to date of last follow-up or melanoma-related death.
Preparation of RNA
For fresh tumors and normal melanocytes, total RNA was obtained using TRIzol (Invitrogen, Carlsbad, CA) and purified using RNeasy kits (Qiagen, Valencia, CA) according to the manufacturers' instructions. RNA quality was assessed on the Bioanalyzer 2100 (Agilent, Palo Alto, CA). For paraffin-embedded samples, 10 10-μm sections were obtained from tissue blocks, and melanomas were dissected from the eye. Tumor tissue was deparaffinized with xylene, rehydrated with ethanol washes, and incubated overnight at 60°C in lysis buffer with proteinase K. Total RNA was isolated by phenol/chloroform extraction. For array studies, cDNA was generated by subjecting total RNA to reverse transcription, linear amplification, and in vitro transcription to generate biotinylated cRNA targets that were hybridized to Affymetrix Hu133A and B GeneChips according to manufacturer protocols. Chips were checked for quality assurance parameters and normalized for mean overall expression, and probe sets were analyzed for significance using Affymetrix software. For PCR analysis, cDNA was generated using RETRO-script kit (Ambion, Austin, TX) and SuperScript II Reverse Transcriptase (Invitrogen) according to manufacturer instructions.
Gene Expression Microarray Analysis
Gene expression values were subjected to log10 transformation and scalar normalization by the mean value. Principal component analysis was performed using Spotfire DecisionSite 7.0 software. Self-organizing maps were generated using GeneCluster2 software (10) available online.1 Hierarchical clustering was performed by a centroid linkage algorithm available on Dchip software (11) available online.2 Genes that discriminated tumor classes were identified by comparing median gene expression in each class by signal-to-noise algorithm available on GeneCluster2 software. Significance was determined for each gene by permutation of the data set 103 times and comparison to the absolute signal-to-noise ratio. Predictive models were generated with GeneCluster2 software using k nearest neighbor and weighted voting algorithms, followed by 4-fold cross-validation to evaluate model performance (12). Significance of predictor models was determined using the Fisher Test available on GeneCluster2 software. Bioinformatic analysis was performed using PubMed and LocusLink and the Affymetrix web sites.3,4
PCR and Analysis of Masked Samples
Real-time PCR was performed using Lux Fluorogenic primer kit (Invitrogen) and an ICycler thermocycler (Bio-Rad, Hercules, CA) according to manufacturer instructions. PCR was used to analyze seven class-discriminating genes and glyceraldehyde-3-phosphate dehydrogenase as a control (see Supplemental File 1 for primer sequences). Results were analyzed with ICycler software. The ΔCT values (differences between logarithms of expressions of glyceraldehyde-3-phosphate dehydrogenase and gene of interest) generated by ICycler software were shifted globally to generate a minimum value = 1. To normalize for differences in initial RNA concentration, expression values were then divided by the mean expression value for each tumor.
Comparative Genomic Hybridization Microarray Analysis
Genomic DNA was prepared from 10 fresh tumor specimens using the Wizard Genomic DNA purification kit (Promega, Madison, WI) and used for comparative genomic hybridization, which was performed as a service provided by the Microarray Shared Resource at the Comprehensive Cancer Center, University of California, San Francisco, using a microarray-based platform containing a genome-wide collection of genomic contigs, as described previously (13). A log2 average raw ratio of > 0.5 was used as the threshold for significant DNA copy number deviations.
Results and Discussion
Primary Uveal Melanomas Cluster into Two Discrete Molecular Classes
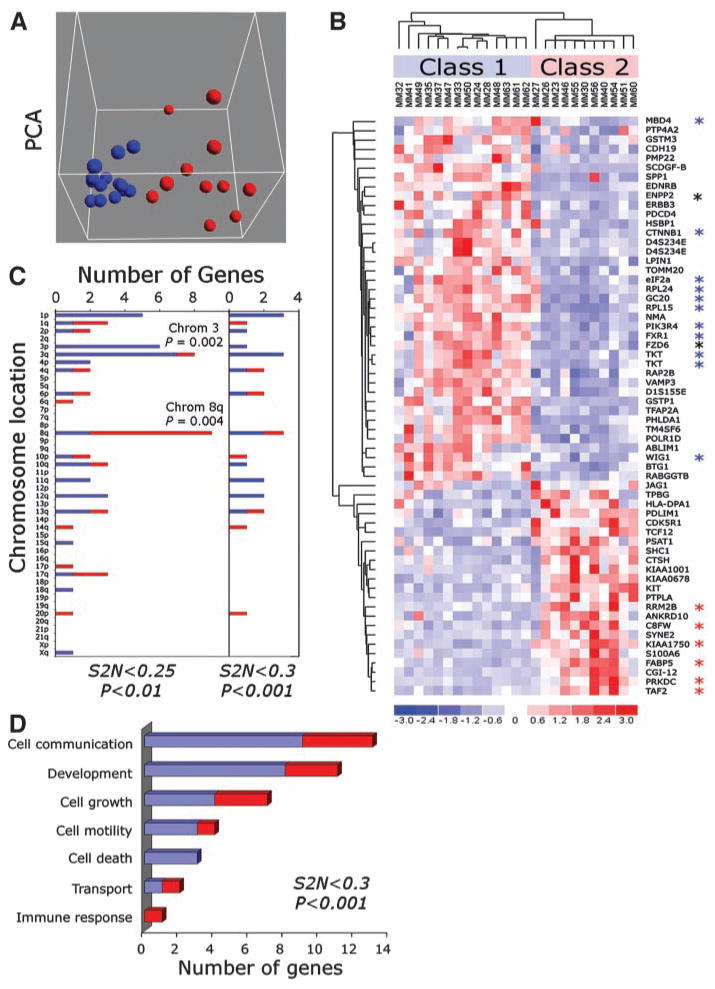
We examined the gene expression profiles of 25 primary untreated uveal melanomas using high-density oligonucleotide arrays containing ∼44,690 probe sets. Hypothetical genes and expressed sequence tags were removed, and the remaining 34,382 probe sets were filtered to exclude those with a median significance level of P > 0.005 as determined by Affymetrix software. This filtering process resulted in 3075 highly significant genes for additional analysis. Unsupervised analysis was performed using principal component analysis, which exhibited distinct clusters of 14 and 11 tumors (Fig. 1A), referred to as class 1 and class 2, respectively. The percent variability explained by the first principal component was 93.8%, the second component 1.6%, and the third component 0.9%. The first component included the top three discriminating genes (see below). Self-organizing maps, another method of unsupervised analysis, showed a similar clustering of tumors when 2 to 16 bins were specified, and with 4 or fewer bins, the principal component analysis and self-organizing map clusterings were identical (Supplemental File 2).
Fig. 1.

Gene expression profile analysis of primary uveal melanomas reveals two distinct tumor classes. A, principal component analysis (PCA) demonstrating a tight cluster of 14 tumors (blue spheres; class 1) and a distinct cluster of 11 tumors (red spheres; class 2). B, hierarchical clustering heat map of 62 discriminating genes with an absolute signal-to-noise (S2N) score ≥ 0.25 and P < 0.01. Class 1 (low-grade) and class 2 (high-grade) tumors are indicated. Blue asterisks indicate chromosome 3 genes that are down-regulated in class 2, red asterisks indicate chromosome 8q genes that are up-regulated in class 2, and black asterisks indicate chromosome 8q genes that are down-regulated in class 2. C, chromosomal distribution of the top 62 (left panel) and top 26 (right panel) discriminating genes with screening criteria indicated below each panel. The short arm (p) and long arm (q) are indicated for each chromosome. D, Gene Ontology functional groups for the top 26 genes. For C and D, blue bars indicate genes that are down-regulated, and red bars indicate genes that are up-regulated in class 2 tumors.
Identification of Discriminating Genes
We next used supervised techniques to identify genes that discriminate the tumor classes. Median expression for the 3075 genes was compared between class 1 and class 2 using a signal-to-noise algorithm. Genes were initially filtered for an signal-to-noise score ≥ 0.25 and a significance level of P ≤ 0.01 (1% permutation level). This filtering process resulted in 62 discriminating genes, including significant gene clusters on chromosome 3 (P = 0.002) and 8q (P = 0.004) that were down-regulated and up-regulated, respectively, in class 2 tumors (Fig. 1, B and C). This finding corroborates previous cytogenetic work showing that loss of chromosome 3 and gain of chromosome 8q correlate with metastatic death (3, 14). Interestingly, however, when this group of genes was further enriched using a threshold signal-to-noise score ≥ 0.3 and a significance level of P ≤ 0.001 (0.1% permutation level), most of the genes on chromosomes 3 and 8q were excluded (Fig. 1C). Gene Ontology biological function annotations for the top 26 genes included cell communication (13 genes), development (11 genes), cell growth (7 genes), cell motility (4 genes), and cell death (3 genes; Fig. 1D). Interestingly, most of the developmental genes (including KIT, ERBB3, EDNRB, SPP1, FZD6, TFAP2A, and SCDGF-B) have been implicated in neural crest development, which gives rise to melanocytes.
Molecular Classes Correlate with Cytologic Severity
We next analyzed the tumor classes for correlation with clinical and pathological features (Supplemental File 3). The only feature to demonstrate an association with tumor class was advanced patient age, a known risk factor for metastasis (15). Mean age was 56 years in class 1 and 73 years in class 2 (P = 0.008). To rule out the possibility that the melanoma gene expression patterns were solely a function of age rather than intrinsic biological differences between tumor classes, we examined the expression of 26 discriminating genes in normal uveal melanocytes from 8 patients ranging in age from 29 to 75 years (mean, 63 years). The melanocytes were analyzed using Affymetrix Gene-Chips in the same manner as the tumor samples described above. There was no correlation with age for any of the genes (P range, 0.15 to 0.97), suggesting that age alone is unlikely to account for the observed gene expression patterns.
Interestingly, the classification correlated poorly with melanoma cell type as recorded on pathology reports. However, because these tumors display a spectrum of cytologic features from well-differentiated spindle cells to poorly differentiated epithelioid cells (2), we obtained a more quantitative estimate of tumor cytology by ranking the melanomas from lowest to highest proportion of epithelioid cells, as described previously (9). Cytologic rank exhibited high interexaminer reproducibility (r = 0.8, P< 0.0001) and correlated strongly with molecular classification (P < 0.0001); class 1 corresponded to lower-grade spindle melanomas, whereas class 2 corresponded to the higher-grade melanomas with more epithelioid cells.
As Few as Three Genes Are Required for Accurate Class Prediction
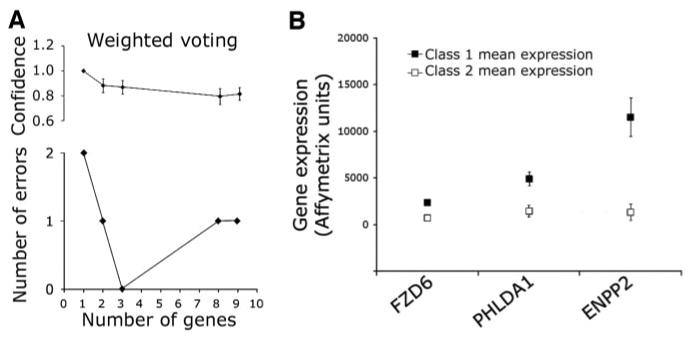
To identify a small set of genes that accurately predict class label, we analyzed the 26 discriminating genes using weighted voting and k nearest neighbor prediction algorithms. The overall model performance of each model was specified by the number of errors generated by 4-fold cross-validation (12). The best results were obtained using weighted voting, and subsequent analyses were performed using this algorithm. As few as three genes predicted correctly the class labels of all tumor samples with no errors, and there was no improvement in confidence by inclusion of more than three genes (Fig. 2A). One of the optimal three-gene sets (PHLDA1, FZD6, and ENPP2) demonstrated a significance of P = 3.5 × 10⁻⁵ by Fisher test and was chosen as the gene expression signature for additional analysis (Fig. 2B). The microarray expression values of the three signature genes, as well as four other top classifiers, were validated by real-time PCR analysis of RNA samples from 12 of the aforementioned tumors. All seven genes exhibited strong correlation between PCR and microarray expression values (P range, 0.01 to <0.001; Supplemental File 1).
Fig. 2.

Supervised training models identify a three-gene signature that accurately predicts tumor class. A, correct assignments and confidence scores (with SE) using a weighted voting algorithm. The performance of the model is indicated as a function of the number of genes included in the model. As few as three genes assign all tumors to the correct class with no improvement in performance by including additional genes. B, comparison of mean Affymetrix gene expression values in class 1 versus class 2 tumors for the 3 signature genes (error bars indicate SE).
Molecular Signature Predicts Patient Survival
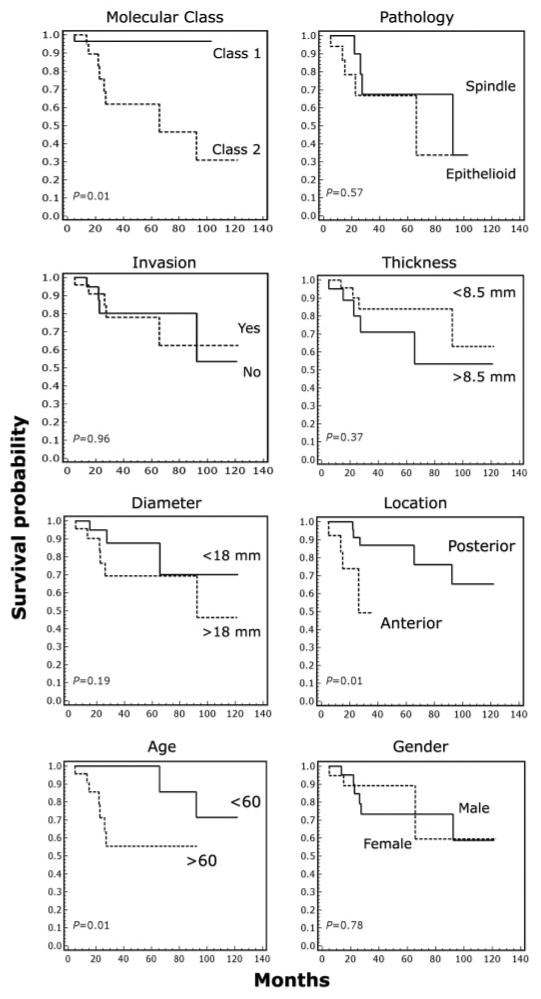
To determine the ability of the molecular classifier to accurately predict metastatic death, we evaluated patient survival using Kaplan-Meier life table analysis. Before performing this analysis, an additional independent set of 25 primary untreated uveal melanomas (9 fresh tumor samples and 16 formalin-fixed, paraffin-embedded samples) was classified using the three-gene signature and the weighted voting predictor. Notably, these additional assays were performed using real-time PCR to analyze RNA from small tumor samples that were similar in size to those obtained at biopsy (<40 mg). Survival analysis of all 50 patients revealed only one metastatic death among class 1 patients, compared with eight in class 2 patients (Fig. 3). The 92-month survival probability was 95% in class 1 versus 31% in class 2 (P = 0.01). Furthermore, the molecular classifier outperformed all other clinical and pathological prognostic factors (Fig. 3).
Fig. 3.

The gene expression signature accurately predicts metastatic death. Kaplan-Meier survival analysis in 50 uveal melanoma patients. Molecular class indicates class label using the gene expression signature. Pathology indicates the predominant tumor cell type indicated on the official pathology report. Other clinical features are indicated. All deaths were due to melanoma metastasis. Statistical significance is indicated for each parameter.
Comparison of Molecular Classifier with Chromosomal Aberrations
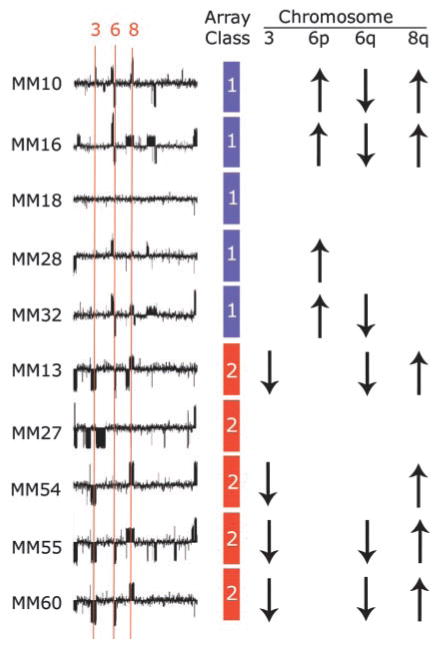
The most common cytogenetic changes in uveal melanoma include loss of DNA on chromosome 3, gain on 6p, loss on 6q, and gain on 8q (3, 16, 17). We compared our molecular classification to cytogenetic changes in 10 of the tumor samples using microarray-based comparative genomic hybridization. Loss of 6q and gain of 8q were the most common abnormalities, but these changes exhibited no correlation with molecular classification (Fig. 4). In contrast, gain of chromosome 6p, which is associated with a more favorable prognosis (16), was observed in four of five class 1 tumors and no class 2 tumors. On the other hand, loss of chromosome 3, which is associated with poor prognosis (3, 17), was detected in four of five class 2 tumors but no class 1 tumors. However, one tumor (MM27) that caused metastatic death was classified by gene expression signature as class 2, but it did not exhibit chromosome 3 loss. Taken together, these findings indicate that the changes on chromosomes 3 and 6p correlate strongly with our molecular classification, but the latter may detect some high-risk patients that are missed by chromosomal analysis alone. The potentially superior prognostic value of the molecular classifier is supported by the paucity of discriminating genes on chromosome 3 and 8q in our final group of 26 highly discriminating genes (Fig. 1C). Furthermore, two of the discriminating genes on chromosome 8q—ENPP2 and FZD6—are down-regulated (rather than up-regulated as expected) in class 2 tumors (Fig. 1B).
Fig. 4.

Comparison of molecular classification and microarray-based comparative genomic hybridization in 10 primary uveal melanomas. Diagrams depict genome-wide comparative genomic hybridization analysis of a chromosomes (in numerical order from left to right, except the X chromosome), with the locations of chromosomes 3, 6, and 8 indicated. Deviations above and below the midline indicate increased and decreased DNA copy number, respectively. The molecular tumor class based on gene expression array is indicated by a blue or red box (class 1 or class 2, respectively). A summary of DNA copy number changes detected by comparative genomic hybridization is indicated by up or down arrows for chromosomes 3, 6p, 6q, and 8q. Absence of an arrow indicates no significant change from normal DNA copy number.
These studies reveal an unexpected binary clustering of uveal melanomas into distinct low-grade and high-grade groups (class 1 and class 2, respectively) based on gene expression profiling. This novel molecular classification exhibited prognostic accuracy superior to clinical and pathological factors, and it also may outperform chromosomal analysis, although this finding needs to be confirmed using a larger data set. Cytologic tumor ranking was useful to establish a correlation between the molecular classification and cytologic severity, but such grading techniques are not practical for clinical use. In contrast, we show that the molecular classification requires a remarkably small number of genes and can be assayed using a small biopsy-size tumor sample, indicating that this classification may be readily adaptable for clinical testing. In addition, the small number of genes reduces the risk of overfitting the data (18). On the basis of these results, we are currently planning a prospective multicenter study to develop a practical clinical assay that can provide prognostic information to guide management in individual patients.
Acknowledgments
We thank Morton Smith for cytologic ranking of pathology slides, Arthur Polans for protocol describing RNA extraction in paraffin-embedded tissue, and Randy Davis at the Microarray Shared Resource of the Comprehensive Cancer Center, University of California, San Francisco, for his expertise with microarray comparative genomic hybridization analysis.
Grant support: The National Eye Institute Grant RO1 EY13169 (J. W. Harbour), a Research to Prevent Blindness, Inc., Clinician Scientist Award (J. W. Harbour), and an unrestricted grant from the Research to Prevent Blindness, Inc. (Department of Ophthalmology and Visual Sciences, Washington University School of Medicine).
Footnotes
Internet address: http://www-genome.wi.mit.edu/cancer/software/software.html.
Internet address: http://www.dchip.org.
Internet address: http://www.ncbi.nlm.nih.gov.
Internet address: http://affymetrix.com/index.affx.
Note: Microarray experiments and survival analysis were performed with the assistance of the Siteman Cancer Center Multiplexed Gene Core Facility and Cancer Registry, respectively.
References
- 1.Weyers W, Euler M, Diaz-Cascajo C, Schill WB, Bonczkowitz M. Classification of cutaneous malignant melanoma: a reassessment of histopathologic criteria for the distinction of different types. Cancer (Phila) 1999;86:288–99. doi: 10.1002/(sici)1097-0142(19990715)86:2<288::aid-cncr13>3.0.co;2-s. [DOI] [PubMed] [Google Scholar]
- 2.Seddon JM, Albert DM, Lavin PT, Robinson N. A prognostic factor study of disease-free interval and survival following enucleation for uveal melanoma. Arch Ophthalmol. 1983;101:1894–9. doi: 10.1001/archopht.1983.01040020896012. [DOI] [PubMed] [Google Scholar]
- 3.Sisley K, Rennie IG, Parsons MA, et al. Abnormalities of chromosomes 3 and 8 in posterior uveal melanoma correlate with prognosis. Genes Chromosomes Cancer. 1997;19:22–8. doi: 10.1002/(sici)1098-2264(199705)19:1<22::aid-gcc4>3.0.co;2-2. [DOI] [PubMed] [Google Scholar]
- 4.Prescher G, Bornfeld N, Friedrichs W, Seeber S, Becher R. Cytogenetics of twelve cases of uveal melanoma and patterns of nonrandom anomalies and isochromosome formation. Cancer Genet Cytogenet. 1995;80:40–6. doi: 10.1016/0165-4608(94)00165-8. [DOI] [PubMed] [Google Scholar]
- 5.Loercher AE, Harbour JW. Molecular genetics of uveal melanoma. Curr Eye Res. 2003;27:69–74. doi: 10.1076/ceyr.27.2.69.15952. [DOI] [PubMed] [Google Scholar]
- 6.Bittner M, Meltzer P, Chen Y, et al. Molecular classification of cutaneous malignant melanoma by gene expression profiling. Nature (Lond) 2000;406:536–40. doi: 10.1038/35020115. [DOI] [PubMed] [Google Scholar]
- 7.Tschentscher F, Husing J, Holter T, et al. Tumor classification based on gene expression profiling shows that uveal melanomas with and without monosomy 3 represent two distinct entities. Cancer Res. 2003;63:2578–84. [PubMed] [Google Scholar]
- 8.Harbour JW, Worley L, Ma D, Cohen M. Transducible peptide therapy for uveal melanoma and retinoblastoma. Arch Ophthalmol. 2002;120:1341–6. doi: 10.1001/archopht.120.10.1341. [DOI] [PubMed] [Google Scholar]
- 9.Brantley MA, Jr, Harbour JW. Deregulation of the Rb and p53 pathways in uveal melanoma. Am J Pathol. 2000;157:1795–801. doi: 10.1016/s0002-9440(10)64817-1. [DOI] [PMC free article] [PubMed] [Google Scholar]
- 10.Tamayo P, Slonim D, Mesirov J, et al. Interpreting patterns of gene expression with self-organizing maps: methods and application to hematopoietic differentiation. Proc Natl Acad Sci USA. 1999;96:2907–12. doi: 10.1073/pnas.96.6.2907. [DOI] [PMC free article] [PubMed] [Google Scholar]
- 11.Li C, Wong WH. Model-based analysis of oligonucleotide arrays: expression index computation and outlier detection. Proc Natl Acad Sci USA. 2001;98:31–6. doi: 10.1073/pnas.011404098. [DOI] [PMC free article] [PubMed] [Google Scholar]
- 12.Golub TR, Slonim DK, Tamayo P, et al. Molecular classification of cancer: class discovery and class prediction by gene expression monitoring. Science (Wash DC) 1999;286:531–7. doi: 10.1126/science.286.5439.531. [DOI] [PubMed] [Google Scholar]
- 13.Snijders AM, Norma Nowak N, Segraves R, et al. Assembly of microarrays for genome-wide measurement of DNA copy number by CGH. Nat Genet. 2001;29:263–4. doi: 10.1038/ng754. [DOI] [PubMed] [Google Scholar]
- 14.Prescher G, Bornfeld N, Hirche H, Horsthemke B, Jockel KH, Becher R. Prognostic implications of monosomy 3 in uveal melanoma. Lancet. 1996;347:1222–5. doi: 10.1016/s0140-6736(96)90736-9. [DOI] [PubMed] [Google Scholar]
- 15.Augsburger JJ, Gamel JW. Clinical prognostic factors in patients with posterior uveal malignant melanoma. Cancer (Phila) 1990;66:1596–600. doi: 10.1002/1097-0142(19901001)66:7<1596::aid-cncr2820660726>3.0.co;2-6. [DOI] [PubMed] [Google Scholar]
- 16.Aalto Y, Eriksson L, Seregard S, Larsson O, Knuutila S. Concomitant loss of chromosome 3 and whole arm losses and gains of chromosome 1, 6, or 8 in metastasizing primary uveal melanoma. Investig Ophthalmol Vis Sci. 2001;42:313–7. [PubMed] [Google Scholar]
- 17.Speicher MR, Prescher G, du Manoir S, et al. Chromosomal gains and losses in uveal melanomas detected by comparative genomic hybridization. Cancer Res. 1994;54:3817–23. [PubMed] [Google Scholar]
- 18.Kim S, Dougherty ER, Barrera J, Chen Y, Bittner ML, Trent JM. Strong feature sets from small samples. J Comput Biol. 2002;9:127–46. doi: 10.1089/10665270252833226. [DOI] [PubMed] [Google Scholar]


