

Abstract
Microarray gene expression profiling is a powerful tool for generating molecular cancer classifications. However, elucidating biological insights from these large data sets has been challenging. Previously, we identified a gene expression-based classification of primary uveal melanomas that accurately predicts metastatic death. Class 1 tumors have a low risk and class 2 tumors a high risk for metastatic death. Here, we used genes that discriminate these tumor classes to identify biological correlates of the aggressive class 2 signature. A search for Gene Ontology categories enriched in our class-discriminating gene list revealed a global down-regulation of neural crest and melanocyte-specific genes and an up-regulation of epithelial genes in class 2 tumors. Correspondingly, class 2 tumors exhibited epithelial features, such as polygonal cell morphology, up-regulation of the epithelial adhesion molecule E-cadherin, colocalization of E-cadherin and β-catenin to the plasma membrane, and formation of cell-cell adhesions and acinar structures. One of our top class-discriminating genes was the helix-loop-helix inhibitor ID2, which was strongly down-regulated in class 2 tumors. The class 2 phenotype could be recapitulated by eliminating Id2 in cultured class 1 human uveal melanoma cells and in a mouse ocular melanoma model. Id2 seemed to suppress the epithelial-like class 2 phenotype by inhibiting an activator of the E-cadherin promoter. Consequently, Id2 loss triggered up-regulation of E-cadherin, which in turn promoted anchorage-independent cell growth, a likely antecedent to metastasis. These findings reveal new roles for Id2 and E-cadherin in uveal melanoma progression, and they identify potential targets for therapeutic intervention.
Introduction
Uveal melanoma is the most common form of eye cancer and the second most common site for melanoma (1). This cancer has been the subject of intense interest over the years due to its distinctive metastatic pattern. Up to 50% of uveal melanoma patients die of metastasis, which usually involves hematogenous spread to the liver, despite successful treatment of the primary eye tumor, at which time microscopic metastasis has already occurred (2). Metastatic disease usually is not detected for 2 to 5 years after ocular treatment, allowing up to 30 tumor cell doublings and the accumulation of a massive tumor burden that is resistant to therapy and causes death within 5 to 9 months (1). Therefore, uveal melanoma is an ideal tumor for studying the mechanisms of distant metastasis and the efficacy of treating high-risk patients prophylactically for metastatic disease at the time of initial diagnosis rather than waiting for clinical detection of metastasis. However, this strategy requires an accurate method for identifying high-risk patients.
For many years, the histopathologic features of uveal melanoma have been scrutinized to identify factors predictive of metastasis. In 1931, Callender noted that uveal melanomas often contain epithelioid cells (3), which were strongly associated with a poor prognosis. In 1992, Folberg discovered that “looping” patterns of extracellular matrix were also associated with metastatic death (4). Although both epithelioid cytology and looping matrix patterns are now firmly established prognostic factors, neither is practical for clinical decision making because they are subjective and nonquantitative and form a continuous spectrum without clear-cut pathologic stages (5).
In the search for other prognostic factors, researchers found that loss of one chromosome 3 in tumor cells was highly predictive of metastatic death (6). This was the first objective, discontinuous and highly accurate prognostic feature, leading researchers to speculate that, despite an absence of discrete pathologic stages, uveal melanomas may nevertheless form discrete genetic subtypes. Using microarray-based gene expression profiling, our laboratory and the Lohmann group independently found that primary uveal melanomas cluster into two distinct groups that we have designated class 1 and class 2 (7, 8). Class 1 tumors were associated with an excellent prognosis, whereas class 2 tumors were associated with epithelioid cytology, looping matrix patterns, monosomy 3, and metastatic death (7–9). Hence, this molecular classification may provide a unifying and practical format for grouping uveal melanomas by metastatic risk, and it provides a gene expression data set that can be exploited to identify functional themes that distinguish the class 1 and class 2 tumors.
In this study, we searched for functional themes underlying the gene expression classification. The weighted list of class-discriminating genes revealed a broad down-regulation of neural crest/melanocytic genes and up-regulation of epithelial genes in the class 2 tumors, which also exhibited other phenotypic features consistent with epithelial differentiation. Perturbation of at least one of our class discriminators, the basic helix-loop-helix inhibitor Id2, recapitulated the class 2 phenotype in cultured uveal melanoma cells and in a mouse model. These results illustrate the possibility of unraveling biological insights from large-scale gene expression data, and they provide a groundwork for understanding mechanisms of uveal melanoma metastasis.
Materials and Methods
Tumor samples and gene expression analysis
Institutional review board approval was obtained. Fresh tumor samples were snap frozen, total RNA was extracted, and gene expression profiling was done using Affymetrix (Santa Clara, CA) Hu133A GeneChip as described (8). Data are available at http://bioinformatics.wustl.edu. Probe set expression values were log10 transformed and scalar normalized by the mean. Id2 and E-cadherin RNA expression was analyzed by quantitative real-time PCR with Lux fluorogenic primers (Invitrogen Life Technologies, Carlsbad, CA) using glyceraldehyde-3-phosphate dehydrogenase as a control (sequences available upon request).
GeneSifter (http://www.genesifter.net) was used to generate weighted lists of genes that discriminated between class 1 and class 2 tumors and to identify statistically significant overrepresentation of Gene Ontology (GO) terms, defined as z-score > 2, where
(N is the number of genes measured, R is the number of genes meeting selection criteria, n is the total number of genes measured with the specific GO term, and r is the number of genes with specified GO term meeting selection criteria). Spotfire DecisionSite 7.0 was used for principal component analysis. The Affymetrix (http://www.affymetrix.com) and National Center for Biotechnology Information (http://www.ncbi.nlm. nih.gov) Web sites were used for extended GO analysis.
Microarray comparative genomic hybridization
Genomic DNA was extracted using the Wizard kit (Promega, Madison, WI). Comparative genomic hybridization was done by the Microarray Shared Resource at the Comprehensive Cancer Center, University of California at San Francisco as described (10). A log 2 average raw ratio of > |0.5| was used as the threshold for significant DNA copy number deviations.
Histopathologic analysis
Tumor samples were formalin fixed, paraffin embedded, and stained with H&E. Tumors were ranked by proportion of epithelioid cells as described (8). Immunohistochemistry was done using antibodies against Id2 (Santa Cruz Biotechnology, Santa Cruz, CA; 1:250 dilution), E-cadherin, and β-catenin (BD Transduction Laboratories, Lexington, KY; both 1:500 dilution). Immunostaining was scored in a masked fashion by staining intensity and proportion of positive cells.
Methylation-specific PCR
Methylation-specific PCR was done on genomic DNA from fresh tumor tissue as described (11). Methylation was quantitated by densitometry using One-DScan (Scanalytics, Fairfax, VA), and the ratio of methylated/unmethylated DNA was calculated for proximal and distal CpG islands (−100 and −3,200 bp from ID2 start site).
Survival analysis
The optimal Id2 expression threshold by maximizing sensitivity and specificity for predicting metastatic death (1,714 GeneChip expression units) was determined using receiver operating characteristic curves, allowing tumors to be discretized into low and high Id2 groups. Survival analysis was done using Kaplan-Meier curves. MedCalc 7.2.0.2 was used for all calculations.
Cell culture and soft agar assays
Mel202 and Mel290 human uveal melanoma cells (gift of B. Ksander, Harvard University, Boston, MA) were transfected with the expression vector pCMV-CD20 (gift of D. Dean, University of Louisville, Louisville, KY) plus empty pCMV-neo control or Id2 antisense expression vector (gift of A. Iavarone) described elsewhere (12). Primary class 2 human uveal melanoma cells were transfected with an Id2 expression vector (gift of A. Iavarone). Transfections were done using Effectene (Qiagen, Valencia, CA). After 24 hours, transfected cells were placed in selection medium of RPMI 1640 (Cambrex, Walkersville, MD) with 10% fetal bovine serum (Biosource, Camarillo, CA), antibiotics, and G418 (RPI, Mt. Prospect, IL). Cells were plated on coverslips and immunolabeled using antibodies against E-cadherin (BD Transduction Laboratories; 1:500 dilution), CD20, or Id2 (Santa Cruz Biotechnology; 1:500 and 1:1,000 dilutions, respectively). For soft agar assays, cells were grown in selection medium for 7 days and then plated onto 12-well plates containing 0.3% agarose in the same selection medium with or without the DECMA1 E-cadherin blocking antibody (Sigma-Aldrich, St. Louis, MO; 1:1000 dilution). After 6 days, cells were stained with 3-(4,5-dimethylthiazol-2-yl)-2,5-diphenyltetrazolium bromide (Sigma-Aldrich) to identify viable cells. The number of colonies containing ≥4 viable tumor cells was determined for at least ten ×20 fields in triplicate plates.
Luciferase assays
Mel202 and Mel290 cells were cotransfected with E-cadherin promoter-luciferase reporter constructs and either the Id2 antisense vector or the control vector. Reporters were driven by the human E-cadherin promoter either wild-type or containing mutations in E-pal, E-box2, or all three E-boxes in the promoter (gifts of E. Fearon, University of Michigan, Ann Arbor, MI), which are described elsewhere (13). After 72 hours, cell lysates were tested for luciferase activity as described (11). Experiments were conducted in triplicate.
Analysis of mouse ocular tumors. TyrTAg mice (gift of D. Albert, University of Wisconsin, Madison, WI) were crossed with Id2+/− heterozygotes on the 129/Sv background to generate TyrTAg mice with all three Id2 genotypes. Status of TyrTAg transgene and Id2 genotype were ascertained at age 4 weeks by PCR analysis of tail DNA as described (14, 15). Mice were euthanized at age 6, 9, and 15 weeks, eyes were formalin fixed and paraffin embedded, and sections were stained with H&E or periodic acid-Schiff (PAS) or immunostained using the E-cadherin and β-catenin antibodies described above. Epithelioid scores were calculated as mean nuclear circularity for 90 random tumor cell nuclei measured from ×1,000 digital images using ImageJ software (http://rsbweb.nih.gov/ij). Mitotic indices were the number of mitotic figures per 10 random ×100 fields. Tumor vascularity was the number of discrete vessels per 10 random ×40 fields.
Results
GO categories associated with the class 2gene signature
Gene expression profiles from 18 class 1 and 12 class 2 tumors were generated using Affymetrix Hu133A GeneChip and analyzed to identify differences in gene expression patterns between the two tumor classes (clinical data summarized in Supplementary Table S1). A median call P ≤ 0.05 was used as a quality threshold and yielded 8,750 probe sets for further study. Unsupervised analysis of these probe sets using principal component analysis confirmed that the class 1 and class 2 tumors aggregated into discrete groups (Fig. 1A). To generate a weighted list of genes that distinguished class 1 and class 2 tumors, we filtered probe sets for a mean expression difference ≥ 1.5-fold, t test P ≤ 0.05, and a Benjamini-Hochberg false discovery rate not to exceed the P. This filtering process yielded 1,605 probe sets, representing 1,338 unique genes (Supplementary Table S2).
Figure 1.
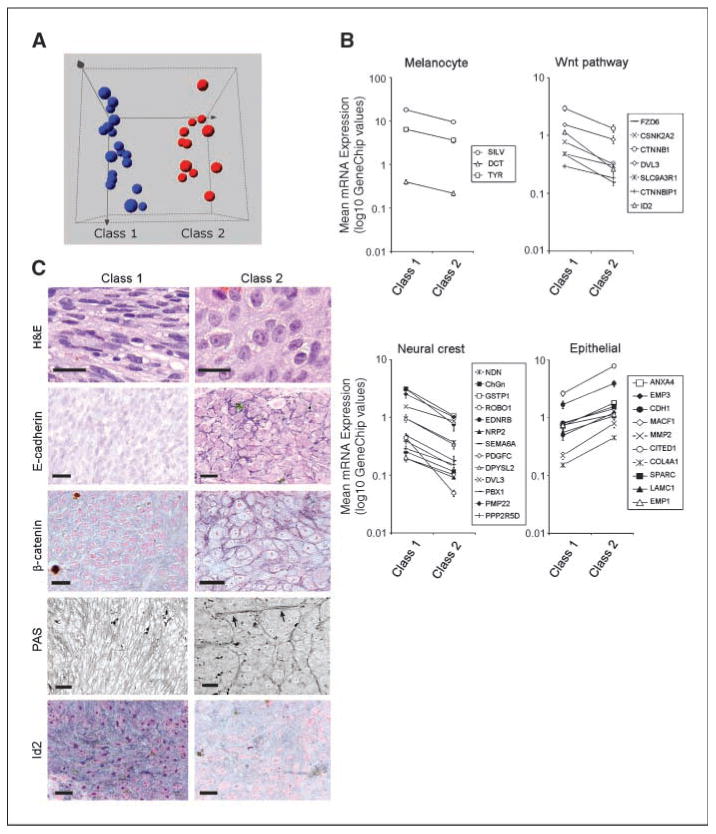
Divergence of gene expression patterns between class 1 and class 2 uveal melanomas reflects a shift from neural crest to epithelial-like differentiation. A, unsupervised principal component analysis showing clustering of class 1 and class 2 tumors. Spheres, individual tumors. B, mean mRNA expression of melanocyte, Wnt pathway, neural crest, and epithelial genes in 14 class 1 melanomas and 11 class 2 melanomas (Affymetrix GeneChip expression units). Bars, SE. Graphs are depicted on log10 scales. C, representative tissue sections from class 1 and class 2 uveal melanomas stained with H&E, immunostained using antibodies against E-cadherin, β-catenin, or Id2 (blue, positive staining),or stained with PAS. PAS staining is displayed using grayscale images to show extracellular matrix patterns (arrows). Bars, 20 μm.
To examine underlying functional patterns in this weighted gene list, the genes were mapped to the biological process GO classification using GeneSifter software. A GO term was considered to be overrepresented in the weighted gene list if it was represented by at least four unique genes and exhibited a z-score >2, indicating that the term occurred more frequently than expected by chance. Most overrepresented GO terms were related to development, differentiation, adhesion, and immune response. Immune response genes expressed in macrophages and lymphocytes were up-regulated in class 2 tumors, which is consistent with previous work showing that tumor infiltration by inflammatory cells is associated with poor prognosis (16). Developmental genes involved in neural crest specification and melanocyte differentiation, including Wnt pathway regulators (e.g., EDNRB and CTNNB1) and melanin biosynthetic enzymes (e.g., DCT, SILV, and TYR), were down-regulated in class 2 tumors (Fig. 1B). In contrast, epithelial lineage markers (e.g., EMP1 and EMP3) as well as genes involved in epithelial cell adhesion (e.g., CDH1), epithelial basement membrane production (e.g., TPBG, LAMC1, and COL18A1), and epithelial basement membrane interactions (e.g., MACF1 and SPARC) were up-regulated in class 2 tumors (Fig. 1B). Taken together, these findings suggested a global down-regulation of neural crest/melanocyte genes and an up-regulation of epithelial genes in class 2 tumors.
Class 2 tumors display epithelial attributes
These results suggested that the class 2 tumors have diverged from a neural crest/ melanocyte to an epithelial-like phenotype. We showed previously that class 1 tumors are enriched for differentiated, melanocyte-like spindle cells, whereas class 2 tumors contain many epithelioid cells (8), a term used by pathologists for many decades to describe their epithelial-like, polygonal morphology (Fig. 1C; ref. 3). Consistent with this idea, most class 2 tumors exhibited plasma membrane localization of E-cadherin and β-catenin (Fisher's exact test, P = 0.01 and 0.003, respectively), which is characteristic of epithelial cells (17), whereas most class 1 tumors expressed low levels of E-cadherin with β-catenin localized to the nucleus and cytoplasm (Fig. 1C). These findings suggest that class 2 tumors have acquired an epithelial-like phenotype by activating an epithelial gene expression program, a conclusion consistent with previous work showing that aggressive uveal melanoma cells preferentially express epithelial differentiation markers, such as cytokeratin (18).
Looping extracellular matrix patterns within primary uveal melanomas are strongly associated with metastatic death (19). Although the pathogenesis of the matrix patterns is unknown, we showed recently that they occur almost exclusively in class 2 tumors (9), suggesting that the patterns may be yet another marker of epithelial differentiation. Consistent with this idea, class 1 tumors treated with PAS to stain extracellular matrix exhibited a reticular pattern of extracellular matrix surrounding individual tumor cells, reminiscent of the pattern seen in mesenchymal tissues (Fig. 1C). In contrast, PAS staining of class 2 tumors highlighted the looping matrix patterns surrounding large clusters of tumor cells. Additionally, the PAS staining showed an absence of the mesenchymal-like intercellular matrix deposition. This sequestration of matrix away from individual cells and into laminar sheets surrounding cell clusters is highly characteristic of epithelial cells (20).
Id2 is down-regulated in class 2 tumors
To identify genes that may contribute directly to the epithelial alteration in class 2 tumors, we reanalyzed our uveal melanoma transcriptome database using more stringent criteria by prescribing a fold difference in mean expression of >5 and a false discovery rate of <0.001. This process identified 10 genes that were strongly down-regulated in class 2 tumors (Supplementary Table S2). This weighted list contained several β-catenin targets, including ID2, SPP1, and ENPP2, and several likely β-catenin/Wnt regulators (e.g., ROBO1, GPR37, and IL12RB2). One of these down-regulated genes, ID2, was of particular interest because it is highly expressed in normal uveal melanocytes (Supplementary Fig. S1A), it is a transcriptional target of β-catenin, and it encodes a downstream regulator of β-catenin/Wnt signaling (21). Hence, inactivation of Id2 could account for much of the class 2 gene expression profile. Using the Affymetrix algorithm, Id2 mRNA transcripts were present in 3 of 3 (100%) normal uveal melanocyte samples, 14 of 18 (78%) class 1 tumors, but only 1 of 12 (8%) class 2 tumors (Fisher's exact test P < 0.001). Down-regulation of Id2 was confirmed at the mRNA level by realtime PCR (Supplementary Fig. S1B) and at the protein level by immunohistochemistry (Fig. 1C; Supplementary Fig. S1C). Low Id2 mRNA expression was associated with a greater proportion of epithelioid cells (P = 0.001; Fig. 2A) and with metastatic death (P = 0.001; Fig. 2B). Indeed, the accuracy of Id2 for predicting metastatic death (sensitivity = 100%, specificity = 90%) was superior to immunohistochemical staining for E-cadherin and β-catenin and to our published gene expression profile (data not shown; ref. 8). Microarray comparative genomic hybridization revealed no DNA deletions around the ID2 locus in class 2 tumors (data not shown). The ID2 promoter was hypermethylated in some class 2 tumors, and this hypermethylation correlated with decreased Id2 mRNA expression (Supplementary Fig. S1B). However, we were unable to verify that demethylation of the promoter with 5-azacytidine could restore Id2 expression due to limited availability of primary cultured melanoma cells; therefore, the significance of this finding remains unclear.
Figure 2.
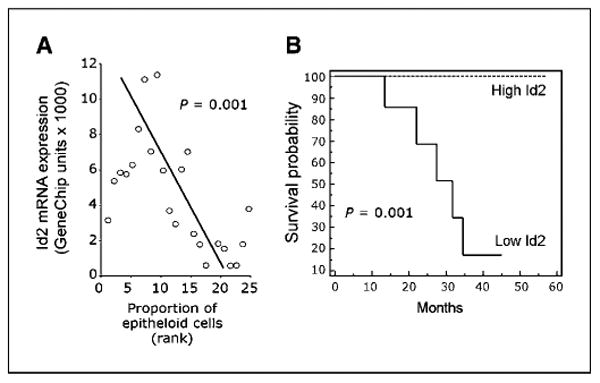
Id2 down-regulation in primary uveal melanomas is associated with epithelioid cytology and metastatic death. A, scatter plot of Id2 mRNA expression (Affymetrix GeneChip expression units) versus the proportion of epithelioid cells in human uveal melanomas, measured by rank score from 1 to 25. Significance level was calculated using Pearson correlation coefficient. B, Kaplan-Meier analysis comparing metastatic death in patients with “low Id2” versus “high Id2” tumors. Using receiver operating characteristic curves to discretize tumors for maximal sensitivity and specificity to predict metastasis based on Id2 expression, a threshold of 1,714 GeneChip units assigned 7 tumors to the low Id2 group and 16 tumors to the high Id2 group.
Class 1 uveal melanoma cells depleted of Id2 simulate class 2 cells
To determine whether down-regulation of Id2 may contribute directly to the pathogenesis of class 2 tumors or whether it is simply a marker of the class 2 phenotype, we depleted Id2 using an antisense expression construct in Mel202 class 1 uveal melanoma cells that express high endogenous levels of Id2 (Supplementary Fig. S2). Cells grown on tissue plates and transfected with an empty control vector exhibited typical melanocytic morphology and minimal cell-cell contact (Fig. 3A). In contrast, cells transfected with the Id2 antisense vector exhibited epithelial-like features, including polygonal morphology, rounded nuclei, cell-cell adhesions, and acinar clustering, similar to class 2 tumor cells in vivo. Further, Id2-depleted cells expressed high levels of E-cadherin that was localized to the plasma membrane, typical of class 2 tumors in vivo (Fig. 3B), whereas adjacent untransfected cells expressed low levels of E-cadherin that was limited to the cytoplasm (Fig. 3B). Consistent with this finding, E-cadherin mRNA levels (measured by quantitative real-time PCR) were elevated in Mel202 cells expressing the Id2 antisense vector compared with those expressing the control vector (Fig. 3C). Conversely, forced expression of Id2 in primary class 2 uveal melanoma cells with low endogenous Id2 levels abolished the distinctive plasma membrane pattern of E-cadherin expression (Fig. 3B). These results are consistent with the idea that down-regulation of Id2 may be integral to the pathogenesis of class 2 uveal melanomas by inducing E-cadherin expression.
Figure 3.
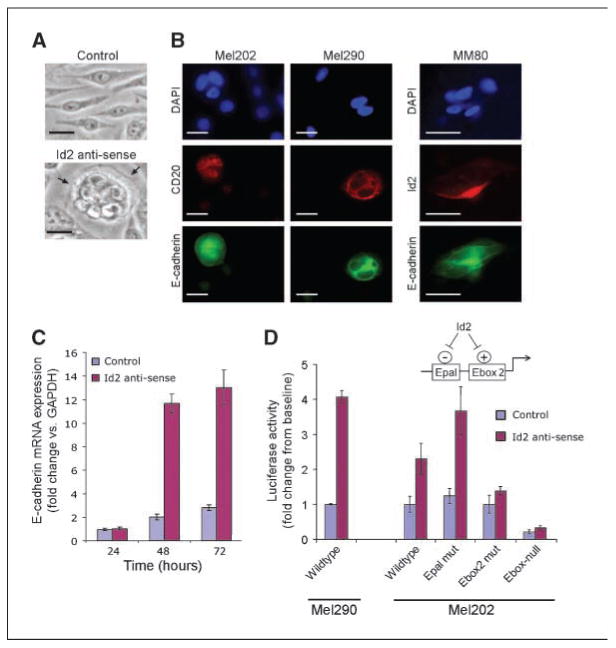
Id2 inhibits epithelial differentiation in uveal melanoma cells by negatively regulating E-cadherin expression. A, Mel202 class 1 melanoma cells transfected with an empty control vector or an Id2 antisense vector and viewed by phase-contrast microscopy. Arrows, an epithelial-like cluster of melanoma cells. Bars,10 μm. B, Mel202 and Mel290 class 1 uveal melanoma cells cotransfected with Id2 antisense and CD20 expression vectors and immunostained for E-cadherin and CD20 (a marker for transfected cells). Id2-deficient MM80 class 2 uveal melanoma cells were transfected with an Id2 expression vector and immunostained for E-cadherin and Id2. Bars,10 μm. C, E-cadherin mRNA levels measured by quantitative real-time PCR (fold change compared with glyceraldehyde-3-phosphate dehydrogenase) in Mel202 cells at the indicated time points after transfection with an Id2 antisense vector or the empty control vector. Bars, SE. D, Luciferase transcription assays in Mel290 and Mel202 class 1 uveal melanoma cells cotransfected with an E-cadherin promoter-luciferase reporter along with an Id2 antisense vector or an empty control vector. Luciferase activity was measured 48 hours after transfection. Epal mut, mutation of E-pal palindromic element; Ebox2 mut, mutation of the E-box2 element; Ebox-null, mutation of all E-boxes. Bars, SE. Cartoon depicts current hypothesis to explain effect of Id2 on E-pal and E-box2 elements (see text for details).
Id2negatively regulates E-cadherin in uveal melanoma cells
The finding that Id2 inhibits E-cadherin expression in uveal melanoma cells was unexpected because Id proteins have been shown to activate E-cadherin in epithelial cells by inhibiting E2A proteins, which repress the E-cadherin promoter in these cells through interaction with the E-pal element (22, 23). To address this apparent contradiction, we examined the E-cadherin promoter in uveal melanoma cells by transfecting a luciferase reporter driven by the E-cadherin promoter. This promoter construct contained the palindromic E-box (E-pal), a second E-box just upstream of the transcription start site (E-box2), and a third E-box downstream of the start site (13, 17). The promoter was weakly activated in cells cotransfected with a control expression vector, but it was strongly activated in cells cotransfected with the Id2 antisense vector (Fig. 3D). Mutation of the E-pal element had no effect in control-transfected cells, but it caused a marked increase in promoter activity in Id2-depleted cells (Fig. 3D), indicating that Id2 inhibits the E-pal element in uveal melanoma cells just as it does in epithelial cells. However, mutation of the E-box2 abolished activation of the E-cadherin promoter in uveal melanoma cells depleted of Id2, indicating that Id2 also inhibits the E-box2 in these cells resulting in a net inhibitory effect on E-cadherin expression. As expected, mutation of all three E-boxes (Ebox-null) ablated promoter activity. These results may explain the divergent effects of Id2 in epithelial versus uveal melanoma cells and predict the existence of a strong activator of the E-box2 in uveal melanoma (Fig. 3D). This conclusion is consistent with previous work showing that suppression of E-cadherin expression in nonepithelial cells is maintained by constitutive repression of the promoter (24) and that Id2 suppresses epithelial differentiation in the neural crest lineage (25). Id2 itself does not contain a DNA-binding domain or interact directly with the promoter but rather regulates gene expression through inhibitory interactions with basic helix-loop-helix transcription factors (26). Verification of such an E-box2-associated epithelial factor in uveal melanomas may provide a novel therapeutic target to block formation of the class 2 phenotype.
E-cadherin expression promotes anchorage-independent growth
Because anchorage independence is a fundamental characteristic of malignant cells, we wished to determine whether the epithelial alteration in class 2 tumors might promote anchorage-independent growth. We transfected Mel202 cells with the control vector or the Id2 antisense vector and determined their ability to form colonies in soft agar. Depletion of Id2, with consequent up-regulation of membranous E-cadherin as shown above, greatly enhanced the ability of tumor cells to form colonies compared with control cells (Fig. 4A and B). Further, some of the Id2-deficient colonies formed large multicellular spheroids similar to those formed by epithelial cells grown in three-dimensional cultures (20). Importantly, colony formation was ablated by incubation of cells with an E-cadherin-neutralizing antibody (DECMA1), indicating that the anchorage-independent growth was dependent on membranous E-cadherin expression.
Figure 4.
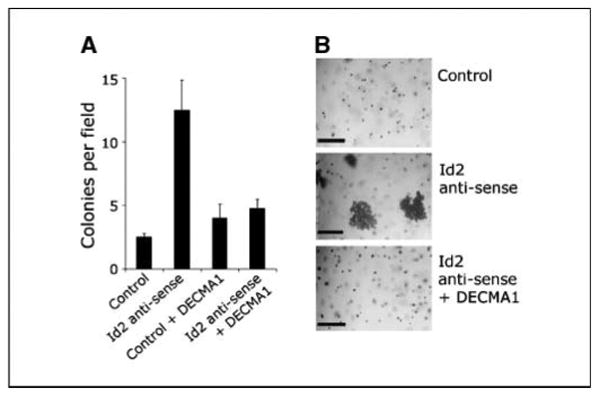
Depletion of Id2 leads to up-regulation of E-cadherin and anchorage-independent growth in uveal melanoma cells. A, anchorage-independent colony formation of Mel202 melanoma cells in soft agar, measured as the number of colonies per ×20 field following transfection with an Id2 antisense vector or an empty control vector. DECMA1 indicates that soft agar was incubated with neutralizing anti-E-cadherin antibodies. Columns, mean of triplicate experiments; bars, SE. B, representative bright-field photomicrographs from soft agar assays, showing 3-(4,5-dimethylthiazol-2-yl)-2,5-diphenyltetrazolium bromide–stained viable tumor cells. Large multicellular spheroids were seen only in cells transfected with the Id2 antisense vector (middle). Bars, 150 μm.
Class 2tumor phenotype is recapitulated by deletion of Id2 in a mouse model
To investigate further the possibility that the epithelial alteration in class 2 tumors may be mediated, at least in part, by loss of Id2 expression, we used a mouse ocular melanoma model in which large T antigen expression is placed under the control of the tyrosinase promoter (14). On the C57BL/6 genetic background, these TyrTAg mice develop tumors that arise primarily from the retinal pigment epithelium (14), but when crossed into the 129/Sv genetic background the animals developed small uveal tumors composed of fusiform cells and resembling class 1 uveal melanomas (Fig. 5A). Id2 mRNA was expressed in the pigmented layers of the mouse eye at embryonic day 14.5 by in situ hybridization, at age 3 months by real-time PCR, and in the pigmented ocular tumors (Supplementary Fig. S3). Thus, these animals represented the best available model for determining the effect of Id2 loss on tumor phenotype. The TyrTAg mice were crossed with Id2+/− heterozygotes to generate transgenic mice with all three Id2 genotypes. In contrast to the small spindle tumors in TyrTAg-Id2+/+ mice, TyrTAg-Id2−/− mice developed significantly larger tumors with a prominent vertical growth phase (Fig. 5A). Interestingly, some TyrTAg-Id2+/− heterozygotes also developed larger tumors but at a significantly later age than the homozygotes (Fig. 5A). Even more striking was the effect of Id2 loss on cytologic phenotype. Whereas TyrTAg-Id2+/+ tumors exhibited well-differentiated spindle cells growing in a horizontal pattern, similar to class 1 human tumors, Id2-deficient tumors displayed an abundance of large, polygonal cells reminiscent of the epithelioid cells in class 2 human tumors (Fig. 5B). There was a strong correlation between the Id2 genotype and the proportion of epithelioid cells (Fig. 5C). Further, E-cadherin and β-catenin expression patterns mimicked those of the human tumors. TyrTAg-Id2+/+ tumors showed weak cytoplasmic expression of E-cadherin and β-catenin (Fig. 5B), comparable with class 1 human tumors (Fig. 1C). In contrast, the Id2-deficient tumors exhibited strong plasma membrane expression of E-cadherin and β-catenin (Fig. 5B), comparable with class 2 human tumors (Fig. 1C). Remarkably, the extracellular matrix patterns in the mouse tumors also replicated the findings in human tumors. TyrTAg-Id2+/+ tumors exhibited a mesenchymal pattern of loose reticular matrix surrounding each tumor cell (Fig. 5B), similar to class 1 human tumors (Fig. 1C), whereas the Id2-deficient tumors contained complex sheets of basement membrane-like extracellular matrix surrounding clusters of tumor cells (Fig. 5B), virtually identical to class 2 human tumors (Fig. 1C).
Figure 5.
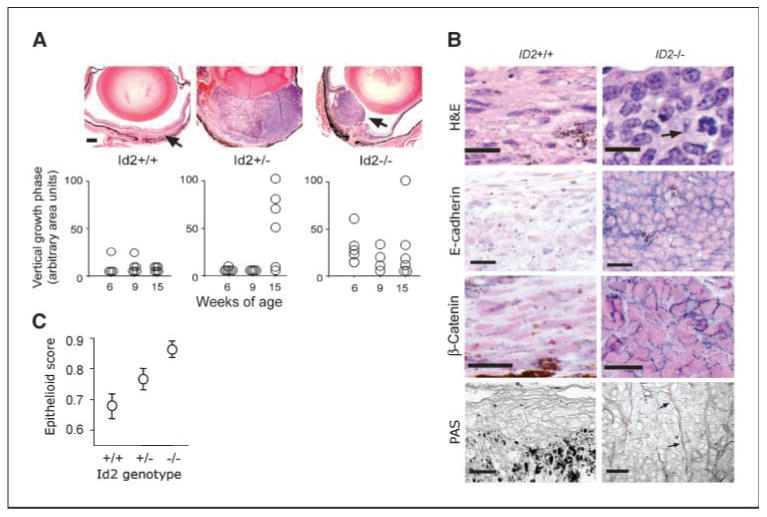
Deletion of Id2 recapitulates the class 2 phenotype in a mouse model of uveal melanoma. A, low-magnification images of representative ocular tumors from 15-week-old mice with the indicated Id2 genotypes stained with H&E. Arrow, location of a typical small,flat ocular tumor observed in Id2+/+ mice. Bars,100 Am. Bottom, corresponding graph summarizing the vertical growth phase cross-sectional tumor areas for all eyes with that genotype at age 6,9, and 15 weeks. B, representative high-magnification images of ocular tumors with the Id2+/+ and Id2−/− genotypes stained with H&E (arrow indicates mitotic figure),immunostained using antibodies against E-cadherin or β-catenin (blue, positive staining),or stained with PAS. Note the low-grade fusiform cells in the Id2+/+ tumor compared with the large,round epithelioid cells in the Id2−/− tumor. PAS staining is displayed using grayscale images to show extracellular matrix patterns (arrows). Bars,20 Am. C, proportion of epithelioid cells in TyrTAg ocular tumors with the three Id2 genotypes,measured as epithelioid score (mean nuclear circularity).
The mitotic index was significantly greater in Id2-deficient tumors compared with TyrTAg-Id2+ + tumors (data not shown), suggesting that the tumor growth associated with Id2 loss could be due at least in part to increased proliferative activity. On the other hand, there was no difference in tumor microvascular density between the three Id2 genotypes (data not shown), and there was no tumor inflammatory infiltration in any of the Id2 genotypes (data not shown). Thus, there was no evidence that the angiogenesis or immune defects in Id2-deficient mice (15) accounted for the differences in size and cytology between Id2 wild-type and Id2-deficient animals. Neither loss of heterozygosity at the Id2 locus nor absence of Id2 mRNA expression by in situ hybridization was identified in the high-grade Id2+/− tumors (data not shown), indicating that Id2 may be haploinsufficient to prevent the epithelial alteration. Unfortunately, we were unable to assess these animals for metastatic disease because they developed fungating ocular tumors by 15 weeks that caused obvious distress before metastasis developed.
Discussion
These studies provide new biological insights into uveal melanoma and establish a unifying framework for understanding the relationship between previous prognostic features and the new gene expression-based classification for this cancer. Our findings suggest that the parallel changes in cell morphology, tissue organization, and gene expression profile between class 1 and class 2 tumors can be viewed as a shift from a low-grade (class 1) neural crest/melanocytic phenotype to a high-grade (class 2) epithelial-like phenotype. Although these findings do not rule out the possibility that the class 2 tumors may express genes associated with other cell lineages, the dominant theme seems to be an epithelial-like phenotype.
A paradoxical role for E-cadherin in uveal melanoma progression?
Transcriptional up-regulation and plasma membrane localization of E-cadherin were key features of the class 2 metastasizing tumor phenotype. This may seem to be surprising, because E-cadherin is more often thought of as a tumor suppressor that is down-regulated during cancer progression (27). In fact, the role of E-cadherin in tumor progression is context dependent. Epithelial cancers and cutaneous melanomas arise within an epithelium where cells are constrained by E-cadherin-mediated cell-cell interactions. Hence, it is necessary in the early stages of these cancers to down-regulate E-cadherin to escape the local epithelial environment and invade local structures (27). In contrast, uveal melanomas do not arise within an epithelium and are not constrained in this manner by E-cadherin. Further, anatomic constraints of the eye prohibit local lymphatic invasion and require uveal melanomas to spread by hematogenous metastasis (1). Consequently, it may be more appropriate to compare class 2 uveal melanomas with advanced epithelial cancers and cutaneous melanomas that exhibit hematogenous metastasis rather than earlier stages associated with local and regional invasion. When this comparison is made, there are striking similarities between our findings and those from other cancers.
In gastric cancer, for example, where E-cadherin is firmly established as a tumor suppressor that is down-regulated early in cancer formation, E-cadherin is often reexpressed later in cancer progression (28). In fact, advanced gastric cancers that metastasize to the liver usually exhibit up-regulation of E-cadherin, whereas those that spread to regional lymphatics have low E-cadherin expression (29). Similarly, up-regulation of E-cadherin is associated with advanced stages of hepatocellular carcinoma (30) and inflammatory breast cancer (31). Likewise, cutaneous melanomas reexpress E-cadherin in later stages of tumor progression associated with hematogenous metastasis (32, 33). E-cadherin-expressing cutaneous melanomas are similar to class 2 uveal melanomas vis-à-vis epithelioid cytology, membranous β-catenin expression, and formation of multicellular clusters (34, 35). Intriguingly, there was a significant overlap in our class-discriminating gene list and the genes that were differentially expressed in radial versus vertical growth-phase cutaneous melanomas (36). Thus, it seems likely that the up-regulation of E-cadherin and shift to epithelial-like phenotype in class 2 uveal melanoma cells is not unique to this cancer type but may reflect a general strategy implemented in many cancers at advanced stages associated with distant metastasis.
E-cadherin could promote metastasis by several mechanisms, all of which may be operative. First, E-cadherin expression may allow metastatic cells to survive in the bloodstream. Most cells (including melanocytes) require interactions with extracellular matrix or with other cells to prevent apoptosis (37). Survival signals stemming from E-cadherin-mediated cell-cell interactions can allow tumor cells to become independent of matrix contact (Fig. 4A and B). The anchorage independence conferred by E-cadherin may then permit melanoma cells to dissociate from the primary tumor and survive during hematogenous transit to distant organs. Similarly, these survival signals stemming from E-cadherin-mediated cell-cell interactions may create a permissive environment for accumulation of additional mutations required for cancer progression and metastasis (38). In fact, the formation of these E-cadherin-dependent multicellular structures may explain, at least in part, the profound chemoresistance typical of metastatic uveal melanoma cells (39). Finally, expression of E-cadherin on the surface of metastatic tumor cells may promote successful colonization of distant organs. For example, liver metastasis in several types of cancer has been attributed to interactions between E-cadherin expressed on metastatic tumor cells and adhesion molecules expressed on hepatocytes (30).
Role of Id2 in uveal melanoma progression
Id2 is a dominant-negative inhibitor of basic helix-loop-helix transcription factors (40). Previous work has focused primarily on the oncogenic properties on Id2, including its ability to inhibit cell differentiation and promote cell proliferation (40). In reality, Id2 has diverse and complex biological effects depending on cell lineage, differentiation state, and other contextual considerations (41). Indeed, Id2 can function as a tumor suppressor in intestinal neoplasia (42).
Our studies provide evidence that loss of Id2 plays a role in uveal melanoma progression by allowing the emergence of the epithelial-like class 2 phenotype. This finding is consistent with other work showing that Id2 is down-regulated in melanomas of the skin and eye (7, 43) and that Id2 is capable of inhibiting epithelial differentiation in neural crest (25) and in keratinocytes (44). Our experiments predict the existence of an activator associated with the E-box2 element of the E-cadherin promoter that is inhibited by Id2. Further studies are ongoing to identify this putative protein and to determine whether it may be a rational target for therapeutic intervention.
The mechanism of Id2 down-regulation in the class 2 tumors remains unclear. No gene deletions were identified at the ID2 locus. Methylation of the ID2 promoter was detected in some class 2 tumors (Supplementary Fig. S1D), but reexpression of Id2 could not be validated using demethylating agents. It is also possible that subtle gene mutations not detected by our analyses could disrupt Id2 at the transcriptional or translational level. Alternatively, Id2 could be transcriptionally down-regulated as a result of upstream genetic events. Because most class 2 tumors exhibit monosomy 3 (7, 8), it is tempting to speculate that loss of one or more genes on this chromosome may be lead indirectly to down-regulation of Id2. One such candidate is ID2B, which is an expressed pseudogene that shares ∼ 100% identity with ID2 and is located in a region of chromosome 3p that commonly is deleted in class 2 uveal melanomas (45). The transcribed RNA from ID2B potentially could stabilize Id2 mRNA as has been shown for other genes and their associated pseudogenes (46). Studies are under way to determine which of these mechanisms is correct.
Relationship between class 2phenotype and looping matrix patterns
Looping extracellular matrix patterns are found in uveal and cutaneous melanomas, inflammatory breast cancers, and some other neoplasms, and they have been the subject of intense investigation and controversy, owing to their strong association with metastatic death (19) and their putative function as fluid conducting meshworks (47). Our results suggest that the matrix patterns, which occur almost exclusively in class 2 tumors (9), may be another manifestation of epithelial differentiation in these tumors. The matrix patterns are composed of epithelial basement membrane components, such as laminin, heparan sulfate, type IV collagen, and fibronectin (48, 49), and our class-discriminating gene list was enriched for genes expressed in basement membrane-producing cells, including CITED1, LAMC1, COL4A1, and SPARC (50). Finally, the matrix patterns bear a remarkable similarity to the basement membrane sheets formed by epithelial cells in three-dimensional cultures (20). The possibility that activation of an epithelial gene expression program accounts for the matrix patterns and other epithelial features of the class 2 tumors is an appealing idea that will need to be confirmed by further work.
Acknowledgments
Grant support: National Eye Institute grant RO1 EY13169 and Research to Prevent Blindness, Inc., Physician Scientist Award (J.W. Harbour), Knights Templar Foundation (M.D. Onken), and Research to Prevent Blindness unrestricted grant (Department of Ophthalmology and Visual Sciences, Washington University School of Medicine).
Footnotes
Note: Supplementary data for this article are available at Cancer Research Online (http://cancerres.aacrjournals.org/).
References
- 1.Harbour JW. Clinical overview of uveal melanoma: introduction to tumors of the eye. In: Albert DM, Polans A, editors. Ocular oncology. New York: Marcel Dekker; 2003. pp. 1–18. [Google Scholar]
- 2.Eskelin S, Pyrhonen S, Summanen P, Hahka-Kemppinen M, Kivela T. Tumor doubling times in metastatic malignant melanoma of the uvea: tumor progression before and after treatment. Ophthalmology. 2000;107:1443–9. doi: 10.1016/s0161-6420(00)00182-2. [DOI] [PubMed] [Google Scholar]
- 3.Callender GR. Malignant melanotic tumors of the eye: a study of histologic types in 111 cases. Trans Am Acad Ophthalmol Otolaryngol. 1931;36:131–42. [Google Scholar]
- 4.Folberg R, Pe'er J, Gruman LM, et al. The morphologic characteristics of tumor blood vessels as a marker of tumor progression in primary human uveal melanoma: a matched case-control study. Hum Pathol. 1992;23:1298–305. doi: 10.1016/0046-8177(92)90299-i. [DOI] [PubMed] [Google Scholar]
- 5.Gamel JW, McLean IW. Quantitative analysis of the Callender classification of uveal melanoma cells. Arch Ophthalmol. 1977;95:686–91. doi: 10.1001/archopht.1977.04450040152024. [DOI] [PubMed] [Google Scholar]
- 6.Prescher G, Bornfeld N, Hirche H, Horsthemke B, Jockel KH, Becher R. Prognostic implications of monosomy 3 in uveal melanoma. Lancet. 1996;347:1222–5. doi: 10.1016/s0140-6736(96)90736-9. [DOI] [PubMed] [Google Scholar]
- 7.Tschentscher F, Husing J, Holter T, et al. Tumor classification based on gene expression profiling shows that uveal melanomas with and without monosomy 3 represent two distinct entities. Cancer Res. 2003;63:2578–84. [PubMed] [Google Scholar]
- 8.Onken MD, Worley LA, Ehlers JP, Harbour JW. Gene expression profiling in uveal melanoma reveals two molecular classes and predicts metastatic death. Cancer Res. 2004;64:7205–9. doi: 10.1158/0008-5472.CAN-04-1750. [DOI] [PMC free article] [PubMed] [Google Scholar]
- 9.Onken MD, Lin AY, Worley LA, Folberg R, Harbour JW. Association between microarray gene expression signature and extravascular matrix patterns in primary uveal melanomas. Am J Ophthalmol. 2005;140:748–9. doi: 10.1016/j.ajo.2005.04.024. [DOI] [PubMed] [Google Scholar]
- 10.Pinkel D, Segraves R, Sudar D, et al. High resolution analysis of DNA copy number variation using comparative genomic hybridization to microarrays. Nat Genet. 1998;20:207–11. doi: 10.1038/2524. [DOI] [PubMed] [Google Scholar]
- 11.Loercher AE, Tank EM, Delston RB, Harbour JW. MITF links differentiation with cell cycle arrest in melanocytes by transcriptional activation of INK4A. J Cell Biol. 2005;168:35–40. doi: 10.1083/jcb.200410115. [DOI] [PMC free article] [PubMed] [Google Scholar]
- 12.Iavarone A, Garg P, Lasorella A, Hsu J, Israel MA. The helix-loop-helix protein Id-2 enhances cell proliferation and binds to the retinoblastoma protein. Genes Dev. 1994;8:1270–84. doi: 10.1101/gad.8.11.1270. [DOI] [PubMed] [Google Scholar]
- 13.Hajra KM, Chen DY, Fearon ER. The SLUG zinc-finger protein represses E-cadherin in breast cancer. Cancer Res. 2002;62:1613–8. [PubMed] [Google Scholar]
- 14.Syed NA, Windle JJ, Darjatmoko SR, et al. Transgenic mice with pigmented intraocular tumors: tissue of origin and treatment. Invest Ophthalmol Vis Sci. 1998;39:2800–5. [PubMed] [Google Scholar]
- 15.Yokota Y, Mansouri A, Mori S, et al. Development of peripheral lymphoid organs and natural killer cells depends on the helix-loop-helix inhibitor Id2. Nature. 1999;397:702–6. doi: 10.1038/17812. [DOI] [PubMed] [Google Scholar]
- 16.Makitie T, Summanen P, Tarkkanen A, Kivela T. Tumor-infiltrating macrophages (CD68(+) cells) and prognosis in malignant uveal melanoma. Invest Ophthalmol Vis Sci. 2001;42:1414–21. [PubMed] [Google Scholar]
- 17.Cano A, Perez-Moreno MA, Rodrigo I, et al. The transcription factor snail controls epithelial-mesenchymal transitions by repressing E-cadherin expression. Nat Cell Biol. 2000;2:76–83. doi: 10.1038/35000025. [DOI] [PubMed] [Google Scholar]
- 18.Hendrix MJ, Seftor EA, Seftor RE, et al. Biologic determinants of uveal melanoma metastatic phenotype: role of intermediate filaments as predictive markers. Lab Invest. 1998;78:153–63. [PubMed] [Google Scholar]
- 19.Maniotis AJ, Folberg R, Hess A, et al. Vascular channel formation by human melanoma cells in vivo and in vitro: vasculogenic mimicry. Am J Pathol. 1999;155:739–52. doi: 10.1016/S0002-9440(10)65173-5. [DOI] [PMC free article] [PubMed] [Google Scholar]
- 20.Debnath J, Brugge JS. Modelling glandular epithelial cancers in three-dimensional cultures. Nat Rev Cancer. 2005;5:675–88. doi: 10.1038/nrc1695. [DOI] [PubMed] [Google Scholar]
- 21.Rockman SP, Currie SA, Ciavarella M, et al. Id2 is a target of the h-catenin/T cell factor pathway in colon carcinoma. J Biol Chem. 2001;276:45113–9. doi: 10.1074/jbc.M107742200. [DOI] [PubMed] [Google Scholar]
- 22.Kondo M, Cubillo E, Tobiume K, et al. A role for Id in the regulation of TGF-h-induced epithelial-mesenchymal transdifferentiation. Cell Death Differ. 2004;11:1092–101. doi: 10.1038/sj.cdd.4401467. [DOI] [PubMed] [Google Scholar]
- 23.Perez-Moreno MA, Locascio A, Rodrigo I, et al. A new role for E12/E47 in the repression of E-cadherin expression and epithelial-mesenchymal transitions. J Biol Chem. 2001;276:27424–31. doi: 10.1074/jbc.M100827200. [DOI] [PubMed] [Google Scholar]
- 24.Zhang Z, Yuan XM, Li LH, Xie FP. Transdifferentiation of neoplastic cells. Med Hypotheses. 2001;57:655–66. doi: 10.1054/mehy.2001.1435. [DOI] [PubMed] [Google Scholar]
- 25.Martinsen BJ, Bronner-Fraser M. Neural crest specification regulated by the helix-loop-helix repressor Id2. Science. 1998;281:988–91. doi: 10.1126/science.281.5379.988. [DOI] [PubMed] [Google Scholar]
- 26.Sun XH, Copeland NG, Jenkins NA, Baltimore D. Id proteins Id1 and Id2 selectively inhibit DNA binding by one class of helix-loop-helix proteins. Mol Cell Biol. 1991;11:5603–11. doi: 10.1128/mcb.11.11.5603. [DOI] [PMC free article] [PubMed] [Google Scholar]
- 27.Christofori G, Semb H. The role of the cell-adhesion molecule E-cadherin as a tumour-suppressor gene. Trends Biochem Sci. 1999;24:73–6. doi: 10.1016/s0968-0004(98)01343-7. [DOI] [PubMed] [Google Scholar]
- 28.Nakamura E, Sugihara H, Bamba M, Hattori T. Dynamic alteration of the E-cadherin/catenin complex during cell differentiation and invasion of undifferentiated-type gastric carcinomas. J Pathol. 2005;205:349–58. doi: 10.1002/path.1718. [DOI] [PubMed] [Google Scholar]
- 29.Esaki Y, Hirayama R, Hirokawa K. A comparison of patterns of metastasis in gastric cancer by histologic type and age. Cancer. 1990;65:2086–90. doi: 10.1002/1097-0142(19900501)65:9<2086::aid-cncr2820650933>3.0.co;2-b. [DOI] [PubMed] [Google Scholar]
- 30.Osada T, Sakamoto M, Ino Y, et al. E-cadherin is involved in the intrahepatic metastasis of hepatocellular carcinoma. Hepatology. 1996;24:1460–7. doi: 10.1053/jhep.1996.v24.pm0008938181. [DOI] [PubMed] [Google Scholar]
- 31.Tomlinson JS, Alpaugh ML, Barsky SH. An intact overexpressed E-cadherin/a,h-catenin axis characterizes the lymphovascular emboli of inflammatory breast carcinoma. Cancer Res. 2001;61:5231–41. [PubMed] [Google Scholar]
- 32.Danen EH, de Vries TJ, Morandini R, Ghanem GG, Ruiter DJ, van Muijen GN. E-cadherin expression in human melanoma. Melanoma Res. 1996;6:127–31. doi: 10.1097/00008390-199604000-00007. [DOI] [PubMed] [Google Scholar]
- 33.Cowley GP, Smith ME. Cadherin expression in melanocytic naevi and malignant melanomas. J Pathol. 1996;179:183–7. doi: 10.1002/(SICI)1096-9896(199606)179:2<183::AID-PATH554>3.0.CO;2-W. [DOI] [PubMed] [Google Scholar]
- 34.Silye R, Karayiannakis AJ, Syrigos KN, et al. E-cadherin/catenin complex in benign and malignant melanocytic lesions. J Pathol. 1998;186:350–5. doi: 10.1002/(SICI)1096-9896(199812)186:4<350::AID-PATH181>3.0.CO;2-K. [DOI] [PubMed] [Google Scholar]
- 35.Sanders DS, Blessing K, Hassan GA, Bruton R, Marsden JR, Jankowski J. Alterations in cadherin and catenin expression during the biological progression of melanocytic tumours. Mol Pathol. 1999;52:151–7. doi: 10.1136/mp.52.3.151. [DOI] [PMC free article] [PubMed] [Google Scholar]
- 36.Haqq C, Nosrati M, Sudilovsky D, et al. The gene expression signatures of melanoma progression. Proc Natl Acad Sci U S A. 2005;102:6092–7. doi: 10.1073/pnas.0501564102. [DOI] [PMC free article] [PubMed] [Google Scholar]
- 37.Fouquet S, Lugo-Martinez VH, Faussat AM, et al. Early loss of E-cadherin from cell-cell contacts is involved in the onset of anoikis in enterocytes. J Biol Chem. 2004;279:43061–9. doi: 10.1074/jbc.M405095200. [DOI] [PubMed] [Google Scholar]
- 38.Francia G, Green SK, Bocci G, et al. Down-regulation of DNA mismatch repair proteins in human and murine tumor spheroids: implications for multicellular resistance to alkylating agents. Mol Cancer Ther. 2005;4:1484–94. doi: 10.1158/1535-7163.MCT-04-0214. [DOI] [PubMed] [Google Scholar]
- 39.Baggetto LG, Gambrelle J, Dayan G, et al. Major cytogenetic aberrations and typical multidrug resistance phenotype of uveal melanoma: current views and new therapeutic prospects. Cancer Treat Rev. 2005;31:361–79. doi: 10.1016/j.ctrv.2005.05.001. [DOI] [PubMed] [Google Scholar]
- 40.Yokota Y. Id and development. Oncogene. 2001;20:8290–8. doi: 10.1038/sj.onc.1205090. [DOI] [PubMed] [Google Scholar]
- 41.Kowanetz M, Valcourt U, Bergstrom R, Heldin CH, Moustakas A. Id2 and Id3 define the potency of cell proliferation and differentiation responses to transforming growth factor β and bone morphogenetic protein. Mol Cell Biol. 2004;24:4241–54. doi: 10.1128/MCB.24.10.4241-4254.2004. [DOI] [PMC free article] [PubMed] [Google Scholar]
- 42.Russell RG, Lasorella A, Dettin LE, Iavarone A. Id2 drives differentiation and suppresses tumor formation in the intestinal epithelium. Cancer Res. 2004;64:7220–5. doi: 10.1158/0008-5472.CAN-04-2095. [DOI] [PubMed] [Google Scholar]
- 43.Bloethner S, Chen B, Hemminki K, et al. Effect of common B-RAF and N-RAS mutations on global gene expression in melanoma cell lines. Carcinogenesis. 2005;26:1224–32. doi: 10.1093/carcin/bgi066. [DOI] [PubMed] [Google Scholar]
- 44.Simbulan-Rosenthal CM, Trabosh V, Velarde A, et al. Id2 protein is selectively upregulated by UVB in primary, but not in immortalized human keratinocytes and inhibits differentiation. Oncogene. 2005;24:5443–58. doi: 10.1038/sj.onc.1208709. [DOI] [PubMed] [Google Scholar]
- 45.Kurabayashi M, Jeyaseelan R, Kedes L. Two distinct cDNA sequences encoding the human helix-loop-helix protein Id2. Gene. 1993;133:305–6. doi: 10.1016/0378-1119(93)90658-p. [DOI] [PubMed] [Google Scholar]
- 46.Hirotsune S, Yoshida N, Chen A, et al. An expressed pseudogene regulates the messenger-RNA stability of its homologous coding gene. Nature. 2003;423:91–6. doi: 10.1038/nature01535. [DOI] [PubMed] [Google Scholar]
- 47.Clarijs R, Otte-Holler I, Ruiter DJ, de Waal RM. Presence of a fluid-conducting meshwork in xenografted cutaneous and primary human uveal melanoma. Invest Ophthalmol Vis Sci. 2002;43:912–8. [PubMed] [Google Scholar]
- 48.Folberg R, Maniotis AJ. Vasculogenic mimicry. APMIS. 2004;112:508–25. doi: 10.1111/j.1600-0463.2004.apm11207-0810.x. [DOI] [PubMed] [Google Scholar]
- 49.Lin AY, Maniotis AJ, Valyi-Nagy K, et al. Distinguishing fibrovascular septa from vasculogenic mimicry patterns. Arch Pathol Lab Med. 2005;129:884–92. doi: 10.5858/2005-129-884-DFSFVM. [DOI] [PubMed] [Google Scholar]
- 50.Futaki S, Hayashi Y, Yamashita M, et al. Molecular basis of constitutive production of basement membrane components. Gene expression profiles of Engelbreth-Holm-Swarm tumor and F9 embryonal carcinoma cells. J Biol Chem. 2003;278:50691–701. doi: 10.1074/jbc.M304985200. [DOI] [PubMed] [Google Scholar]