

Abstract
Optogenetic systems utilize genetically-encoded proteins that change conformation in response to specific wavelengths of light to alter cellular processes. There is a need for culturing and measuring systems that incorporate programmed illumination and stimulation of optogenetic systems. We present a protocol for building and using a continuous culturing apparatus to illuminate microbial cells with programmed doses of light, and automatically acquire and analyze images of cells in the effluent. The operation of this apparatus as a chemostat allows the growth rate and the cellular environment to be tightly controlled. The effluent of the continuous cell culture is regularly sampled and the cells are imaged by multi-channel microscopy. The culturing, sampling, imaging, and image analysis are fully automated so that dynamic responses in the fluorescence intensity and cellular morphology of cells sampled from the culture effluent are measured over multiple days without user input. We demonstrate the utility of this culturing apparatus by dynamically inducing protein production in a strain of Saccharomyces cerevisiae engineered with an optogenetic system that activates transcription.
Keywords: Bioengineering, Issue 120, Optogenetics, microbiology, synthetic biology, chemostat, Saccharomyces cerevisiae, budding yeast, control, system identification, protein expression
Introduction
Optogenetic systems use light to control a growing list of cellular processes including gene expression,1,2,3,4,5 protein localization,6 protein activity,6,7,8 protein binding,8,9,10 and protein degradation.11 A method for culturing cells in a controlled environment with programmed optical stimulation and for measuring their response over biologically relevant timescales is necessary to exploit the potential of these tools for research in cell biology and biotechnology. Our method takes advantage of chemostasis to maintain a constant cell growth rate in a well-mixed, aerated, and temperature-controlled glass culturing vessel12,13 that is exposed to programmed illumination. We image individual cells in the culture effluent with an inverted microscope to measure the response of the culture to programmed illumination. The culturing, sampling, imaging, and image analysis are fully automated so that the fluorescence intensity and cellular morphology of the effluent cell culture can be measured over multiple days without user input.
This protocol can be implemented in most labs familiar with growing cell culture and microscopy, and the apparatus used is inexpensive and made of readily available components. A transparent culturing vessel is placed above a matrix of light emitting diodes (LEDs) capable of emitting 1 µW/cm2-10 mW/cm2 of light. Microbes are grown in the culturing vessel continuously; one peristaltic pump is used to add media at the dilution rate, another is used to withdraw culture at a lesser rate to the microscope, and the difference escapes through an overflow outlet. A heating pad maintains the temperature. Air is continually pumped into the culturing vessel to maintain a positive pressure as well as to mix and aerate the culture. Except for the air pump, power to these devices is regulated by a microcontroller that also receives input from a thermometer and a connected desktop computer. The effluent cell culture is pumped to a microfluidic device on the stage of an inverted microscope. Non-fluorescent and fluorescent images are automatically acquired. The cells in the images are characterized by an algorithm that locates each cell as a region of interest (ROI) and measures the properties of each ROI.
To demonstrate an application of this protocol, we measured the response to varying light intensities of Saccharomyces cerevisiae cells engineered with a blue-light responsive optogenetic system which controls the transcription of fluorescent protein. S. cerevisiae, commonly known as baker's yeast, was selected because multiple optogenetic systems for controlling gene expression in this system already exist14,15,16. Furthermore, this model organism is commonly used for studies in systems biology17 and as a chassis for biotechnological applications18,19,20. Our representative results demonstrate that this protocol can be used to control transcription of a culture over multiple days by varying input light intensities and measuring the production of a fluorescent reporter.
Protocol
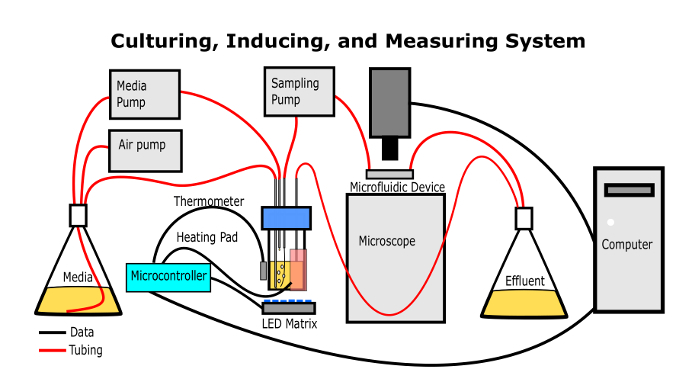
Figure 1: The continuous culturing apparatus. This simplified diagram shows how the apparatus should be assembled when it is used to culture, illuminate, and measure optical properties of the microbes. Please click here to view a larger version of this figure.
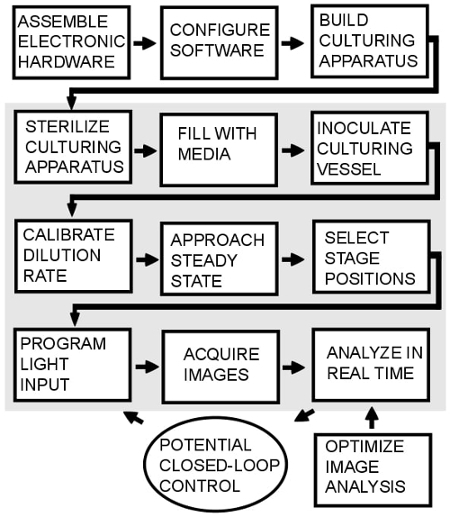 Figure 2: Overview of the protocol. The steps in the shaded region must be repeated every time the protocol is used. Closed loop control is possible34, but is not implemented in this protocol.
1. Assemble the Thermometer to the Circuit Board
 Figure 3: Connections to read thermometer values. This diagram shows how the digital thermometer should be connected to the PCB so that the microcontroller can get feedback to control the temperature of the culture. Please click here to view a larger version of this figure.
Solder the Ground, Data, and positive Voltage lines of the digital thermometer to their respective through-holes marked "G D +V."
Clip off one pin from a female 3-pin header and trim the remaining 2 pins with wire clippers, such that it can fit into the two through-holes labelled "R2" and not obstruct the microcontroller. Solder this in place. Connect the two soldered pins by inserting a 4.7 kΩ resistor in the pin header.
2. Connect the Power Control Components to the Circuit Board
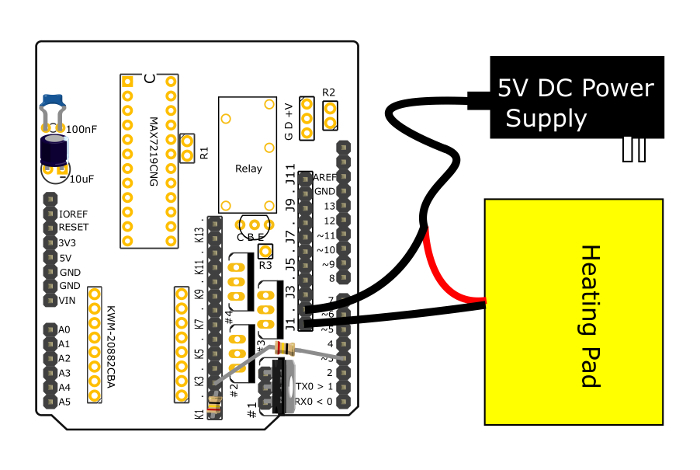 Figure 4: Connections to control power to the heating pad. This diagram shows how the PCB and accessory parts should be assembled in order to control power to the heating pad. The parts to control the peristaltic pumps are connected in a similar manner. Note that the components for the thermometer have been removed for clarity. Please click here to view a larger version of this figure.
Trim off 1 cm from the pins of five female 3-pin headers. Solder these to the positions on the printed circuit board (PCB) marked as "#1," "#2," "#3," "#4," and "C B E."
Trim off 1 cm from the pins of a female 6-pin and 8-pin header. Solder these side by side to the column of through-holes labeled K1 through K14.
- Connect the heating pad to the circuit board.
- Insert the ends of a 100 kΩ resistor in the through-holes labeled K1 and K2 on the PCB. Insert a metal-oxide-semiconductor field-effect transistor (MOSFET) into the position marked #1 on the PCB, with the label of the MOSFET facing towards the K1 through K14 through-holes so that the source pin is closest to the "#" label, and the drain pin is furthest from the "#" label.
- Cut the ground line of the 5 V direct current (DC) power supply cable and connect it to J2. Connect the ground line of the heating pad to J1. Connect K3 to pin 3 with a 1 kΩ resistor. Current should now only flow from J1 to J2 when pin 3 is set to +5V.z NOTE: The resistor/MOSFET set functions as a switch that allows current to flow from pin J1 to J2 when pin 3 of the microcontroller is set to +5 V.
- Connect the slow peristaltic pump.
- Insert the ends of a 100 kΩ resistor in the through-holes labeled K4 and K5 on the PCB. Insert a MOSFET into the position marked #2 on the PCB, with the label of the MOSFET facing towards the K1 through K14 through-holes so that the source pin is closest to the "#" label, and the drain pin is furthest from the "#" label.
- Cut the ground line of the 12 V DC power supply cable of the slow peristaltic pump. Connect the peristaltic pump facing end to J3 and the wall wart facing end to J4. Connect K6 to pin 4 with a 1 kΩ resistor. Current should now only flow from J3 to J4 when pin 4 is set to +5 V.
- Connect the fast peristaltic pump
- Insert the ends of a 100 kΩ resistor in the through-holes labeled K7 and K9 on the PCB. Insert a MOSFET into the position marked #3 on the PCB, with the label of the MOSFET facing towards the K1 through K14 through-holes so that the source pin is closest to the "#" label, and the drain pin is furthest from the "#" label.
- Cut the ground line of the 12 V DC power supply cable of the fast peristaltic pump. Connect the peristaltic pump facing end to J5 and the wall wart facing end to J6. Connect K9 to pin 5 with a 1 kΩ resistor. Current should now only flow from J5 to J6 when pin 5 is set to +5 V.
3. Connect the LED Matrix to the Circuit Board
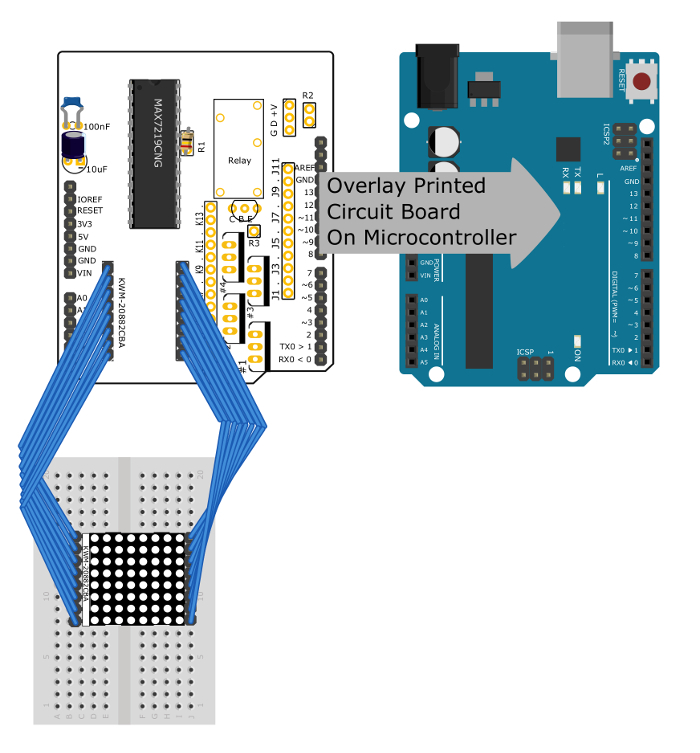 Figure 5: Connections to control the LED matrix. This diagram shows how the LED matrix should be connected to the PCB. It also shows that the PCB can be stacked on the microcontroller. Note that the components for the thermometer and for controlling DC power to other devices have been removed for clarity. Please click here to view a larger version of this figure.
Solder the 6-pin, 10-pin, and the two 8-pin female pin headers into the through-holes on the sides of the PCB such that it can be stacked on top of the microcontroller.
Solder the 100 nF and the 10 µF capacitors to their marked positions on the PCB, noting that the negative terminal of the 10 µF capacitor (shorter lead) should be connected to the through-hole marked with a negative sign.
Solder the LED driver to the 2 by 12 set of through-holes, with the indentation on the driver far from the through-holes reserved for the LED matrix.
Solder 2 columns of male pin headers to the through-holes marked for the LED matrix, and trim the ends of these underneath the breadboard such that they will not obstruct the microcontroller. Connect these to two 8-wire strips of female/female jumper wires. Connect a second set of male pin headers to the other end of the jumper wires.
Insert the LED matrix over the median of the breadboard, and then insert the second set of pin headers to the columns on either side of the matrix. Ensure that the electrical connections are the same as if the LED matrix had been directly connected to the PCB with the labeled side of the matrix corresponding to the labeled column of through-holes.
Clip off one pin from a female 3-pin header and trim the remaining 2 pins with wire clippers, such that it can fit into the two through-holes labelled "R1" and not obstruct the microcontroller. Solder this. Connect the two soldered pins by inserting a 1 kΩ resistor in the pin header. Note: The culturing vessel will be stacked over the LED matrix. If the wire ribbons obstruct the vessel, offset them from the matrix. Then, use solid core wire to bridge the gap between the matrix pins and the wire ribbon pins, such that the electrical connections do not change.
4. Install Software and Connect to Hardware
Stack the PCB on the microcontroller.
Follow the links in the materials list to download the Integrated Development Environment (IDE) and custom code for the microcontroller.
Connect the microcontroller to the microscope computer via an A-B universal serial bus (USB) cable. Compile and upload the custom code to the microcontroller.
Download Micro-Manager21,22 and FIJI23. Configure Micro-Manager as a FIJI plugin by copying all ".dll" files, the "mmplugins" directory, and the "mmautofocus" directory from the directory where Micro-Manager was downloaded into the "Fiji.app" directory. Also, copy the "plugins/Micro-Manager" directory into the "Fiji.app/plugins" directory.
Download the "BioreactorController.jar" file into the "Fiji.app/mmplugins" directory.
Open Micro-Manager from FIJI> Plugins> Micro-Manager> Micro-Manager Studio. Use the Hardware Configuration Wizard to configure the software to control the microscope. Include the "FreeSerialPort" device in the Wizard with the label of the port to which the A-B USB cable is connected.
5. Make and Characterize the Light-proof Enclosure for the Culturing Vessel
Stack three 8 pin IC sockets as building blocks on the breadboard at each corner of the LED matrix such that the culturing vessel can rest on them above the matrix.
Fasten a portion of diffusion paper under the top layer of the sockets, such that the light striking the culturing vessel from the LED matrix is diffuse.
Cut out three 8" by 6" portions of black foam. Cut out a portion that is the same size as the electronic breadboard (2.3" x 3.5") from the inside of the first two and a portion that is the size of the rectangle made by the IC sockets (0.9" x 1.8") from the inside of the third. Stack these layers over the LED matrix such that the final layer containing the 0.9" x 1.8" aperture lies even with the top of the IC sockets, and surrounds the LED matrix.
Cut an additional sheet of black foam in half to make a 6" by 24" rectangle. Roll this into a hollow column of black foam that the culturing vessel can fit into with room for tubes and wires, such that it will thermally and optically insulate the culturing vessel.
Center the hollow column of black foam over the LED matrix, and mark the boundary of the column on the layer of black foam under it. This boundary will mark where it should be centered in the future.
Cut out a 3" x 3" portion of black foam. Use this later as a lid that can be taped to the top of the column to block external light.
Attach the photodiode power sensor to the culturing vessel's cap with tape, attach the cap, and insert the culturing vessel in the enclosure.
In Micro-Manager, go to Plugins> Bioreactor Controller. Set the matrix to illuminate at a subset of the range of possible intensities at 30 s intervals.
Record the light intensities as displayed on the power meter console connected to the power sensor. These measurements will enable the actual intensity of light to be known when the number of LEDs that are lit and the pulse-width-modulated (PWM) current to those LEDs is set.
6. Prepare the Culturing Vessel
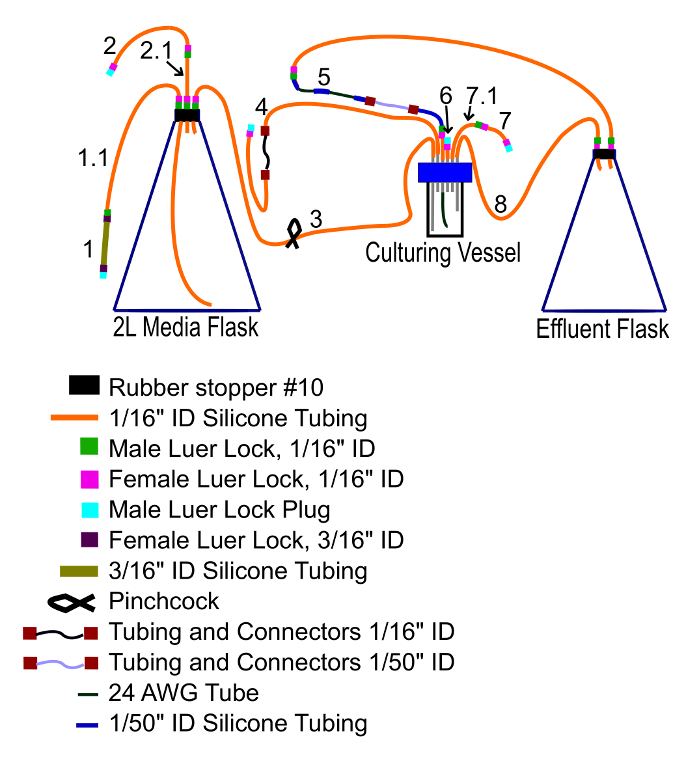 Figure 6: Vessel connections. This diagram shows how the vessel and tubing of the apparatus should be connected prior to being autoclaved. Please click here to view a larger version of this figure.
Mark the height corresponding to every 2 mL increment of liquid in the range of 10 mL to 30 mL in the culturing vessel. Insert 10 mL of sterile deionized water, mark the water level, add 2 mL, mark the water level, and repeat until the 30 mL level is marked. Cover the markings with clear tape so that they are not easily removed, and dispose of the liquid.
Place the long end of the aluminum port through the silicone gasket, into the culturing vessel. Screw on the cap.
Cover one short aluminum port outlet with 1/16" ID silicon tubing. Plug the distal end by inserting a female luer lock and then connecting a male luer lock plug. This outlet is supplementary, and will not be used (tube 6 in Figure 6).
Connect two short segments of 1/16" ID silicone tubing with male and female luer locks. Connect one end to a short aluminum port outlet and plug the distal end with a male luer and female luer lock plug. The vessel will be inoculated through this tube (tube 7/7.1 in Figure 6).
Connect two 1/16" ID tubes to the ends of the 1/16" ID peristaltic tubing and connectors. Connect one end to a short aluminum port and plug the other (tube 4 in Figure 6). Later, this will be connected to the media flask.
7. Prepare the Media Flask
Connect a 1/16" inner diameter (ID) silicone tube to the longest aluminum port. The tube should be long enough to reach the media flask. Connect a 1/8" ID male luer lock to a short segment of 1/16" ID tubing, connect this to the preceding tube,, and then insert this short segment into the rubber stopper on the media flask (tube 3 in Figure 6).
Clamp the tube. This connection allows air to flow from the media flask to the culture vessel. When the media flask is later pumped with air and this tube is unclamped, the culture will be mixed, aerated, and kept at a positive pressure by the incoming bubbles.
Insert a 1/16" ID tube long enough to reach the bottom of the flask into the stopper, through which media will be transferred. Connect another 1/16" ID tube to this one, and then a 3/16" ID tube to that. Plug this with a 3/16" ID female luer lock and a male luer lock plug (tube 1/1.1 in Figure 6).
The third hole in the stopper should be filled with a short segment of 1/16" ID tubing, connected to two other segments of medium diameter tubing and plugged at the distal end (tube 2/2.1 in Figure 6). This will be connected to a vacuum pump and later to an aquarium pump. NOTE: If the tubing cannot easily fit through the holes in the rubber stopper, cut the ends of the tubing at a slant. Then, the slanted end which is pushed through the hole can be used to pull the rest through.
8. Prepare the Effluent Flask
Insert a male luer lock into a segment of 1/16" ID silicone tubing, and then firmly insert 0.022" ID polytetrafluoroethylene (PTFE) tubing. Separately, attach a female luer lock to a 1/16" ID tube. Then, thread one end along the PTFE tube to connect the locks and the other to a short aluminum port (tube 5 in Figure 6).
Connect the exposed 1/50" ID silicone tube to the 1/50" ID peristaltic tube and connectors. To this, connect three segments of 1/50" ID tubing and two segments of 0.022" ID PTFE tubing, alternating them. Connect this to the effluent flask via 1/16" ID tubing (tube 5 in Figure 6).
Connect one end of a 1/16" ID silicone tube to the second longest tube of the aluminum port and the other end to the effluent flask. This aluminum tube sets the culture volume, and excess culture overflows into the effluent container (tube 8 in Figure 6).
Autoclave the culturing assembly at 121 °C and 15 psi (general sterilization) for 30 min. Note: The tubes through which the media flask is filled, through which the media flask is vacuumed, and through which the culturing vessel is inoculated have multiple segments of tubing so that if the distal segment is contaminated, it can be removed to reveal a sterile segment.
9. Prepare the Microfluidic Channel
Mix polydimethylsiloxane (PDMS) and curing agent in a 9:1 ratio. Degas and pour onto the silicon master mold.
Cure the PDMS for 2 h at 65 °C and then cut it from the mask with a razor blade. Cut around the PDMS until it releases from the mold. Avoid pushing down and breaking the fragile wafer.
Use a 1.2 mm ID biopsy hole puncher to punch holes at both ends of the channel.
Plasma bond the PDMS to the cover glass24.
Tape the long ends of the cover glass to the supporting aluminum frame such that the PDMS channel is centered on the aluminum frame, and then bake the PDMS again for 2 h at 65 °C.
10. Fill the Media Flask
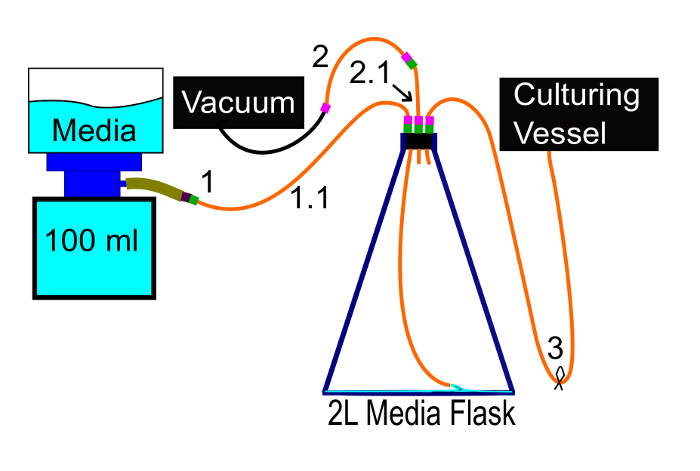 Figure 7: Adding media. This diagram shows how media should be vacuum filtered into the media flask. It ensures that the media remains sterile. Please click here to view a larger version of this figure.
Make appropriate media. If the continuous culturing system will be operated as a chemostat, use media limited for a specific nutrient. NOTE: Examples of standard media composition for studies with S. cerevisiae have been previously published25,26,27,28,29.
Attach the vacuum filter to a 100 ml bottle, remove the nipple cover, then remove the white plug from the nipple of the vacuum filter with sterile tweezers.
Connect the 3/16" ID silicone tube to the nipple, the media flask's other free tube to a vacuum pump (tubes 1 and 2 in Figure 7, respectively), and ensure that the tube connecting the media flask to the culturing vessel is clamped shut (tube 3 in Figure 7).
Fill the filter with media, turn on the vacuum pump, and then filter the rest of the media. Clamp the 1/16" ID silicone tubing connected to the vacuum (tube 2 in Figure 7) and turn off the vacuum pump.
Remove the leurs from the intermediate segment of 1/16" ID tubing connected to the vacuum pump so that an uncontaminated end of the tube is accessible. Insert the blue end of a sterile syringe air filter into this tube.
Clamp the 3/16" ID silicone tubing (tube 1 in Figure 7) and disconnect the male luer from it. Disconnect the plug from the female luer of the culturing vessel's media inlet tube. Connect these male and female luers to enable media to be pumped into the culturing vessel.
Remove the vacuum filter and cap the 100 mL bottle of media which was attached to the vacuum filter.
A day before the culturing vessel will be inoculated, inoculate a single colony of the optogenetic microbe in a test tube with 4 mL of the media collected in the previous step, and let it grow overnight at 30 °C or the culture's optimal temperature growth temperature with agitation.
11. Assemble the Apparatus Around the Microscope
Set the continuous culturing assembly near the microscope with the media flask higher than the culturing vessel and the effluent flask lower than the culturing vessel, such that the tube composed of segments of 0.022" ID PTFE tubing (tube 5 in Figure 6) can reach the microscope stage. Securely tape down the rubber stoppers on the media flask and effluent container.
Unplug the ends of the 0.022" ID PTFE tubing from the 1/50" ID silicone tube connecting them (tube 5 in Figure 6), and plug these ends into the inlet and outlet of the microfluidic device.
Connect the white end of the syringe air filter to the aquarium pump. The air pressure will push media into the culturing vessel.
When the media reaches the level of the effluent port, wrap the 1/16" ID media inlet tubing and connectors around the slow peristaltic pump (tube 4 in Figure 6) and the 1/50" ID sample outlet tubing and connectors around the fast peristaltic pump (tube 5 in Figure 6).
Aerate the media by unclamping the air tube between the media flask and culturing vessel.
Tape the heating pad and thermometer to the culturing vessel so that its temperature can be controlled. Coil the media tubing around the culturing vessel so the entering media will be at the same temperature as the vessel. NOTE: The PWM current to the heating pad is regulated by the microcontroller which uses inputs from the thermometer to keep the culturing vessel at its setpoint temperature.
Insert the culturing vessel into the black foam enclosure over the LED matrix, and ensure that the tubes are not pinched.
In Micro-Manager, go to Plugins> Bioreactor Controller. Set the "Media pump ratio on" field to 0.1 and the "Sample pump ratio on" field to 0. The flow rate will be very low, but greater than the rate of evaporation.
Clamp the incoming air tube between the media flask and culturing vessel. Remove the plug from the inoculation tube (tube 7 in Figure 6), and inoculate the culturing vessel with 1 mL of starter culture via a serological pipette. Clamp and plug the distal end of this tube to ensure that contaminants do not enter the culturing vessel, then unclamp the incoming air tube.
Cover the enclosure so that no light enters, and let the culture grow overnight.
12. Calibrate the Pumping Rates
In Micro-Manager, go to Plugins> Bioreactor Controller. Set the "Media pump ratio on" field to 0.5 and the "Sample pump ratio on" field to 0.
Disconnect the overflow tube from the effluent flask (tube 8 in Figure 6) and the sampling tube from the effluent flask (tube 8 in Figure 6) and collect effluent in separate vessels. Collect effluent for 1 hr, beginning after the pumps have been on for 15 min.
Calculate the flow rate of media into the culturing vessel from the volume collected in the vessel as:

Adjust the value of the "Media pump ratio on" field by this linear estimate:
 where
where 
Iterate through this calibration procedure until the difference between the desired flow rate and the measured flow rate is < 0.2 mL/h, where the flow rate is averaged over a 1 h period.
Increase the value of the "sample ratio on" field and calibrate it in a similar manner until roughly 4/5th of the volume leaving the culturing vessel is pumped out by the sampling pump and roughly 1/5th of the volume is leaving through the overflow port.
Let the culture density in the continuous culturing apparatus equilibrate under these conditions overnight. NOTE: If the target flow rates cannot be reached, change the peristaltic pump tubing. Liquid is pumped at a higher rate when larger diameter tubing is used. Follow step 14 and then return to step 8.4.
13. Collect Microscope Images of Cultured Microbes
Fill the Stage Position List in Micro-Manager with a set of non-overlapping positions at which images of cells pumped into the microfluidic channel will be in the focal plane.
Open the "Bioreactor Controller" plugin. Select the desired LED matrix time course, imaging channels, and other experimental settings from the prompts. Collect and analyze images.
While the experiment runs, ensure that the media in the media flask remains clear. If it is cloudy, then it has been contaminated.
14. Post-experiment
Dispose of media, excess cell culture and effluent.
Refill the media flask with 200 mL of 20% EtOH mixed with deionized water. Run the chemostat as it had previously been run during the experiment to wash out cell debris and media.
When the alcohol solution has drained from the media flask, disassemble the chemostat fully.
Wash glassware and tubes with warm water and mild detergent, and rinse thoroughly with deionized water. Leave to dry.
Open the "microcontrollerRecords.csv" file to review the temperature and LED matrix status over the course of the experiment, the "Summary.csv" file to review the summary data from each set of images and the "Results<n>.csv" files to review data summarizing each ROI from each time period, where n is the nth data set.
Representative Results
This apparatus was used to stimulate a culture of S. cerevisiae expressing yellow fluorescent protein (YFP) in response to blue-light via an inducible optogenetic transcription system based on the CRY2/CIB1 protein pair30. Cells were grown chemostatically in phosphate-limited media with an average dilution rate of 0.2 ± 0.008. Phosphate limitation is commonly used in S. cerevisiae chemostat experiments to control growth rate and the effects of phosphate limitation are well characterized.31,32,33 Effluent from the continuously-diluted culturing vessel was sampled to a microfluidic device on an inverted microscope. The images were automatically analyzed as shown in Figure 8. Individual cells were identified in background-subtracted phase-contrast images and their YFP concentration was estimated from their fluorescence as measured from the background-subtracted fluorescent images.
The fluorescence of 169,677 cells was analyzed from 33,600 images of effluent acquired from 28 locations in the microfluidic device over the 70 h of the experiment. We used an inverted microscope equipped with a fluorescence illumination system and a CMOS camera. The YFP images were acquired with a 500/20 nm excitation filter, a 535/30 nm emission filter, and a T515lp dichroic. Images were taken with a 40X phase contrast objective, under Köhler illumination. Images were recorded in 16-bit color depth with 87 pixels per micrometer squared. The culture was exposed to varying intensities of blue light for 6 h intervals, followed by complete darkness for 6 h intervals. The culture had been exposed to light prior to the first measurement, which is why its fluorescence intensity is decreasing during the first dark period.
Figure 9 shows the fluorescence due to YFP production upon activation of the optogenetic system in response to illuminating the culturing vessel. It demonstrates the utility of single cell measurements of fluorescence over a population average-single-cell measurements reveal the population distribution of fluorescence intensity. Note the outlier at 42 h 26 min. After reviewing the corresponding images, it was apparent that there were clumps of cells in the majority of the images used to generate the composite image of the background, resulting in artifacts that resembled cells in the background-subtracted image. Also, a bubble from the culturing vessel was pumped to the microfluidic channel and parts of its edges were mistaken as cells by the image analysis algorithm. Since neither the bubble nor the artifacts from subtracting the background corresponded to actual cells, their measured fluorescence intensity is lower than the auto-fluorescence of the cells. This figure demonstrates the quality of data that can be automatically acquired over 3 d. Please click here to view a larger version of this figure.
 Figure 8: Visual depiction of the image analysis algorithm. These images have been cropped and expanded for ease of viewing. (A) Six images are acquired to generate the background-subtracted phase contrast image of the cell culture. After the main image is acquired, five additional images are acquired with the effluent-sampling pump briefly turned on between each acquisition to ensure that cells are displaced. A composite image of the background is generated from the five component images. The value of each pixel in the background image is the median value of that same pixel across the 5 component images. (B) The background-subtracted image is then converted to a binary. The binary is then dilated and the holes within continuous sections of the binary are filled. The yellow outlines correspond to selected regions of interest (ROI), based on size and circularity criteria. (C) Those ROI are mapped onto the fluorescent image, where the fluorescence of each cell is measured as the value of the brightest pixel within the ROI. Please click here to view a larger version of this figure.
 Figure 9:Population distribution of fluorescence intensities over time. In these subfigures the logarithm of measured fluorescence is displayed, following standard practice in flow cytometry. The line in A and B indicates the intensity of light absorbed or diffracted by the culture, which is measured as the difference in intensity between light transmitted through sterile media and light transmitted through cell culture in the culturing vessel. It is plotted against the second ordinate axis. (A) A box and whisker plot (5th percentile, 25th percentile, median, 75th percentile, 95th percentile) of the logarithm of the measured fluorescence of the population over time. (B) A 2-dimensional histogram of the same data, where color corresponds to the normalized frequency of cells with a measured fluorescence in the range of the corresponding bin. The colors were scaled to the range of data without the outlier at 42 h 26 min included. The normalized frequency of the outlier in the lowest fluorescence bin is 0.7. (C) One dimensional histograms of the logarithm of the measured fluorescence of the population before the first recorded exposure to light and after the greatest exposure to light. It demonstrates that the light-induced expression of YFP in this strain is bimodal. Please click here to view a larger version of this figure.
Discussion
We designed this apparatus with flexibility in mind. All the code used is free and open-source. The default image analysis process to segment cells is simple and runs quickly. Custom analysis could be implemented by recording user input while analyzing a representative image with the FIJI graphic user interface, converting the input to a beanshell script, and then setting the plugin to call the script. When it is called, this script will be sent a String array called "images" containing the file paths to the most recent set of background-subtracted images. Images and data are saved as they are collected so that they are not lost if an experiment ends abruptly. A blue LED array was chosen for inducing our optogenetic system but it could be replaced with LEDs of different colors. There are additional input and output pins available on the microcontroller as well as through-holes for an additional MOSFET switch and relay switch on the PCB that make it easy for this system to be adapted for more complex purposes. For example, to make this apparatus operate as a turbidostat, use the additional pins on the microcontroller to power an LED and read values from a light-sensor strapped to the culturing vessel, and then modify the software to measure turbidity and dilute the vessel accordingly.
Care must be taken to ensure that the culture is not contaminated, to protect sensitive microscopy equipment, and to ensure that the fluid flow rates are consistent. Contaminations prior to when the culturing vessel is intentionally inoculated can be detected by waiting a few days before inoculating the vessel and verifying that there is no growth inside. To avoid spilling cell culture on the microscope objective, check that the microfluidic device will not leak by first pumping cell culture through it over an absorbent cloth. If the flow of media into the culturing vessel is inconsistent, it is usually because the tube around the rollers of the peristaltic pump has become too loose. If the flow of air from the aquarium pump is inconsistent, ensure that there are no U-shaped bends in the effluent tube where liquid may pool and inconsistently resist air flow. If tubing becomes clogged after an experiment because media has dried up inside of it, soak the clogged tubes in a hot water bath to dissolve the clog.
There are intrinsic limitations to this protocol to consider when planning an experiment or analyzing results. Depending on the dilution rate and length of tube used, there is a delay of roughly 10 min during which the cell culture is pumped from the culturing vessel to the microscope. Therefore, it is not well suited to studying events occurring over shorter timescales. Also, while an experiment can run continuously for about ten days, limited only by the volume of media, the evolution of the cell culture must be considered as the duration of the experiment increases. The limiting nutrient of the media has profound effects on metabolism and gene expression35,36,37,38,39 and should therefore be determined based on the aspect of physiology under study. When analyzing results, the images-especially the images from outlying data points-should be reviewed for errors in the way that ROIs were identified by the image analysis routine. It is possible for bubbles or artifacts to be mistaken for cells, thereby skewing the measured fluorescence. One simple way to eliminate such erroneous measurements is to discard all ROIs with fluorescence intensities below the auto-fluorescence intensity.
This protocol will be useful for measuring fluorescence intensity and/or cellular morphology of effluent cell culture in response to light in organisms that can grow in continuous culture, settle to a consistent focal plane when not stirred, and be automatically identified by an image analysis algorithm. The default cell identification algorithm used here will be most directly applicable to roughly spherical microbes that resemble budding yeast. One alternative40 to this protocol is to grow microbes in a set of batch cultures, and then sample one batch for each time point and characterize the sample by flow cytometry. However, the advantages of the protocol described here are that samples are taken from the same culture, many samples can be taken, and the process is automated. This protocol also improves upon a similar method in which optogenetic yeast were continuously cultured and imaged under a microscope34 by acquiring multiple images quickly and not biasing ROIs identification by fluorescence. A great advantage of this protocol is that many measurements of individual cells can be regularly acquired over several days without user input. After measuring the response of the microbial culture to light exposure, a next step may be to implement in silico closed-loop control of the response.
Disclosures
The authors have nothing to disclose.
Acknowledgments
We would like to acknowledge Molly Lazar and Verónica Delgado for assistance in testing the protocol, Kieran Sweeney for helpful discussions and editing, and Taylor Scott, My An-adirekkun, and Stephanie Geller for critical reading of the manuscript. Megan Nicole McClean, Ph.D. holds a Career Award at the Scientific Interface from the Burroughs Wellcome Fund.
References
- Motta-Mena LB, Reade A, et al. An optogenetic gene expression system with rapid activation and deactivation kinetics. Nature chemical biology. 2014;10(3):196–202. doi: 10.1038/nchembio.1430. [DOI] [PMC free article] [PubMed] [Google Scholar]
- Hughes RM, Bolger S, Tapadia H, Tucker CL. Light-mediated control of DNA transcription in yeast. Methods. 2012;58(4):385–391. doi: 10.1016/j.ymeth.2012.08.004. [DOI] [PMC free article] [PubMed] [Google Scholar]
- Shimizu-Sato S, Huq E, Tepperman JM, Quail PH. A light-switchable gene promoter system. Nature biotechnology. 2002;20(10):1041–1044. doi: 10.1038/nbt734. [DOI] [PubMed] [Google Scholar]
- Polstein LR, Gersbach C. a Light-inducible spatiotemporal control of gene activation by customizable zinc finger transcription factors. J Am Chem Soc. 2012;134(40):16480–16483. doi: 10.1021/ja3065667. [DOI] [PMC free article] [PubMed] [Google Scholar]
- Polstein LR, Gersbach C. a A light-inducible CRISPR-Cas9 system for control of endogenous gene activation. Nature Chemical Biology. 2015;11(3):198–200. doi: 10.1038/nchembio.1753. [DOI] [PMC free article] [PubMed] [Google Scholar]
- Yang X, Jost APT, Weiner OD, Tang C. A light-inducible organelle-targeting system for dynamically activating and inactivating signaling in budding yeast. Molecular biology of the cell. 2013;24(15):2419–2430. doi: 10.1091/mbc.E13-03-0126. [DOI] [PMC free article] [PubMed] [Google Scholar]
- Lee S, Park H, et al. Reversible protein inactivation by optogenetic trapping in cells. Nature methods. 2014;11(6):633–636. doi: 10.1038/nmeth.2940. [DOI] [PubMed] [Google Scholar]
- Kennedy MJ, Hughes RM, Peteya LA, Schwartz JW, Ehlers MD, Tucker CL. Rapid blue-light-mediated induction of protein interactions in living cells. Nature Methods. 2010;7(12):973–975. doi: 10.1038/nmeth.1524. [DOI] [PMC free article] [PubMed] [Google Scholar]
- Yazawa M, Sadaghiani AM, Hsueh B, Dolmetsch RE. Induction of protein-protein interactions in live cells using light. Nat Biotechnol. 2009;27(10):941–945. doi: 10.1038/nbt.1569. [DOI] [PubMed] [Google Scholar]
- Zoltowski BD, Motta-Mena LB, Gardner KH. Blue light-induced dimerization of a bacterial LOV-HTH DNA-binding protein. Biochemistry. 2013;52(38):6653–6661. doi: 10.1021/bi401040m. [DOI] [PMC free article] [PubMed] [Google Scholar]
- Renicke C, Schuster D, Usherenko S, Essen LO, Taxis C. A LOV2 Domain-Based Optogenetic Tool to Control Protein Degradation and Cellular Function. Chemistry & Biology. 2013;20(4):619–626. doi: 10.1016/j.chembiol.2013.03.005. [DOI] [PubMed] [Google Scholar]
- Novick A, Szilard L. Description of the chemostat. Science (New York, N.Y.) 1950;112(2920):715–716. doi: 10.1126/science.112.2920.715. [DOI] [PubMed] [Google Scholar]
- Monod J. La technique de culture continue. Théorie et applications. Ann. Inst. Pasteur. 1950;79(4):390–410. [Google Scholar]
- Shimizu-Sato S, Huq E, Tepperman JM, Quail PH. A light-switchable gene promoter system. Nature Biotechnology. 2002;20:1041–1044. doi: 10.1038/nbt734. [DOI] [PubMed] [Google Scholar]
- Kennedy MJ, Hughes RM, Peteya LA, Schwartz JW, Ehlers MD, Tucker CL. Rapid blue-light-mediated induction of protein interactions in living cells. Nature Methods. 2010;7:973–975. doi: 10.1038/nmeth.1524. [DOI] [PMC free article] [PubMed] [Google Scholar]
- Olson EJ, Tabor JJ. Optogenetic characterization methods overcome key challenges in synthetic and systems biology. Nature chemical biology. 2014;10(7):502–511. doi: 10.1038/nchembio.1559. [DOI] [PubMed] [Google Scholar]
- Botstein D, Fink GR. Yeast: An experimental organism for 21st century biology. Genetics. 2011;189(3):695–704. doi: 10.1534/genetics.111.130765. [DOI] [PMC free article] [PubMed] [Google Scholar]
- Galanie S, Smolke CD. Optimization of yeast-based production of medicinal protoberberine alkaloids. Microbial cell factories. 2015;14(1):144. doi: 10.1186/s12934-015-0332-3. [DOI] [PMC free article] [PubMed] [Google Scholar]
- Gerngross TU. Advances in the production of human therapeutic proteins in yeasts and filamentous fungi. Nature biotechnology. 2004;22(11):1409–1414. doi: 10.1038/nbt1028. [DOI] [PubMed] [Google Scholar]
- van Maris AJA, Abbott DA, et al. Alcoholic fermentation of carbon sources in biomass hydrolysates by Saccharomyces cerevisiae: current status. Antonie van Leeuwenhoek. 2006;90(4):391–418. doi: 10.1007/s10482-006-9085-7. [DOI] [PubMed] [Google Scholar]
- Edelstein A, Amodaj N, Hoover K, Vale R, Stuurman N. Computer control of microscopes using µManager. Curr Protoc Mol Biol. 2010. Chapter 14. [DOI] [PMC free article] [PubMed]
- Edelstein AD, Tsuchida MA, Amodaj N, Pinkard H, Vale RD, Stuurman N. Advanced methods of microscope control using µManager software. Journal of biological methods. 2014;1(2) doi: 10.14440/jbm.2014.36. [DOI] [PMC free article] [PubMed] [Google Scholar]
- Schindelin J, Arganda-Carreras I, et al. Fiji: an open-source platform for biological-image analysis. Nature methods. 2012;9(7):676–682. doi: 10.1038/nmeth.2019. [DOI] [PMC free article] [PubMed] [Google Scholar]
- Bhattacharya S, Datta A, Berg JM, Gangopadhyay S. Studies on surface wettability of poly(dimethyl) siloxane (PDMS) and glass under oxygen-plasma treatment and correlation with bond strength. Journal of Microelectromechanical Systems. 2005;14(3):590–597. [Google Scholar]
- Saldanha AJ, Brauer MJ, Botstein D. Nutritional homeostasis in batch and steady-state culture of yeast. Molecular Biology of the Cell. 2004;15:4089–4104. doi: 10.1091/mbc.E04-04-0306. [DOI] [PMC free article] [PubMed] [Google Scholar]
- Boer VM, Tai SL, et al. Transcriptional responses of Saccharomyces cerevisaie to preferred and nonpreferred nitrogen sources in glucose-limited chemostat cultures. FEMS Yeast Research. 2007;7:604–620. doi: 10.1111/j.1567-1364.2007.00220.x. [DOI] [PubMed] [Google Scholar]
- Boer VM, Amini S, Botstein D. Influence of genotype and nutrition on survival and metabolism of starving yeast. Proceedings of the National Academy of Sciences. 2008;105:6930–6935. doi: 10.1073/pnas.0802601105. [DOI] [PMC free article] [PubMed] [Google Scholar]
- Brauer MJ, Huttenhower C, et al. Coordination of growth rate, cell cycle, stress response and metabolic activity in yeast. Molecular Biology of the Cell. 2008;19:352–367. doi: 10.1091/mbc.E07-08-0779. [DOI] [PMC free article] [PubMed] [Google Scholar]
- Gresham D, Dunham MJ. The enduring utility of continuous culturing in experimental evolution. Genomics. 2014;104(6):399–405. doi: 10.1016/j.ygeno.2014.09.015. [DOI] [PMC free article] [PubMed] [Google Scholar]
- Liu H, Yu X, et al. Photoexcited CRY2 interacts with CIB1 to regulate transcription and floral initiation in Arabidopsis. Science (New York, N.Y.) 2008;322(5907):1535–1539. doi: 10.1126/science.1163927. [DOI] [PubMed] [Google Scholar]
- McIsaac RS, Oakes BL, Wang X, Dummit KA, Botstein D, Noyes MB. Synthetic gene expression perturbation systems with rapid, tunable, single-gene specificity in yeast. Nucleic Acids Research. 2013;41(4):1–10. doi: 10.1093/nar/gks1313. [DOI] [PMC free article] [PubMed] [Google Scholar]
- McIsaac RS, Petti AA, Bussemaker HJ, Botstein D. Perturbation-based analysis and modeling of combinatorial regulation in the yeast sulfur assimilation pathway. Molecular biology of the cell. 2012;23(15):2993–3007. doi: 10.1091/mbc.E12-03-0232. [DOI] [PMC free article] [PubMed] [Google Scholar]
- McIsaac RS, Silverman SJ, et al. Fast-acting and nearly gratuitous induction of gene expression and protein depletion in Saccharomyces cerevisiae. Molecular biology of the cell. 2011;22(22):4447–4459. doi: 10.1091/mbc.E11-05-0466. [DOI] [PMC free article] [PubMed] [Google Scholar]
- Melendez J, Patel M, Oakes BL, Xu P, Morton P, McClean MN. Real-time optogenetic control of intracellular protein concentration in microbial cell cultures. Integrative biology quantitative biosciences from nano to macro. 2014;6(3):366–372. doi: 10.1039/c3ib40102b. [DOI] [PubMed] [Google Scholar]
- Brauer MJ, Huttenhower C, et al. Coordination of growth rate, cell cycle, stress response, and metabolic activity in yeast. Molecular biology of the cell. 2008;19(1):352–367. doi: 10.1091/mbc.E07-08-0779. [DOI] [PMC free article] [PubMed] [Google Scholar]
- Boer VM, Crutchfield CA, Bradley PH, Botstein D, Rabinowitz JD. Growth-limiting intracellular metabolites in yeast growing under diverse nutrient limitations. Molecular biology of the cell. 2010;21(1):198–211. doi: 10.1091/mbc.E09-07-0597. [DOI] [PMC free article] [PubMed] [Google Scholar]
- Markham BE, Byrne WJ, Methods E. Uptake, storage and utilization of phosphate by yeast. Journal of the Institute of Brewing. 1967;73:271–273. [Google Scholar]
- Kazemi Seresht A, Palmqvist EA, Olsson L. The impact of phosphate scarcity on pharmaceutical protein production in S. cerevisiae: linking transcriptomic insights to phenotypic responses. Microbial cell factories. 2011;10(1):104. doi: 10.1186/1475-2859-10-104. [DOI] [PMC free article] [PubMed] [Google Scholar]
- Shimizu K. Regulation Systems of Bacteria such as Escherichia coli in Response to Nutrient Limitation and Environmental Stresses. Metabolites. 2013;4(1):1–35. doi: 10.3390/metabo4010001. [DOI] [PMC free article] [PubMed] [Google Scholar]
- Olson EJ, Hartsough LA, Landry BP, Shroff R, Tabor JJ. Characterizing bacterial gene circuit dynamics with optically programmed gene expression signals. Nature methods. 2014;11(4):449–455. doi: 10.1038/nmeth.2884. [DOI] [PubMed] [Google Scholar]