Abstract
The Heterogeneous Dielectric Generalized Born (HDGB) implicit membrane formalism is extended by the addition of a van der Waals dispersion term to better describe the nonpolar components of the free energy of solvation. The new model, termed HDGBvdW, improves the energy estimates in the hydrophobic interior of the membrane, where polar and charged species are rarely found and non-polar interactions become significant. The implicit van der Waals term for the membrane environment extends the model from Gallicchio et al. (J. Comp. Chem. (2004) 25, 479-499) by combining separate contributions from each of the membrane components. The HDGBvdW model is validated with a series of test cases ranging from membrane insertion and pair association profiles of amino acid side chain analogs and transmembrane helices. Overall, the HDGBvdW model leads to increased agreement with explicit membrane simulation results and experimental data.
Keywords: Implicit membrane model, generalized Born formalism, transmembrane helix dimers
Graphical abstract
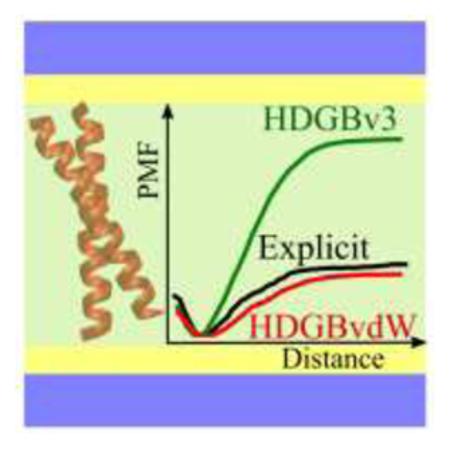
The implicit membrane model of Heterogeneous Dielectric Generalized Born with a van der Waals term (HDGBvdW) is introduced with an additional dispersion term. The new modification of the model provides a more accurate description of the total nonpolar free energy, which consists of repulsive and attractive components. This novel description of the implicit model improved the agreement of the free energy of association of transmembrane helix dimers in significant amount.
INTRODUCTION
During the last decades, with the increase in computer power and development of efficient computational methods, computer simulations have become an important tool for investigating the dynamics, structure and energetics of biological systems.1,2 Although increasingly larger systems and longer time scales have become accessible, there is still a significant challenge to simulate systems where conformational sampling is hindered by slow kinetics. Lipid membranes are one example where very slow relaxation of the lipids makes it difficult for simulations to converge.3,4 Consequently, explicit atomistic representations of membranes that provide the most reliable and accurate description of such systems, often incur very high computational costs for obtaining meaningful insights. In addition, the high degree of complexity of membrane systems complicates the initial setup and equilibration when studying the interaction of biological macromolecules with membranes.5-8
Mean field treatments of solvent environments can circumvent such issues.9-18 In such implicit solvent models solvent relaxation is effectively instantaneous. Often, the Poisson-Boltzmann (PB) theory is invoked as a starting point where the solvent environment is described as a dielectric continuum.9,16-18 The numerical solution of the PB equation then yields the electrostatic free energy of solvation for a given solute molecule.19-21 Although solvation free energies based on the PB equation are often in good agreement with experiments,20-23 a direct application during molecular dynamics simulations remains as a challenge due to relatively high computational costs and difficulties with obtaining smooth derivatives when solving the PB equation.24-27 As an alternative, the generalized Born (GB) formalism has been developed,28 providing an approximation of the electrostatic free energy of solvation via a pairwise additive analytical term. With proper parameterization, the GB formalism can closely reproduce solvation free energies obtained from PB theory with only little loss of accuracy.13,24,29 The GB method has enabled many successful applications in a variety of systems.30-34
Implicit models of membranes require a heterogeneous description of the environment. Both, PB35-37 and GB methods38-42 have been extended to membrane systems by applying different dielectric constants to membrane and water environments. Simple models assume a two-layer dielectric system where the interior of the membrane has a low dielectric constant and the lipid head group region and water have the same dielectric constant of water.38-41 Even simpler models treat the membrane as an extension of the solute cavity (for which usually ε=1 is assumed in the context of simulations). A more detailed approach developed by us in the Heterogeneous Dielectric Generalized Born (HDGB) model42 allows for a dielectric profile along the membrane normal that can be tuned to match experimental data and membrane insertion energetics obtained from explicit lipid bilayer simulations. The HDGB model has been applied successfully to study the energetics and dynamics of various membrane-interacting systems with good agreement with Poisson-Boltzmann calculations42, explicit membrane simulations42-44 and experimental data.44-47
Commonly, the electrostatic GB term is complemented with a non-polar term based on the solvent accessible surface area (SASA).28,48,49 In the HDGB model, the SASA-term is scaled as a function of membrane insertion to reflect a much reduced cost of cavity formation in the membrane interior.28,48,49 Some studies on free energy of association for small molecules50 and peptides51 revealed that a simple SASA term may be problematic for fully capturing the total non-polar solvation free energy. A more accurate treatment of the non-polar solvation free energy that accounts for both repulsive and attractive terms combines the SASA-based cost of cavity formation with an implicit van der Waals term. Previously, an implicit model of the dispersion term in aqueous solvent has been introduced by Gallicchio et al.52,53. In this model, the van der Waals contribution to the free energy is estimated as its enthalpic component obtained via integration of the attractive part of the Lennard-Jones potential. 52,53 The addition of the van der Waals term was found to increase the accuracy of the hydration free energy predictions of small molecules.53
In the hydrophobic membrane interior, the lack of polar and charged molecular species and a much reduced cost of cavity formation renders van der Waals contributions to the solvation free energies an important factor that has so far been neglected in implicit membrane models. An accurate treatment of non-polar contributions to the solvation free energy is assumed to be especially important for correctly capturing the energetics of lateral interactions of membrane-embedded molecules such as transmembrane helix associations. Here, we are describing the extension of the HDGB model with an implicit van der Waals term that extends the formalism developed by Gallichio et al.52 to the membrane environment. The resulting HDGBvdW model was parameterized based on membrane insertion profiles and lateral association profiles of amino acid analogs derived from explicit membrane simulations. The model was then tested by comparing transmembrane helix association structures and energetics for selected systems with explicit lipid simulations and experimental data. We generally find that the HDGBvdW model significantly improves the energetics of interactions within the membrane. In the following the HDGBvdW model, the optimization protocol, and simulation details are described in detail before the model parameterization and validation test results are presented and discussed.
HDGBvdW MODEL
The Heterogeneous Dielectric Generalized Born (HDGB) model describes membrane environments implicitly by decomposing the solvation free energy as the sum of polar and non-polar components:
| (1) |
Electrostatic Solvation Free Energy
The polar term, ΔGelec describes the electrostatic solvation free energy using the GB formalism that was modified for the membrane environment38,42:
| (2) |
where εij is the local dielectric constant, qi is the atomic charge of the atom i, rij is the distance between atoms i and j, αi is the Born radius for the atom i, and F is a dimensionless parameter taken as 4. With charges in electron charge units and distances in Å, the resulting energy is calculated in units of kcal/mol. To calculate εij, a dielectric profile is used that switches between the high dielectric water environment and membrane head group region to the low dielectric membrane interior. The dielectric profile was initially motivated by the solvation free energies experienced by a spherical probe traversing a dielectric layer model of the membrane environment42 and subsequently optimized to reproduce membrane insertion free energy profiles of amino acid analogs.44
Since the HDGB model was introduced, the dielectric profile was optimized twice. The HDGB model using the most recently updated dielectric profile43 will be termed HDGBv3 in the remainder of this paper. The dielectric profile from HDGBv3 was used unchanged in this study.
Non-polar Solvation Free Energy
In the HDGB model, the non-polar term consists of a cavity term that is calculated based on the solvent accessible surface area model according to:
| (3) |
where SASAi is the solvent accessible surface area for the solute atom i, S(z) is the non-polar profile ranging from zero in the membrane center to one in the water phase scaled overall by the surface tension parameter γ.
The HDGBvdW model introduced here, splits the non-polar term into separate contributions from the cost of cavity formation and van der Waals dispersion forces:
| (4) |
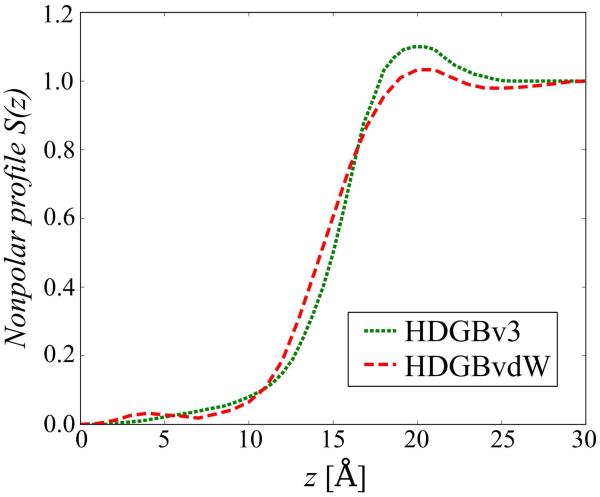
Because a dispersion term is added here to the cavity term, a modified non-polar profile and a different value for γ are used here compared to the HDGBv3 model.
The dispersion term is obtained following the formalism proposed by Gallicchio et al.52 by decomposing the Lennard-Jones potential into the attractive and repulsive terms using the Weeks-Chandler-Andersen (WCA) scheme.54 In this scheme the repulsive term is described by Eq. 3, while the attractive term is calculated by integrating the attractive part of the Lennard Jones potential as in Eq. 5 under the assumption that the resulting enthalpic term approximates the free energy:55-58
| (5) |
where N is the total number of the solute atoms, Ci is an atomic constant, ri is the position of the atom i and ρw is number density of water. In later work by Gallicchio et al.,52 the volume integral in Eq. 5 was further approximated using Born radii as follows:
| (6) |
where the index i is used for the solute atoms, ai is a dimensionless fitting parameter, αi is the Born radius of solute atoms, and Rw is the radius of the water probe and Ai is defined as:
| (7) |
where ρw is the number density of water molecules, σiw and εiw are Lennard-Jones parameters between water oxygens and solute atoms that are calculated from the force field as:
| (8) |
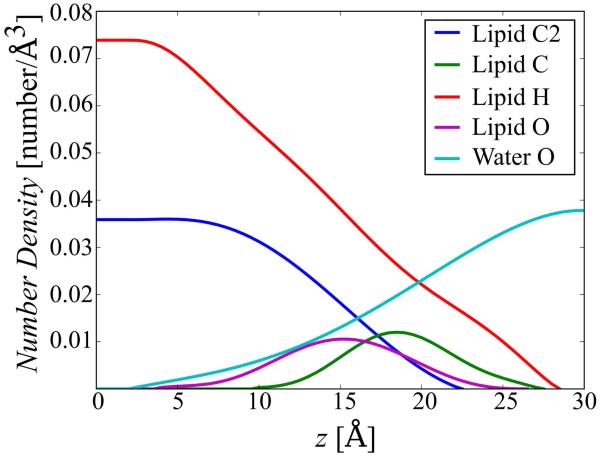
The formalism developed by Gallicchio et al. applies to a homogeneous solvent environment. Here, we are introducing an extension for a heterogeneous environment where the dispersion term varies along the membrane normal z and the contributions from different atom types in the membrane forming lipid environment are taken into account. We consider four different atom types for lipid atoms (hydrogen atoms, oxygen atoms, acyl chain carbons, and carbons in the glycerol backbone and the head group, see Fig. 1) and one additional type for water oxygens. Eq. 6 is then modified to involve an additional summation over solvent types:
| (9) |
where the index i refers to solute atoms, N is the total number of solute atoms, j refers to solvent atom types, and M is the total number of the solvent atom types (five in our model).
Figure 1.
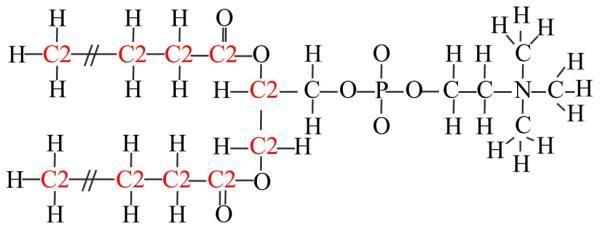
Structure of DPPC molecule with a representation of the different atom types used in the HDGBvdW model: O, H, C, C2. The colors differentiate carbon atom types C for the glycerol backbone and the head group and C2 for the hydrocarbon chains.
The variation as a function of z is introduced in Ai,j via the variation of atom type densities ρj(z) along the membrane normal:
| (10) |
with the Lennard-Jones parameters σij and εij again taken from the force field. The CHARMM c36 lipid force field59 was used for the phospholipids based on a di-palmitoyl phosphatidylcholine (DPPC) model and TIP3P60 parameters were used for the water model. Because CHARMM distinguishes more atom types for lipids than the four types we are considering here, we averaged Lennard-Jones parameters for all atoms of a given type j according to:
| (11) |
where Nj is the number of bilayer atoms of atom type j. The resulting εj and σj values for each lipid atom type are summarized in Table 1.
Table 1.
HDGBvdW model parameters. Lennard-Jones parameters, ε and σ, and offset values, Rj for the DPPC atom types and water oxygen used for the dispersion term in the HDGBvdW model.
| Atom type |
ε
(kcal/mol) |
σ (Å) | Ri (Å) |
|---|---|---|---|
| Lipid H | −0.0307 | 1.2200 | 1.5 |
| Lipid C | −0.0680 | 2.0350 | 2.2 |
| Lipid C2 | −0.0570 | 2.0190 | 2.2 |
| Lipid O | −0.1100 | 1.6750 | 1.5 |
| Water O | −0.1520 | 1.7700 | 1.4 |
We note that there are several assumptions made here: First, the step from Eq. 5 to Eq. 6 assumes that the inverse cubed Born radii can substitute for the integral over 1/r6. To validate this assumption for our model, we compared atomic van der Waals energies in the WALP23 model peptide obtained via grid-based numerical calculation of the integral in Eq. 5 and by using Born radii either from GBMV in water or HDGB in the membrane. We found correlation coefficients of 0.96 and 0.84 with slopes of 1.1 and 0.9 in the water and membrane environments, respectively. This suggests that using the Born radii as suggested by Gallicchio et al. is reasonable for the membrane context as well although a future version of our model may use a direct estimate of the integral over 1/r6 instead of the Born radii. Second, Eqs. 5 and 6 are formulated for a spherical distribution of solvent species, which is clearly not true in the case of membrane bilayers. However, the overall density of atoms is similar in the bilayer and aqueous solvent and we assume that the summation over different atom types according to Eq. 9 using the different density profiles and a spherical model is approximately equivalent to carrying out the integral in Eq. 5 over the actual distribution of different atom types in space. We confirmed that this assumption is largely valid for the WALP23 model peptide. Third, we assume that equating enthalpy with free energy in Eq. 5 is not a worse approximation for the membrane system than in aqueous water. We believe that the empirical fitting parameters ai at least partially compensate for potential under- or over-estimations but to fully test these assumptions, more accurate reference data, such as high-accuracy van der Waals components of membrane insertion free energies would be needed.
Software Implementation
The heterogeneous dielectric generalized Born model with a van der Waals term (HDGBvdW) was implemented in CHARMM version c41a2.61 It is expected to be available in future general release versions of CHARMM.
MODEL PARAMETERIZATION
The implementation of Eqs 9 and 10 requires density profiles ρj(z), exclusion radii Rj for each solvent atom type, and fitting parameters ai for each solute atom type. Furthermore, because the non-polar contribution is split into two terms, the non-polar profile used in the SASA-dependent term as well as the value for the overall surface tension coefficient γ need to be re-optimized from the values used before in HDGBv3. The dielectric profile was not changed from the HDGBv3 model.
Solvent Density Profiles
The solvent density profiles for each atom type, ρj(z), used in Eq. 10 were derived from radial distribution functions extracted from a fully explicit lipid/solvent DPPC membrane simulations. In order to check for possible differences in the density profiles with and without a membrane protein embedded into the bilayer, two different explicit membrane systems were simulated. One system consisted of a pure DPPC bilayer and the other of a DPPC bilayer with the DsbB transmembrane helix inserted into the bilayer. After the simulations of the bilayers, the systems were divided into 1 Å-thick slabs perpendicular to the membrane normal. In each slab, radial distribution functions were averaged for each atom type. For the bilayer-only system, radial distribution functions between each atom type and water molecules are calculated, whereas for the bilayer-peptide system, radial distribution functions are calculated between each atom type and the peptide surface. The resulting radial distribution functions for the bilayer-only and bilayer-peptide systems are shown in Fig. S1. In the presence of the peptide, the radial distribution functions have to renormalized to account for the reduced number of lipids because of the presence of the peptide using the following formula:
| (12) |
In order to generate density profiles for each atom type, the average value of the radial distribution function for radial distances between 2 and 6 Å was calculated for each slab for the bilayer-only and the bilayer-peptide systems. The total average density profile for the bilayer-only system shows that the total number density is almost constant across the membrane bilayer with about 0.11 atoms/Å3 in the bilayer vs. 0.10 atoms/Å3 in the water phase. There is little difference between the profiles derived from the bilayer-only and bilayer-peptide systems for the atom type-specific profiles. In order to use these density profiles in Eq. 10, high-order (5-7) polynomial equations were fitted to obtain smooth, differentiable curves (see Fig. 2). The resulting smoothed curves where then spline-interpolated during simulations with the HDGBvdW model.
Figure 2.
Final density profiles for the four lipid atom types and the water oxygen. Each data point was extracted by averaging the radial distribution function from the Fig. S1 and the final smooth profiles were obtained by fitting the average densities with polynomial functions.
Exclusion Radii
The exclusion radii Rj in Eq. 9 represent an offset to account for the minimum distance between lipid atoms of a given type and the solute atoms. The radius for a water molecule was taken as 1.4 Å, corresponding to its size. For the lipid atom types, the radial distribution functions, shown in Fig. S1 were used to obtain the offset values. The minimum distance, where the radial distribution function is non-zero was taken as the offset value for the lipid atom types. The resulting exclusion radii are reported in Table 1.
Optimization of Solute Atom Fitting Parameters and Cavity Terms Based on Insertion Profiles
The fitting parameters for solute atom types (ai) in Eq. 9, the non-polar profile S(z) and the surface tension γ in Eq. 3 were determined together via an iterative protocol (cf. Fig. S2) to optimize the agreement for amino acid side chain insertion profiles between implicit and explicit solvent using reference data from the Tieleman group62,63. Initially, ai values for each atom type of the amino acids were set to one and subsequently varied using a Monte Carlo protocol to decrease the root mean square deviation (RMSD) between calculated insertion profiles and the target explicit solvent profiles. For each set of ai, the cavity term was initially set to zero and an optimal profile and value of γ was determined by setting γS(z) to the inverted average of the difference between the implicit and explicit profiles. Therefore, only the ai values were true fitting parameters in this protocol.
Final Optimization Based on Intra-Membrane Association Profiles
The model with the parameters optimized as described above gave optimal agreement for the amino acid sidechain analog insertion free energy profiles but was not optimal in reproducing association free energies of selected pairs of amino acid side chain analogs (acetamide, methanol, toluene, propane) from explicit lipid simulations43 compared to the HDBGv3 model. Hence, we tuned the model to better reproduce the amino acid association profiles by considering the hybrid solvation free energy function given in Eq. 13:
| (13) |
with two scaling parameters λSASA and λvdW, that vary between 0 to 1 to interpolate between the HDGBv3 model (λ=0) and the initially parameterized van der Waals model (λ=1). ΔGvdW is the van der Waals term initially optimized based on the insertion profiles and ΔGSASAv3 and ΔGSASAvdw are the free energy contributions from cavity term for HDGBv3 and the initial van der Waals model, respectively. The association free energies for the four side chain analogs at z=0 and 12 Å were then calculated at different λ parameters with 0.1 intervals. The results were compared with the energy profiles from the explicit simulation and differences were quantified in the form of RMSDs (see Fig. S3). The best overall agreement for the association profiles was found for λvdW around 0.5, i.e. half of the contribution from the initial parameterization that was based only on the insertion profiles. Therefore, the previously determined fitting parameters aj in Eq. 9 were multiplied by 0.5. The final values are given in Table 2.
Table 2.
Atom scaling factors. Optimized ai values for each peptide atom type.
| Amino acid atom type | ai |
|---|---|
| CT3 carbon | 0.25 |
| CT2 carbon | 0.45 |
| CT1 carbon | 0.55 |
| Aromatic carbon on the phenyl ring | 0.2 |
| Aromatic carbon in His | 0.4 |
| Other aromatic carbons | 0.2 |
| Carbonyl carbons | 0.4 |
| Carbon of methyl group (Ala analog) | 0.7 |
| Hydroxyl oxygen of Tyr | 0.73 |
| Other hydroxyl oxygens | 0.75 |
| Nitrogen in Trp | 0.15 |
| Other nitrogens | 0.23 |
| Hydroxyl hydrogens | 0.75 |
| Aromatic hydrogens | 0.15 |
| Hydrogen in the H-S bond | 0.5 |
| Hydrogen of methyl group (Ala analog) | 0.68 |
| Other hydrogens | 0.48 |
| Sulfur in Met | 0.18 |
| Sulfur in Cys | 0.43 |
| Phosphorus | 0.38 |
As a final step, the non-polar profile of the cavity term was optimized once again using the scaled van der Waals parameters by following the protocol described in Fig. S2 by setting the SASA-based cavity term to optimally reproduce the insertion free energy profiles (see above). The final non-polar profile is shown in Fig. 3 in comparison to the profile used in HDGBv3. A surface tension (γ) value of 0.031 kcal/molÅ2 for scaling the non-polar profile was found to be optimal. After this last parameterization step, the final optimized van der Waals parameters (see Tables 1 and 2 and Fig. 2) and the non-polar profile (see Fig. 3) were used as the HDGBvdW model (based on Eqs. 2, 4, and 9-11) in the rest of this work.
Figure 3.
Non-polar profiles used in HDGBv3 (green; dotted) and HDGBvdW (red; dashed) models after complete optimization.
SIMULATION METHODOLOGY
Explicit DPPC Bilayer Simulations for the HDGBvdW Parametrization
Explicit DPPC simulations with and without membrane protein were performed using the CHARMM c36 force fields for proteins64 and lipids59. The starting structures were created using the CHARMM-GUI interface65,66 and subsequent equilibration steps were conducted following the CHARMM-GUI protocol. The bilayer-only system contained a total of 54 DPPC lipids and 2,372 water molecules, whereas the bilayer-peptide system consisted of 54 DPPC lipids in each leaflet and total of 6,185 water molecules. The DsbB peptide (PDB code 2ZUQ)67 was used for the bilayer-peptide system. The simulations were performed under periodic boundary conditions. A Langevin thermostat was applied to keep the temperature at 323.15 K using a 3 ps−1 friction coefficient for the heavy atoms. Bond lengths involving hydrogen atoms were constrained using the SHAKE algorithm.68 After equilibration, a production run over 5 ns simulation time was performed for both, the bilayer-only and the bilayer-peptide systems using CHARMM version c36a1.
Membrane Insertion of Amino Acid Side Chain Analogs
Free energies of membrane insertion for amino acid analogs were calculated to optimize and validate the HDGBvdW model. Initially, each amino acid analog was placed at the center of the membrane (z=0). Then, the analogs were moved along z in 1 Å intervals until z=30 Å, corresponding to bulk water outside the membrane. At each z point, the molecule was rotated around x- and y-axes in 15° increments and free energies were calculated and Boltzmann-averaged. OPLS force field parameters69,70 were used for the amino acid side chain analogs to compare with free energy profiles from previously calculated explicit bilayer simulations62,63 with the OPLS force field.
Pair Association of Amino Acid Side Chain Analogs
Pair association free energies for selected amino acid side chain analog pairs were calculated to further optimize and validate the HDGBvdW model. To obtain association free energies, umbrella sampling71 was performed using the lateral distance between the two analogs as the reaction coordinate. The z position of the center of mass of each analogs was restrained to z=0 and z=12 for two sets of simulations with a force constant of 50 kcal/molÅ2 using the miscellaneous mean-field potential (MMFP) module. The distance was varied between 3 and 15 Å in 0.5 Å increments, using MMFP in CHARMM with a force constant of 5 kcal/molÅ2. For each umbrella, the systems were minimized over 50 steps of steepest descent followed by 500 steps of adopted basis Newton-Raphson minimization. After minimization, equilibration proceeded by stepwise heating to 100, 200 and 323 K (running molecular dynamics for 500 steps at each temperature). Production runs were then performed at 323 K for 1.5 ns in each window. The CHARMM General force field (CGenFF) parameters72 were used for the amino acid side chain analogs. No cutoff was used for electrostatic or Lennard-Jones interactions and general HDGB parameters were set as described previously43. The simulations were performed using CHARMM version c41a1 via the Multiscale Modeling Tools for Structural Biology (MMTSB) Tool Set73. The time step was set to 1.5 fs and SHAKE was applied to bonds involving hydrogens. A Langevin thermostat was applied to maintain a constant temperature. The sampling in individual umbrellas was combined via the PYMBAR software, a Python implementation of the multistate Bennett acceptance ratio (MBAR) method,74 to obtain potential of mean force (PMF) profiles as a function of separation distance. A Jacobian correction was applied to eliminate the entropy contribution coming from the precession of the molecule around the membrane normal.75 The association profiles from the implicit membrane simulations were compared with association profiles obtained previously from explicit DPPC bilayer simulations.43
Transmembrane Helix Association Energetics of pVNVV Peptide
The structure of the pVNVV peptide was taken from the PDB structure 2ZTA76 using residues Leu5 to Gly31, following the work by Lee et al.77 The N- and C- terminals were blocked using acetyl and amine groups, respectively. Simulations of a peptide dimer were performed both with explicit and implicit bilayer representations. The explicit simulations were prepared using CHARMM-GUI65,66 and performed using CHARMM c41a1 version. The system contained two pVNVV peptides, 128 DPPC molecules and 4,713 water molecules with a water layer of 10 Å. Simulations were carried out in the NPT ensemble at 323 K and at 1 bar pressure using Nose-Hoover thermostat and barostats78,79. CHARMM c36 force field parameters were used for lipids59 and peptides64 and the TIP3P model60 was used to represent water molecules. Periodic boundaries were applied and electrostatic interactions were obtained via the particle-mesh Ewald method80. A switching function effective from 8 to 12 Å was used for Lennard-Jones interactions and the direct part of long range interactions. An integration time step of 2 fs was used in conjunction with the SHAKE algorithm applied to bonds involving hydrogen atoms. The equilibration protocol followed the suggested CHARMM-GUI protocol over a total of 3.7 ns simulation time. Subsequent simulation over 100 ns was carried out to obtain a fully equilibrated system. An area per lipid of 65.3 Å2 and a bilayer width of 39.5 Å were obtained, which are in good agreement with the experimental values of 64 Å2 and 38.3 Å,81 respectively and close to previous simulation results with the same force field59,82.
To obtain association profiles, umbrella sampling was performed as a function of the helix-helix distance. A total of 111 windows were run starting from a minimum helix-helix minimum distance of 7 Å increased in a stepwise fashion via 50 ps simulations at 0.125 Å increments to a final value of 20.75 Å. To restrain the distance between the two helices, the CONSHELIX module77,83,84 in CHARMM was utilized with a force constant of 400 kcal/molÅ2. Each window was simulated for 25 ns, of which the last 15 ns were used for analysis.
Simulations of the pVNVV dimer with the HDGBv3 and HDGBvdW models were carried out using the same general protocol as described above for the association of amino acid side chain analog pair association. Umbrella sampling was performed for 56 windows between the distances of 7 and 20.75 Å at 0.25 Å increments. The CONSHELIX module was also applied in the implicit simulations using a 20 kcal/molÅ2 force constant. The Nose-Hoover thermostat78,79 was applied to keep the temperature at 323 K. Again, no cutoff was applied for long range interactions. Simulations were run for 10 ns with a 1 fs time step in each window. The last 6 ns were used for analysis.
The umbrella sampling was post-processed via the PYMBAR software74 in order to obtain potentials of mean force as a function of helix separation.
Replica Exchange Molecular Dynamics Simulations of Peptide Dimers
Additional simulations were carried out to analyze peptide dimer association structures of selected dimer pairs. Replica exchange molecular dynamics (REMD) simulations85,86 were performed on dimers of glycophorin A (GpA), Bnip3, and EphA1 peptides with the HDGBv3 and HDGBvdW models. The first models of the NMR structures with the PDB codes of 1AFO,87 2J5D88 and 2K1L89 were used as the starting structures for GpA, Bnip3 and EphA1, respectively. The N and C terminals were blocked with acetyl and amine groups, respectively. Two-dimensional distance-biased Hamiltonian/temperature REMD simulations were performed, using the MMTSB Tool Set in combination with CHARMM. G79, H173 and G554 were selected for the pairwise distance in GpA, Bnip3 and EphA1, respectively. Peptide pairs were initially separated by 20 Å and then the distance between selected residues was varied between 4 and 15 Å at 1 Å intervals for GpA and EphA1. For Bnip3 helices, distance between H173 residues was varied between 5 to 16 Å at 1Å intervals to avoid possible clashes of H173 sidechains at a shorter distance. A temperature range of 300 and 400 K was divided into six temperatures. In total 72 replicas were simulated for 10 ns with a 1fs time step for each replica using both HDGBv3 and HDGBvdW and, again, the first 4 ns were discarded and the rest were used for the analysis.
Molecular Dynamics Simulations of WALP23 Peptide
The helical WALP23 peptide was simulated using the HDGBv3 and HDGBvdW models to compare the helix insertion angles. The peptide terminals were blocked with an acetyl group at the C-terminus and an amide group at the N-terminus. Simulations were carried out using the general protocol as described above. Starting from an initial orientation, where the peptide is centered at z=0 and oriented parallel to z, 16 independent production runs were performed, each over 20 ns. The first 4 ns were discarded and helix tilt angles relative to the membrane normal z were analyzed.
We also calculated free energy profiles against tilt angles from umbrella sampling simulations. Tilt angles with respect to z-axis were varied between 0 to 30° with 2° intervals using a force constant of 200 kcal/(mol rad2). The CONSHELIX routine in CHARMM was used to restraint the tilt angle. 10 ns simulations for each window were performed and the first 4 ns were discarded during the analysis.
RESULTS AND DISCUSSION
We will begin by comparing the performance of HDGBvdW with HDGBv3 for the amino acid side chain analog insertion and intra-membrane association profiles that were used as training sets before discussing a number of test cases related to transmembrane helix association and orientation.
Membrane Insertion Profiles of Amino Acid Side Chain Analogs
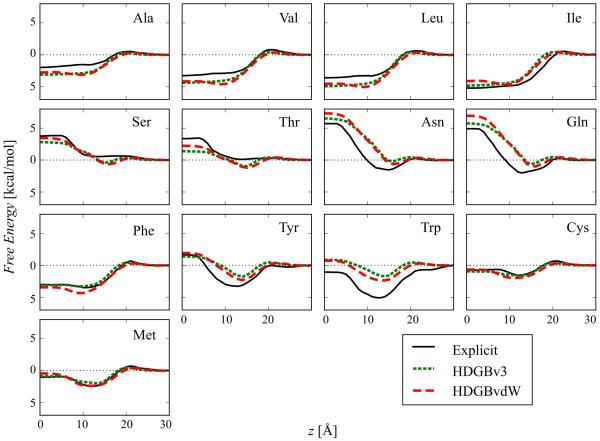
Insertion free energy profiles of amino acid side chain analogs along the membrane normal were calculated with the fully optimized HDGBvdW model. They are compared with profiles from HDGBv3 and explicit membrane simulations62,63 in Fig. 4. Overall, HDGBvdW results in similar profiles as with HDGBv3. There is similarly good, but slightly improved agreement between the implicit and explicit membrane models. More specifically, profiles for the amino acid analogs of Ser, Thr, Tyr and Trp were overall improved, whereas the profiles for the Gln, Asn, Ile, and Phe analogs became slightly better between 10-20 Å but slightly worse close to the membrane center. Since optimal reproduction of the insertion profiles was used to adjust the non-polar profile and γ parameter in Eq. 3, the excellent agreement is not surprising with the remaining deviations from the explicit lipid profiles largely within the uncertainties of the insertion free energies from the explicit lipid simulations except for Ala, Val, Asn and Trp, where the error bars are smaller and the profiles with both implicit models are slightly outside the error range.62,63
Figure 4.
Free energy profiles for membrane insertion of amino acid side chain analogs using the HDGBv3 and HDGBvdW models compared to profiles obtained from explicit membrane simulations. The error bars for the explicit simulations are not shown for the clarity of the figure. For the analogs of Asn, Trp, Ala, Val, Gln and Ser, errors are less than 0.5 kcal/mol, for Leu, Cys, Phe and Met, errors are within 0.5 and 1.0 kcal/mol and for Tyr and Thr errors are larger than 1.5 kcal/mol.
Association Profiles of Amino Acid Side Chain Analogs
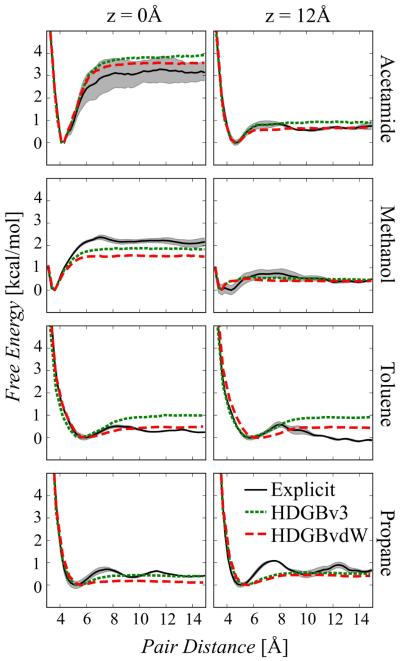
Interactions of selected amino acid analogs within the membrane at fixed insertion depths were calculated via umbrella sampling using HDGBvdW and compared against HDGBv3 and previous results from explicit lipid simulations43 (see Fig. 5). The explicit simulations provide highly converged free energy profiles except acetamide, the Asn analog, at the membrane center. For the acetamide at z=0, the error bars are larger, which makes the comparison more difficult between HDGBvdW and HDGBv3. HDGBvdW gives an energy profile within the errors while the HDGBv3 profile is slightly outside the error range. Otherwise, HDGBvdW generally improves the agreement with the explicit profiles. Only methanol and propane become slightly worse at z=0. Most striking is the significant improvement for the hydrophobic compound toluene, the Phe analog. The improvement for toluene highlights the importance of including an attractive implicit van der Waals term. In the absence of significant electrostatic contributions to the solvation free energy, the cost of cavity term in the HDGBv3 model favors dimer association of the relatively large molecule which leads to overestimation of the association free energy.
Figure 5.
Free energy profiles for intra-membrane pair association for acetamide, methanol, toluene and propane at z positions of 0 and 12 Å with HDGBv3 and HDGBvdW in comparison with explicit membrane simulations. The shaded areas are representing statistical uncertainties in the explicit membrane profiles.
Closer inspection of Fig. 5 shows that at the membrane center, the free energy difference between the contact and fully dissociated pairs with HDGBvdW is either at or below the explicit lipid results while the (small) deviations at z=12 Å are more even. The agreement between HDGBvdW and the explicit profiles could, therefore, in principle be improved by adjusting the non-polar profile and γ so that the contribution from the cavity term becomes slightly larger only near the membrane center. However, such a modification would compromise the excellent agreement for the insertion free energies discussed above.
Remaining deviations between the implicit and explicit profiles involve a distinct peak around 7 Å that is analogous to the first solvation peak in aqueous solvent and that stems from the discreteness of lipid molecules in the explicit lipid bilayer. This feature cannot be reproduced in the implicit membrane model because of its continuum nature where molecular features are neglected. The explicit lipid profiles also include contributions from membrane deformations that occur at certain close distances of the hydrophilic analogs. The HDGBvdW model assumes fixed slab bilayer geometries but a combination of HDGBvdW with the DHDGB model90 that allows membrane deformations to be considered is in principle possible and will be explored in future work.
Helix-Helix Association of pVNVV Dimer
To test how the HDGBvdW model performs beyond the test sets used for training, we now turn to the association of transmembrane helices. Helix-helix interaction energies of the pVNVV dimer were previously established as a good test case for studying the energetics of transmembrane association77. In previous work, the association free energy of pVNVV in a DMPC lipid bilayer was estimated to be around 12.6 kcal/mol77. Since we parameterized HDGBvdW for a DPPC bilayer (based on the analog insertion and association profiles), we recalculated the association free energy of pVNVV in a DPPC bilayer using umbrella sampling (see Methods). The resulting association free energy of 14.7 kcal/mol is of similar magnitude.
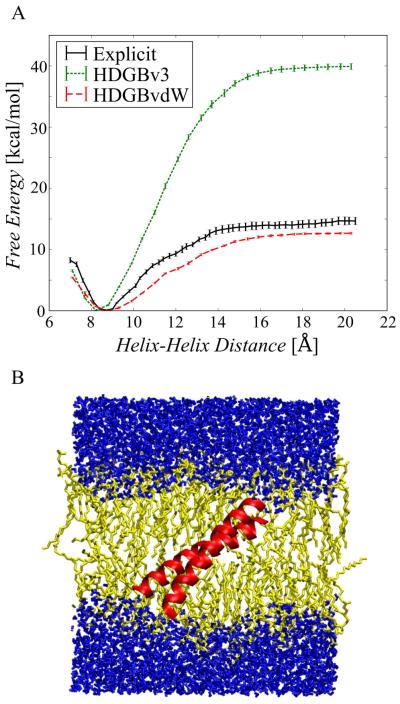
The association free energy profile in explicit lipids was compared with association free energies with HDGBv3 and HDGBvdW (cf. Fig. 6A). It is readily apparent that the HDGBv3 model without the dispersion term greatly overestimates the association free energy relative to the explicit lipid results. This can be understood, again, by a cost of cavity term that strongly favors dimer association (by 40 kcal/mol) whereas the inclusion of the dispersion term in the HDGBvdW model results in a profile that closely matches the explicit lipid profile. With HDGBvdW, the association free energy is only slightly underestimated relative to the explicit lipid results at 12.7 kcal/mol. Furthermore, the dimer contact distances where the minimum free energy was observed were slightly different between HDGBv3 and HDBGvdW. While the minimum distance of 8.8 Å with HDGBvdW closely matches the explicit simulations where the minimum distance is about 8.7 Å, the HDGBv3 model has the minimum at a shorter distance of 8.2 Å. This indicates that the dimer association is not just quantitatively but also qualitatively different when the dispersion term is not included.
Figure 6.
(A) Free energy profiles of pVNVV peptide dimer association as a function of helix-helix distance obtained from explicit DPPC simulations (solid black line), HDGBv3 (green dotted line), and HDGBvdW (red dashed line). (B) Snapshot of the explicit membrane simulations at a helix-helix distance of 8.5 Å.
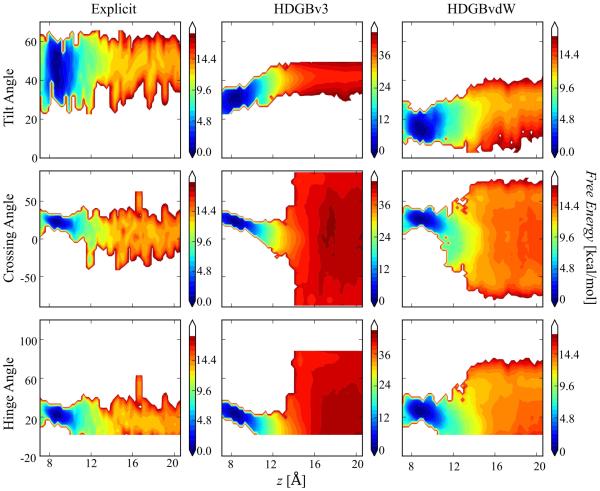
The sampled dimer configurations were further analyzed in order to gain insight into the ensembles generated with the implicit membrane models compared to the explicit lipid results. Fig. 7 shows 2D PMFs as a function of separation distance and three different angles that characterize the helix orientations: the tilt angle is the average angle of the two helices with respect to the z-axis; the crossing angle measures the dihedral angle between based on four points, the N-terminus of one helix, the two points of closest contact between the two helices, and the N-terminus of the other helix; and the hinge angle captures the angle between the principle axes of two helices as following the work of Lee et al.84. Crossing and hinge angles were similar between the explicit and implicit simulations. In all cases, average crossing and hinge angles near 22°, the values of the PDB starting structure (2ZTA), were maintained for the contact dimer. At distances larger than 10 Å, the angles fluctuated significantly as expected for two non-interacting, tilted helices. The explicit lipid simulations show less variation in the crossing and hinge angles but that is likely due to limited sampling and slow kinetics in the presence of explicit lipids
Figure 7.
2D free energy profiles for pVNVV as a function of helix-helix separation and helix tilt angles (top row), crossing angles (middle row), and hinge angles (bottom row). Results from explicit lipid simulations (left column) are compared with results from HDGBv3 (middle column) and HDGBvdW (right column).
Tilt angles from the HDGBv3 and HDGBvdW simulations differed significantly from the explicit lipid simulations. While the helices were significantly tilted in the explicit lipids (by 20-60°), tilting with HDGBv3 was less, around 30°, and even less, around 10-20°, with the HDGBvdW model. The large tilt obtained in the explicit simulation correlates with membrane deformations (see in Fig. 6B) that are not considered in either HDGBv3 or HDGBvdW. It will require further work to test whether a combination of HDGBvdW with the DHDGB scheme,90 which does allow deformations within the implicit framework, can better reproduce the more tilted configurations seen with explicit lipids.
Dimerization of GpA, Bnip3 and EphA1 Peptides
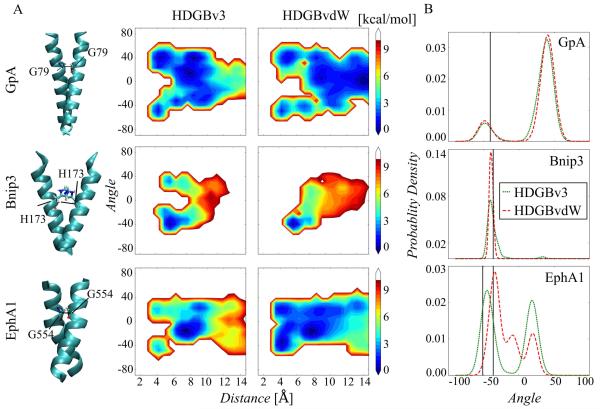
To further test whether the implicit membrane model can reproduce structural features of transmembrane proteins, we simulated well-characterized transmembrane helix dimer systems with the goal of reproducing the correct dimer configurations. In particular, we focus on predicting the experimental crossing angles, which had been a challenge in the past with other implicit membrane models38,91. More specifically we tested glycophorin A (GpA, experimental crossing angle of −40.2°87), Bcl-2/19-kDa interacting protein 3 (Bnip3; experimental crossing angle of −36.39°88), and erythropoietin-producing hepatocellular receptor A1 (EphA1; experimental crossing angle of −51.22 and −36.36 for two different NMR structures89). Extensive reference data is available for all systems from experimental87,92-94and computational studies.38,95-101 We carried out 2D replica exchange sampling because dimer contact formation was not as spontaneous and kinetically hindered with HDGBvdW due to the weaker association free energy compared to HDGBv3. The results obtained with HDGBv3 and HDGBvdW are summarized in Fig. 8. The two-dimensional PMF profiles with the distance and crossing angle as the reaction coordinates are shown in Fig. 8A and the crossing angle distributions for the contact dimers are shown in the form of histograms in Fig. 8B. There are significant differences between HDGBv3 and HDGBvdW for Bnip3 and EphA1 dimers. In both cases, HDGBvdW provides much better agreement with the experimental values with a higher population of the right-handed orientation. For GpA, 2D PMF profiles obtained by both models are similar to each other and comparable with the result of a previously published work100. Higher crossing angles were obtained at the short interhelical distances, where the two helices are forming a dimer. HDGBvdW maintained the crossing angle distribution obtained by HDGBv3 with a slightly higher right-handed population (see Table 3). Table 3 further quantifies the most likely crossing angles predicted by HDGBvdW and HDGBv3 compared to the experimental values. Overall, the results suggest that for two cases (Bnip3 and EphA1), the HDGBvdW model produces more right handed populated orientations than HDGBv3 in better agreement with the experimental crossing angles, while for two other cases (GpA and pVNVV), the HDGBvdW model was not able to improve the agreement with experiment over the HDGBv3 results.
Figure 8.
(A) Free energy landscapes as a function of the pair distance of G79, H173 and G554 amino acids on the helix dimers of GpA, Bnip3 and EphA1, respectively and crossing angles between the helices at 300 K from the simulations with HDGBv3 and HDGBvdW . (B) Probability distribution curves of the crossing angles of helix dimers derived from 2D REMD simulations for the pair distances less than 6 Å. The black lines are corresponding to the experimental crossing angles from the solution state NMR models.
Table 3.
Transmembrane helix dimer geometries. Crossing angles of pVNVV , GpA, EphA1, and Bnip3 helix dimers from experiments, explicit simulations, and implicit HDGBv3 and HDGBvdW models. A negative sign refers to a right-handed orientation. For the experimental results, the average crossing angles of the NMR structures of 1AFO87 for GpA, 2J5D88 for Bnip3 and 2K1L89 and 2K1L89 for EphA1 were calculated.
| TM Helix Dimer System | Experiment | Explicit | HDGBv3 | HDGBvdW |
|---|---|---|---|---|
| pVNVV | N/A | ~22° | ~22° | ~22° |
| GpA | −40.2°87 | −42°101 | 39.7° (85%) −48.6° (15%) |
40.9° (84%) −48.5° (16%) |
| Bnip3 | −36.39°88 | −27°, −28°, −35°, 52°97 |
−40.4° (97%) 33.7° (3%) |
−39.5° |
| EphA1 | −51.22°89
−36.36°89 |
45°99
−40°, 20°98 |
−45.2° (53%) 18.5° (47%) |
−34.3° (57%) −8.9° (20%) 19.3° (23%) |
Membrane Orientation of WALP23 Peptide
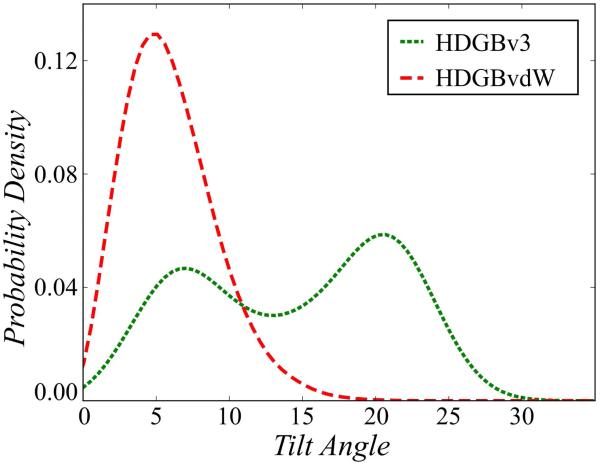
Finally, we simulated WALP23 to analyze the tilt angles with respect to the membrane. WALP peptides are synthetic transmembrane peptides specifically designed for modeling hydrophobic mismatch between peptides and the membrane environment.102-104 Fig. 9 compares the tilt angles obtained with HDGBvdW and HDGBv3. While HDGBv3 shows two separate populations at tilt angles of 7.1° and 20.7°, the HDGBvdW model, only samples the state with the smaller tilt angle (with an angle of 5.1° at the maximum of the distribution curve). Previous explicit membrane simulations reported a tilt angle of 14.9° for POPC and 28° for DMPC.75 As in the pVNVV system described above, the implicit membrane models exhibit less tilting compared to the explicit lipid simulations, especially with the HDGBvdW. To examine this point further, we compared the tilting free energies between HDGBv3 and HDGBvdW from umbrella simulations (see Fig. S4). Consistent with the unbiased simulations, we found tilting beyond 5° to be unfavorable by 1-2 kcal/mol with the HDGBvdW model whereas the HDGBv3 model has a minimum around 22°. What exactly gives rise to the differences between the HDGBvdW and HDGBv3 models and whether there is room for improvement is not clear. However, we generally believe that a lack of membrane deformations with the implicit membrane models prevents the larger degrees of tilting seen in explicit membrane simulations where there is evidence for some deformation of the membrane bilayer near tilted helices105,106. Allowing membrane deformations in the DHDGB model90 that was based on an earlier version of HDGB resulted in more tilted configurations in better agreement with the explicit lipid simulations. Therefore we expect that the combination of the DHDGB framework with HDGBvdW would also lead to more tilted helices. This will be tested in future work.
Figure 9.
Probability distribution of the helix tilt angle for WALP23 peptide in simulations with HDGBv3 and HDGBvdW.
CONCLUSION
In this work, the HDGBvdW model is introduced where the non-polar solvation free energy is described more accurately by both, a repulsive SASA-based cost-of-cavity term and an attractive dispersion term to capture solute-solvent van der Waals interactions. The dispersion term extends the implicit van der Waals formalism introduced by Galicchio et al. to the heterogeneous membrane environment. HDGBvdW was parametrized based on amino acid side chain analog membrane insertion and intra-membrane association profiles resulting in some improvement relative to the standard HDGB model, especially for hydrophobic side chains. When applied to the interaction of transmembrane helices within the membrane, the HDGBvdW provides good agreement with explicit lipid simulations and contact dimer structures observed experimentally whereas the HDGB model without the dispersion term greatly overestimates helix association free energies and has greater difficulties predicting dimer configurations with the correct crossing angles.
Future work will focus on combining HDGBvdW with dynamic membrane deformations in response to an inserted solute so that helix tilt angles become in better agreement with explicit lipid simulations. While the general framework that involves coupling with membrane elasticity theory has been developed in the DHDGB model, dynamic membrane deformations coupled to HDGBvdW require an analysis of how membrane deformations alter the lipid component density distributions that are used in Eq. 10 which is beyond the scope of the present work.
The HDGBvdW model represents the most elaborate implicit membrane model to date capturing many aspects of complex lipid bilayer environments, albeit still without requiring explicit lipids and thereby maintaining significant computational advantages over explicit lipid simulations.
Implicit membrane models are also well-suited as scoring functions in the context of membrane structure prediction107. We expect that the HDGBvdW model will be able to perform especially well in the discrimination of correctly and incorrectly assembled transmembrane helix topologies, which is one of the key challenges in predicting the correct structures of membrane proteins.
Supplementary Material
ACKNOWLEDGEMENTS
This work was funded by the National Institute of Health (R01GM084953). Computational resources were used at XSEDE facilities at the Texas Advanced Computer Center (TG-MCB090003).
REFERENCES
- 1.Karplus M, McCammon JA. Nat Struct Biol. 2002;9:646–652. doi: 10.1038/nsb0902-646. [DOI] [PubMed] [Google Scholar]
- 2.Leach AR. Molecular modelling : principles and applications. Prentice Hall; Harlow, England; New York: 2001. [Google Scholar]
- 3.Sapay N, Tieleman DP. In Curr Top Membr. 2008:111–130. [Google Scholar]
- 4.Ulmschneider JP, Ulmschneider MB. Proteins. 2009;75:586–597. doi: 10.1002/prot.22270. [DOI] [PubMed] [Google Scholar]
- 5.Berneche S, Nina M, Roux B. Biophys J. 1998;75:1603–1618. doi: 10.1016/S0006-3495(98)77604-0. [DOI] [PMC free article] [PubMed] [Google Scholar]
- 6.Brooks CL, Karplus M. J Mol Biol. 1989;208:159–181. doi: 10.1016/0022-2836(89)90093-4. [DOI] [PubMed] [Google Scholar]
- 7.Forrest LR, Sansom MSP. Curr Opin Struct Biol. 2000;10:174–181. doi: 10.1016/s0959-440x(00)00066-x. [DOI] [PubMed] [Google Scholar]
- 8.Hansson T, Oostenbrink C, van Gunsteren WF. Curr Opin Struct Biol. 2002;12:190–196. doi: 10.1016/s0959-440x(02)00308-1. [DOI] [PubMed] [Google Scholar]
- 9.Baker NA. Curr Opin Struct Biol. 2005;15:137–143. doi: 10.1016/j.sbi.2005.02.001. [DOI] [PubMed] [Google Scholar]
- 10.Feig M. Modeling solvent environments : applications to simulations of biomolecules. Wiley-VCH; Weinheim: 2010. [Google Scholar]
- 11.Feig M, Brooks CL., 3rd Curr Opin Struct Biol. 2004;14:217–224. doi: 10.1016/j.sbi.2004.03.009. [DOI] [PubMed] [Google Scholar]
- 12.Kukol A. Molecular modeling of proteins. Humana Press; Totowa, NJ: 2008. [Google Scholar]
- 13.Lee MS, Salsbury FR, Brooks CL. J Chem Phys. 2002;116:10606–10614. [Google Scholar]
- 14.Roux B, Simonson T. Biophys Chem. 1999;78:1–20. doi: 10.1016/s0301-4622(98)00226-9. [DOI] [PubMed] [Google Scholar]
- 15.Schaefer M, Karplus M. J Phys Chem. 1996;100:1578–1599. [Google Scholar]
- 16.Fogolari F, Brigo A, Molinari H. J Mol Recogn. 2002;15:377–392. doi: 10.1002/jmr.577. [DOI] [PubMed] [Google Scholar]
- 17.Simonson T. Curr Opin Struct Biol. 2001;11:243–252. doi: 10.1016/s0959-440x(00)00197-4. [DOI] [PubMed] [Google Scholar]
- 18.Baker NA. Methods Enzymol. 2004;383:94–118. doi: 10.1016/S0076-6879(04)83005-2. [DOI] [PubMed] [Google Scholar]
- 19.Davis ME, Mccammon JA. J Comput Chem. 1989;10:386–391. [Google Scholar]
- 20.Gilson MK, Honig B. Proteins. 1988;4:7–18. doi: 10.1002/prot.340040104. [DOI] [PubMed] [Google Scholar]
- 21.Rocchia W, Alexov E, Honig B. J Phys Chem B. 2001;105:6507–6514. [Google Scholar]
- 22.Oren I, Fleishman SJ, Kessel A, Ben-Tal N. Biophys J. 2004;87:768–779. doi: 10.1529/biophysj.103.035527. [DOI] [PMC free article] [PubMed] [Google Scholar]
- 23.Misra VK, Honig B. Proc Natl Acad Sci. 1995;92:4691–4695. doi: 10.1073/pnas.92.10.4691. [DOI] [PMC free article] [PubMed] [Google Scholar]
- 24.Feig M, Onufriev A, Lee MS, Im W, Case DA, Brooks CL. J Comput Chem. 2004;25:265–284. doi: 10.1002/jcc.10378. [DOI] [PubMed] [Google Scholar]
- 25.Fogolari F, Brigo A, Molinari H. Biophys J. 2003;85:159–166. doi: 10.1016/S0006-3495(03)74462-2. [DOI] [PMC free article] [PubMed] [Google Scholar]
- 26.Luo R, David L, Gilson MK. J Comput Chem. 2002;23:1244–1253. doi: 10.1002/jcc.10120. [DOI] [PubMed] [Google Scholar]
- 27.Im W, Beglov D, Roux B. Comput Phys Commun. 1998;111:59–75. [Google Scholar]
- 28.Still WC, Tempczyk A, Hawley RC, Hendrickson T. J Am Chem Soc. 1990;112:6127–6129. [Google Scholar]
- 29.Lee MS, Feig M, Salsbury FR, Brooks CL. J Comput Chem. 2003;24:1348–1356. doi: 10.1002/jcc.10272. [DOI] [PubMed] [Google Scholar]
- 30.Feig M, Brooks CL., 3rd Proteins. 2002;49:232–245. doi: 10.1002/prot.10217. [DOI] [PubMed] [Google Scholar]
- 31.Feig M, MacKerell AD, Brooks CL. J Phys Chem B. 2003;107:2831–2836. [Google Scholar]
- 32.Ferrara P, Gohlke H, Price DJ, Klebe G, Brooks CL. J Med Chem. 2004;47:3032–3047. doi: 10.1021/jm030489h. [DOI] [PubMed] [Google Scholar]
- 33.Masunov A, Lazaridis T. J Am Chem Soc. 2003;125:1722–1730. doi: 10.1021/ja025521w. [DOI] [PubMed] [Google Scholar]
- 34.Onufriev A, Case DA, Bashford D. J Mol Biol. 2003;325:555–567. doi: 10.1016/s0022-2836(02)01207-x. [DOI] [PubMed] [Google Scholar]
- 35.Callenberg KM, Choudhary OP, de Forest GL, Gohara DW, Baker NA, Grabe M. Plos One. 2010;5:e12722. doi: 10.1371/journal.pone.0012722. [DOI] [PMC free article] [PubMed] [Google Scholar]
- 36.Roux B, MacKinnon R. Science. 1999;285:100–102. doi: 10.1126/science.285.5424.100. [DOI] [PubMed] [Google Scholar]
- 37.Tobias DJ. Curr Opin Struct Biol. 2001;11:253–261. doi: 10.1016/s0959-440x(00)00198-6. [DOI] [PubMed] [Google Scholar]
- 38.Im W, Feig M, Brooks CL. Biophys J. 2003;85:2900–2918. doi: 10.1016/S0006-3495(03)74712-2. [DOI] [PMC free article] [PubMed] [Google Scholar]
- 39.Roux B, Berneche S, Im W. Biochemistry. 2000;39:13295–13306. doi: 10.1021/bi001567v. [DOI] [PubMed] [Google Scholar]
- 40.Spassov VZ, Yan L, Szalma S. J Phys Chem B. 2002;106:8726–8738. [Google Scholar]
- 41.Stern HA, Feller SE. J Chem Phys. 2003;118:3401–3412. [Google Scholar]
- 42.Tanizaki S, Feig M. J Chem Phys. 2005;122:124706. doi: 10.1063/1.1865992. [DOI] [PubMed] [Google Scholar]
- 43.Mirjalili V, Feig M. J Phys Chem B. 2015;119:2877–2885. doi: 10.1021/jp511712u. [DOI] [PMC free article] [PubMed] [Google Scholar]
- 44.Sayadi M, Tanizaki S, Feig M. Biophys J. 2010;98:805–814. doi: 10.1016/j.bpj.2009.11.015. [DOI] [PMC free article] [PubMed] [Google Scholar]
- 45.Jaskierny AJ, Panahi A, Feig M. Proteins. 2011;79:1109–1117. doi: 10.1002/prot.22947. [DOI] [PMC free article] [PubMed] [Google Scholar]
- 46.Panahi A, Feig M. J Phys Chem B. 2010;114:1407–1416. doi: 10.1021/jp907366g. [DOI] [PubMed] [Google Scholar]
- 47.Sayadi M, Feig M. Biochim Biophys Acta. 2013;1828:577–585. doi: 10.1016/j.bbamem.2012.08.017. [DOI] [PubMed] [Google Scholar]
- 48.Ferrara P, Apostolakis J, Caflisch A. Proteins. 2002;46:24–33. doi: 10.1002/prot.10001. [DOI] [PubMed] [Google Scholar]
- 49.Sitkoff D, Sharp KA, Honig B. J Phys Chem. 1994;98:1978–1988. [Google Scholar]
- 50.Pitarch J, Moliner V, PascualAhuir JL, Silla E, Tunon I. J Phys Chem. 1996;100:9955–9959. [Google Scholar]
- 51.Su Y, Gallicchio E. Biophys Chem. 2004;109:251–260. doi: 10.1016/j.bpc.2003.11.007. [DOI] [PubMed] [Google Scholar]
- 52.Gallicchio E, Levy RM. J Comput Chem. 2004;25:479–499. doi: 10.1002/jcc.10400. [DOI] [PubMed] [Google Scholar]
- 53.Gallicchio E, Zhang LY, Levy RM. J Comput Chem. 2002;23:517–529. doi: 10.1002/jcc.10045. [DOI] [PubMed] [Google Scholar]
- 54.Weeks JD, Chandler D, Andersen HC. J Chem Phys. 1971;54:5237–5247. [Google Scholar]
- 55.Floris F, Tomasi J. J Comput Chem. 1989;10:616–627. [Google Scholar]
- 56.Floris FM, Tomasi J, Ahuir JLP. J Comput Chem. 1991;12:784–791. [Google Scholar]
- 57.Zacharias M. J Phys Chem A. 2003;107:3000–3004. [Google Scholar]
- 58.Levy RM, Zhang LY, Gallicchio E, Felts AK. J Am Chem Soc. 2003;125:9523–9530. doi: 10.1021/ja029833a. [DOI] [PubMed] [Google Scholar]
- 59.Klauda JB, Venable RM, Freites JA, O'Connor JW, Tobias DJ, Mondragon-Ramirez C, Vorobyov I, MacKerell AD, Pastor RW. J Phys Chem B. 2010;114:7830–7843. doi: 10.1021/jp101759q. [DOI] [PMC free article] [PubMed] [Google Scholar]
- 60.Jorgensen WL, Chandrasekhar J, Madura JD, Impey RW, Klein ML. J Chem Phys. 1983;79:926–935. [Google Scholar]
- 61.Brooks BR, Bruccoleri RE, Olafson BD, States DJ, Swaminathan S, Karplus M. J Comput Chem. 1983;4:187–217. [Google Scholar]
- 62.MacCallum JL, Bennett WF, Tieleman DP. J Gen Physiol. 2007;129:371–377. doi: 10.1085/jgp.200709745. [DOI] [PMC free article] [PubMed] [Google Scholar]
- 63.MacCallum JL, Bennett WF, Tieleman DP. Biophys J. 2008;94:3393–3404. doi: 10.1529/biophysj.107.112805. [DOI] [PMC free article] [PubMed] [Google Scholar]
- 64.Best RB, Zhu X, Shim J, Lopes PE, Mittal J, Feig M, Mackerell AD., Jr. J Chem Theory Comput. 2012;8:3257–3273. doi: 10.1021/ct300400x. [DOI] [PMC free article] [PubMed] [Google Scholar]
- 65.Jo S, Kim T, Iyer VG, Im W. J Comput Chem. 2008;29:1859–1865. doi: 10.1002/jcc.20945. [DOI] [PubMed] [Google Scholar]
- 66.Jo S, Lim JB, Klauda JB, Im W. Biophys J. 2009;97:50–58. doi: 10.1016/j.bpj.2009.04.013. [DOI] [PMC free article] [PubMed] [Google Scholar]
- 67.Inaba K, Murakami S, Nakagawa A, Iida H, Kinjo M, Ito K, Suzuki M. EMBO J. 2009;28:779–791. doi: 10.1038/emboj.2009.21. [DOI] [PMC free article] [PubMed] [Google Scholar]
- 68.Ryckaert JP, Ciccotti G, Berendsen HJC. J Comput Phys. 1977;23:327–341. [Google Scholar]
- 69.Jorgensen WL, Maxwell DS, TiradoRives J. J Am Chem Soc. 1996;118:11225–11236. [Google Scholar]
- 70.Jorgensen WL, Tiradorives J. J Am Chem Soc. 1988;110:1657–1666. doi: 10.1021/ja00214a001. [DOI] [PubMed] [Google Scholar]
- 71.Torrie GM, Valleau JP. J Comput Phys. 1977;23:187–199. [Google Scholar]
- 72.Vanommeslaeghe K, Hatcher E, Acharya C, Kundu S, Zhong S, Shim J, Darian E, Guvench O, Lopes P, Vorobyov I, MacKerell AD. J Comput Chem. 2010;31:671–690. doi: 10.1002/jcc.21367. [DOI] [PMC free article] [PubMed] [Google Scholar]
- 73.Feig M, Karanicolas J, Brooks CL., 3rd J Mol Graph Model. 2004;22:377–395. doi: 10.1016/j.jmgm.2003.12.005. [DOI] [PubMed] [Google Scholar]
- 74.Shirts MR, Chodera JD. J Chem Phys. 2008;129:124105. doi: 10.1063/1.2978177. [DOI] [PMC free article] [PubMed] [Google Scholar]
- 75.Kim T, Im W. Biophys J. 2010;99:175–183. doi: 10.1016/j.bpj.2010.04.015. [DOI] [PMC free article] [PubMed] [Google Scholar]
- 76.Oshea EK, Klemm JD, Kim PS, Alber T. Science. 1991;254:539–544. doi: 10.1126/science.1948029. [DOI] [PubMed] [Google Scholar]
- 77.Lee J, Im W. J Am Chem Soc. 2008;130:6456–6462. doi: 10.1021/ja711239h. [DOI] [PubMed] [Google Scholar]
- 78.Hoover WG. Phys Rev A. 1985;31:1695–1697. doi: 10.1103/physreva.31.1695. [DOI] [PubMed] [Google Scholar]
- 79.Nose S, Klein ML. Mol Phys. 1983;50:1055–1076. [Google Scholar]
- 80.Darden T, York D, Pedersen L. J Chem Phys. 1993;98:10089–10092. [Google Scholar]
- 81.Nagle JF, Tristram-Nagle S. Biochim Biophys Acta. 2000;1469:159–195. doi: 10.1016/s0304-4157(00)00016-2. [DOI] [PMC free article] [PubMed] [Google Scholar]
- 82.Lee J, Cheng X, Swails JM, Yeom MS, Eastman PK, Lemkul JA, Wei S, Buckner J, Jeong JC, Qi YF, Jo S, Pande VS, Case DA, Brooks CL, MacKerell AD, Klauda JB, Im W. J Chem Theory Comput. 2016;12:405–413. doi: 10.1021/acs.jctc.5b00935. [DOI] [PMC free article] [PubMed] [Google Scholar]
- 83.Chothia C, Levitt M, Richardson D. J Mol Biol. 1981;145:215–250. doi: 10.1016/0022-2836(81)90341-7. [DOI] [PubMed] [Google Scholar]
- 84.Lee J, Im W. J Comput Chem. 2007;28:669–680. doi: 10.1002/jcc.20614. [DOI] [PubMed] [Google Scholar]
- 85.Hansmann UHE. Chem Phys Lett. 1997;281:140–150. [Google Scholar]
- 86.Sugita Y, Okamoto Y. Chem Phys Lett. 1999;314:141–151. [Google Scholar]
- 87.MacKenzie KR, Prestegard JH, Engelman DM. Science. 1997;276:131–133. doi: 10.1126/science.276.5309.131. [DOI] [PubMed] [Google Scholar]
- 88.Bocharov EV, Pustovalova YE, Pavlov KV, Volynsky PE, Goncharuk MV, Ermolyuk YS, Karpunin DV, Schulga AA, Kirpichnikov MP, Efremov RG, Maslennikov IV, Arseniev AS. J Biol Chem. 2007;282:16256–16266. doi: 10.1074/jbc.M701745200. [DOI] [PubMed] [Google Scholar]
- 89.Bocharov EV, Mayzel ML, Volynsky PE, Goncharuk MV, Ermolyuk YS, Schulga AA, Artemenko EO, Efremov RG, Arseniev AS. J Biol Chem. 2008;283:29385–29395. doi: 10.1074/jbc.M803089200. [DOI] [PMC free article] [PubMed] [Google Scholar]
- 90.Panahi A, Feig M. J Chem Theory Comput. 2013;9:1709–1719. doi: 10.1021/ct300975k. [DOI] [PMC free article] [PubMed] [Google Scholar]
- 91.Bu LT, Im W, Charles LI. Biophys J. 2007;92:854–863. doi: 10.1529/biophysj.106.095216. [DOI] [PMC free article] [PubMed] [Google Scholar]
- 92.Fisher LE, Engelman DM, Sturgis JN. Biophys J. 2003;85:3097–3105. doi: 10.1016/S0006-3495(03)74728-6. [DOI] [PMC free article] [PubMed] [Google Scholar]
- 93.Popot JL, Engelman DM. Biochemistry. 1990;29:4031–4037. doi: 10.1021/bi00469a001. [DOI] [PubMed] [Google Scholar]
- 94.Sulistijo ES, Jaszewski TM, MacKenzie KR. J Biol Chem. 2003;278:51950–51956. doi: 10.1074/jbc.M308429200. [DOI] [PubMed] [Google Scholar]
- 95.Bond PJ, Sansom MSP. J Am Chem Soc. 2006;128:2697–2704. doi: 10.1021/ja0569104. [DOI] [PMC free article] [PubMed] [Google Scholar]
- 96.Polyansky AA, Volynsky PE, Efremov RG. J Am Chem Soc. 2012;134:14390–14400. doi: 10.1021/ja303483k. [DOI] [PubMed] [Google Scholar]
- 97.Vereshaga YA, Volynsky PE, Pustovalova JE, Nolde DE, Arseniev AS, Efremov RG. Proteins: Struct Funct Bioinform. 2007;69:309–325. doi: 10.1002/prot.21555. [DOI] [PubMed] [Google Scholar]
- 98.Volynsky PE, Mineeva EA, Goncharuk MV, Ermolyuk YS, Arseniev AS, Efremov RG. Phys Biol. 2010;7:016014. doi: 10.1088/1478-3975/7/1/016014. [DOI] [PubMed] [Google Scholar]
- 99.Zhang LQ, Sodt AJ, Venable RM, Pastor RW, Buck M. Proteins: Struct Funct Bioinform. 2013;81:365–376. doi: 10.1002/prot.24192. [DOI] [PMC free article] [PubMed] [Google Scholar]
- 100.Park S, Im W. J Chem Theory Comput. 2013;9:13–17. doi: 10.1021/ct3008556. [DOI] [PMC free article] [PubMed] [Google Scholar]
- 101.Cuthbertson JM, Bond PJ, Sansom MSP. Biochemistry. 2006;45:14298–14310. doi: 10.1021/bi0610911. [DOI] [PubMed] [Google Scholar]
- 102.de Planque MRR, Goormaghtigh E, Greathouse DV, Koeppe RE, Kruijtzer JAW, Liskamp RMJ, de Kruijff B, Killian JA. Biochemistry. 2001;40:5000–5010. doi: 10.1021/bi000804r. [DOI] [PubMed] [Google Scholar]
- 103.de Planque MRR, Killian JA. Mol Membr Biol. 2003;20:271–284. doi: 10.1080/09687680310001605352. [DOI] [PubMed] [Google Scholar]
- 104.Lee J, Im W. Phys Rev Lett. 2008;100:018103. doi: 10.1103/PhysRevLett.100.018103. [DOI] [PubMed] [Google Scholar]
- 105.Kandasamy SK, Larson RG. Biophys J. 2006;90:2326–2343. doi: 10.1529/biophysj.105.073395. [DOI] [PMC free article] [PubMed] [Google Scholar]
- 106.Petrache HI, Zuckerman DM, Sachs JN, Killian JA, Koeppe RE, Woolf TB. Langmuir. 2002;18:1340–1351. [Google Scholar]
- 107.Yuzlenko O, Lazaridis T. J Comput Chem. 2013;34:731–738. doi: 10.1002/jcc.23189. [DOI] [PMC free article] [PubMed] [Google Scholar]
Associated Data
This section collects any data citations, data availability statements, or supplementary materials included in this article.


