

Abstract
Background
Circulating tumor cells (CTCs) have been identified in the blood of patients with pancreatic adenocarcinoma (PDAC), but little is known about the exact phenotype of these cells. We assessed expression of aldehyde dehydrogenase (ALDH), CD133, and CD44 as markers of CTCs with a tumor initiating cell (TIC) phenotype in PDAC patients and the relationship of this expression to patient outcomes.
Methods
Peripheral blood from sixty consecutive PDAC patients undergoing surgical resection was obtained and processed using the Isolation by Size of Epithelial Tumor (ISET) method. Immunofluorescence was used to identify CTCs expressing cytokeratin, CD133, CD44 and ALDH.
Results
Forty-seven patients (78%) had epithelial CTCs staining positive for pan-cytokeratin and at least one TIC marker. Forty-six patients (77%) had epithelial CTCs that labeled with antibodies to cytokeratin and ALDH. By separate analysis, 34 (57%) had cytokeratin-positive, CD133-positive, and CD44-positive (triple positive) CTCs while 40 (67%) had cytokeratin-positive, CD133-positive, CD44-negative CTCs. The remaining 13 patients did not have CTCs, as defined by cytokeratin expression. ALDH-positive CTCs and triple-positive CTCs were significantly associated with worse survival by univariate analysis, even when accounting for other significant prognostic factors (all, P≤0.01). ALDH-positive CTCs, triple-positive CTCs, and dual cytokeratin- and CD133-positive CTCs were independent predictors of tumor recurrence by logistic regression analysis and associated with decreased disease free survival (all, P≤0.03).
Conclusion
CTCs labeling with one or more markers of TICs are found in a majority of PDAC patients and are independently predictive of decreased disease free and overall survival.
Keywords: Pancreatic adenocarcinoma, circulating tumor cells, CTCs, aldehyde dehydrogenase, ALDH, CD133, CD44, tumor initiating cells
Introduction
Pancreatic ductal adenocarcinoma (PDAC) is the fourth leading cause of cancer-related mortality in the United States.(1) It is often a systemic disease, with over fifty percent of all patients having evidence of distant metastatic spread at the time of diagnosis.(2) Even after a potentially curative resection, almost eighty percent of patients will recur with distant disease.(3, 4) Current adjuvant or neoadjuvant therapies are administered with the intent to eradicate micro-metastatic disease and prevent systemic failures, but in reality these therapies result in only a modest improvement in survival compared to surgery alone.(5–7)
The origin of metastatic disease in pancreatic cancer is unknown, but based on data from other tumor types circulating tumor cells (CTCs) are a possible source. Circulating tumor cells are neoplastic cells shed from a cancer that enter circulation – CTCs have been identified in patients with various forms of cancer including PDAC.(8–11) Cancers are not homogeneous populations of identical cells but instead are complex mixtures of malignant cells with varying molecular and functional properties. As such, the subpopulations of malignant cells that reach the circulation likely have distinct properties when compared to the primary tumor as a whole. Therapies directed at the vulnerabilities of these unique circulating populations, rather than those that target all tumor cells, have the potential to specifically reduce the micro-metastatic burden. This creates an urgent need to improve our understanding of the unique features of PDAC CTCs and their role systemic failures.
Our laboratory has previously demonstrated that CTCs from PDAC are phenotypically heterogeneous and that these phenotypic differences can predict patient outcome.(12) Although these initial studies focused on epithelial and mesenchymal markers, other phenotypic properties may also have biological or clinical implications. One such phenotypic property is expression of markers of tumor initiating cells (TICs). Although the exact nature of so-called TICs remains controversial, many studies have demonstrated the presence of cell populations with varying ability to propagate and initiate tumors in model systems. These populations are usually defined based on the expression of specific proteins thought to serve as markers for these phenotypes. The cells with the greatest potential to initiate tumors in experimental settings have been dubbed TICs, as they function in the propagation of human tumors in vivo. As such, these phenotypically and functionally distinct cells are an area of intense investigation due to the potential relationship between these cells and tumor growth, metastasis, and drug resistance(13, 14)
CTCs expressing TIC markers have become an increasing area of focus in other tumor types. A study of CTCs in patients with breast cancer found that 69% of all CTCs expressed ALDH1, a putative TIC marker. In addition, non-responders to chemotherapy were more likely to have ALDH1-positive CTCs than ALDH1-negative CTCs.(15) Gastric cancer patients with CTCs expressing CD44, a marker commonly expressed on TICs, were more likely to develop disease recurrence and metastasis.(16) Furthermore, the mean time to recurrence was shorter in patients with CD44-positive CTCs (P=0.01). These and other studies suggest that some CTCs have TIC properties, and that this subset of cells may play an important role in tumor progression and metastasis.
Primary PDACs have been shown to express TIC markers.(14) A large study of patients with PDAC demonstrated that ALDH-expressing tumors had worse survival than patients whose tumors did not express ALDH.(17) This study also suggested that TICs in pancreatic cancer may play a role in the development of metastatic disease based on matched comparisons of primary and metastatic tumor tissue. A similar study of 96 patients with PDAC found that all of their primary tumors expressed the TIC markers CD44 and/or CD133 at some level.(18) However, patients whose cancers showed a high co-expression of CD44 and CD133 had a significantly shorter overall and disease-free survival. Another study identified TICs present in human pancreatic cancer tissue through the expression of CD133.(19) In addition, CD133+ cells, but not CD133− cells, gave rise to pancreatic tumors when injected into mice and a subpopulation of CD133+CXCR4+ cancer cells led to tumor metastases. Finally, CD44+CD24+ESA+ cells, identified as potential TICs, injected into the pancreata of mice were shown to form macroscopic tumors at 4 weeks, but no tumor formation occurred in mice injected with CD44−CD24−ESA− cells.(14) A recent study in a mouse model of PDAC used single-cell RNA sequencing identified CTCs that were enriched in the TIC markers Aldh1a1 and Aldh1a2.(20) Thus, CTCs in PDAC patients that express TIC markers could play an important role in metastasis.
The purpose of this study was to characterize circulating tumor cells in the blood of patients with PDAC using the TIC markers ALDH, CD133 and CD44. In addition, we assessed the relationship between CTCs expressing TIC markers and overall survival and tumor recurrence in PDAC patients.
Methods and Materials
Patient Selection
This study included sixty consecutive patients with PDAC treated with surgical resection at the Johns Hopkins Hospital between June 2013 and February 2015. Patients were included in this study only if written informed consent was given for collection of peripheral blood collection prior to surgical resection. Between 5 – 10 ml of venous blood was collected prior to surgical incision at the time of tumor resection by pancreaticoduodenectomy, distal pancreatectomy with splenectomy, or total pancreatectomy. In four patients, a venous sample could not be obtained and arterial blood was sampled instead. A complete chart review was performed on all sixty patients, and data regarding patient demographics, perioperative factors, tumor histopathology, surgical outcomes, survival, and neoadjuvant or adjuvant therapy were collected. A pathologist reviewed all resected tumors confirming the diagnosis of PDAC, and information including tumor stage, grade, nodal status, margin status, perineural and perivascular invasion was reported.
Patients were followed with routine post-operative visits every 3–6 months in the surgery clinic in addition to regular visits with a medical oncologist. Patients followed at the Johns Hopkins Hospital after surgery for adjuvant treatment underwent routine imaging with CT of the chest, abdomen and pelvis every 3 to 6 months to monitor for tumor recurrence, while patients receiving adjuvant chemotherapy and/or chemoradiation therapy at other institutions underwent imaging at similar intervals. Tumor recurrence was determined based upon the presence of clinically recognizable disease, either local or metastatic, on imaging. Patients underwent neoadjuvant or adjuvant chemotherapy or radiation based upon a decision made by the patient and medical oncologist. The treatment plan was independent of CTC results as the treating physicians were blinded to this information.
Circulating Tumor Cell Isolation
The Isolation by Size of Epithelial Tumor Cells (ISET) method (Rarecells, France) was utilized to process and filter blood samples in order to isolate CTCs. All blood samples were processed based on protocols previously described.(12, 21) In short, between 5–10 ml of peripheral blood was processed within 6 hours of collection. Isolation buffer was prepared by mixing three buffer samples with ultra-filtrated water and brought to a pH between 7.2 and 7.4 with 1M sodium hydroxide. Blood was mixed with isolation buffer and formaldehyde for ten minutes prior to filtration on the ISET machine, allowing for separation and isolation of blood component based upon size. After filtration, ISET samples were stored at −20 degrees Celsius until the time of analysis.
Immunohistochemistry of primary tumors
Immunohistochemistry with a commercially available aldehyde dehydrogenase antibody was performed on paraffin-embedded primary pancreatic cancer sections from each patient using the EnVision + Dual Link System-HRP by Dako (K4065). In short, paraffin embedded pancreatic cancer slides were placed for 30 seconds on a 60 degree Celsius heat block to deparaffinize the samples, prior to hydration with xylenes and increasing concentrations of ethanol. Samples were placed in a vegetable steamer with 1X antigen retrieval buffer (Dako) for thirty minutes. Cell membranes were permeabilized using 0.2% triton in 1X tris-buffered saline (TBS) for 5 minutes before washing with 1X TBS. Slides were incubated with dual endogenous enzyme block for 10 minutes in the dark. Tumor slides were incubated for 2 hours at room temperature with aldehyde dehydrogenase antibody (1:100, Clone 44, BD Biosciences) diluted in 1X TBS and 10% fetal bovine serum. Labeled polymer-HRP (horse radish peroxidase) was added to each slide and incubated for 30 minutes before removal and incubation for 10 minutes with chromogen substrate. All slides were counterstained with hematoxylin for 20 seconds prior to dehydration with increasing concentrations of ethanol and xylene before mounting.
A pathologist blinded to the results of the CTC analysis reviewed each tumor sample. Appropriate positive and negative control slides were tested as well to confirm accurate labeling with the above protocol. Samples were scored on a scale of overall labeling intensity of the neoplastic cells with negative, weak, moderate, or strong labeling. The extent of tumor labeling was also estimated by eye as the percent of the neoplastic cells with ALDH-expression from 0–100%. In samples with different areas of labeling intensity, the strongest expression of ALDH was recorded. Finally, labeled sections were additionally scored based upon a prior protocol put forth by Rasheed et al, which compares the intensity of ALDH-expression in the primary tumor to the expression in normal pancreas control tissue. Samples were scored as positive if the primary tumor expressed ALDH at a similar intensity as the normal pancreatic control tissue on the same slide.(17)
Immunofluorescence of CTCs
The identification of CTCs was performed by immunofluorescence with a previously published protocol utilizing commercially available primary conjugated antibodies.(12) In brief, ISET membranes were rehydrated with 1X TBS before permeabilization of cell membranes using 0.2% triton. Membranes were incubated in a 5% milk-based blocking buffer prior to incubation with conjugated antibodies to pan-cytokeratin (1:100, Bioss, alexa fluor 555) and ALDH (1:100, Bioss, FITC) diluted in the same blocking buffer. In addition, a separate incubation of each patient membrane was performed with conjugated antibodies to pan-cytokeratin (1:100, Bioss, alexa fluor 555), CD133 (1:100, Biorbyt, FITC) and CD44 (1:100, Abcam, alexa fluor 647). Membranes were washed and mounted on glass slides with DAPI (Life Sciences) before analysis under a fluorescence microscope. The entire membrane was manually viewed for CTCs under 20X magnification. All sections were observed under separate wavelengths to identify staining with DAPI, pan-cytokeratin, and ALDH and, additionally, DAPI, pan-cytokeratin, CD133 and CD44. Labeling was also observed under each wavelength on the Nikon NIS Elements imaging program (version 4.20.02-64-bit), corresponding to an exposure time of 600 milliseconds for DAPI, 1.0 second for pan-cytokeratin, 600–800 milliseconds for ALDH, 1.0 second for CD133, and 3.0 seconds for CD44. Epithelial CTCs were defined as cells with cytoplasmic labeling for cytokeratin with a diameter greater than 15 μm. In addition, these cells were analyzed for co-labeling with antibodies to ALDH, indicating a TIC phenotype. Only cells that co-labeled with antibodies to pan-cytokeratin and ALDH were scored for the first analysis, and photographs in each of the various wavelengths were taken of any cell that met criteria. In the second analysis, cells were scored based on the presence of cytokeratin alone, dual labeling with cytokeratin and CD133 without CD44, and labeling of all three antibodies (cytokeratin, CD133 and CD44).
Statistical Analysis
Summary statistics for the individual and CTC cohorts were presented as mean values with ranges for continuous variables and as percentages for categorical variables. Differences between patient cohorts were calculated by Fisher exact test, Wilcoxon rank sum tests, and t-tests. Overall survival (OS) was calculated from the date of surgery to the date of death or the date of last clinical follow-up, and was estimated using the Kaplan Meier method. Differences in OS between patient groups were tested using the log rank test and estimated from Cox proportional hazards models that adjusted for age and gender. The cumulative incidence of recurrence after surgery was estimated with death considered a competing risk event. Comparisons of time to recurrence between patient groups were summarized using proportional subdistribution hazards calculated using Fine and Gray’s method, adjusting for age and gender. Statistical analyses were performed using STATA Version 13.0 (StataCorp, College Station, TX) and R version 3.2.2 (R Core Team (2015)). Significance was defined as a P-value < 0.05.
IRB
This study was carried out with the approval of the Institutional Review Board at the Johns Hopkins Hospital.
Results
Patient demographics and tumor histopathology
All sixty patients in this study had histologically confirmed diagnosis of PDAC (Table 1). Patients had an average age of 64.6 years (range, 22–88 years) and were predominantly male (n=37, 62%). Pre-operative CA19-9 level was available for 46 patients, with an average value of 612 units/ml (range 0.6 – 9032). All patients underwent surgery for resection of their disease. The majority of patients underwent a pancreaticoduodenectomy for treatment of their cancer (n=44, 73%) with a minority of patients undergoing either a distal pancreatectomy with splenectomy (n=12, 20%) or total pancreatectomy (n=4, 7%). Patients were predominantly either stage I (20%) or stage II (76%) based upon TMN staging, with one patient (2%) having stage III borderline resectable disease.(22) One additional patient (2%) had metastatic disease at the time of surgery and underwent resection of both the primary tumor and a liver metastasis. Only 24 patients (40%) underwent neoadjuvant chemotherapy while a majority (n=52, 87%) received adjuvant chemotherapy with or without radiation therapy after surgery.
Table 1.
Patient Demographics, Tumor Clinicopathologic Features and Genetic Characteristics of Patients with Circulating Tumor Cells based upon ALDH staining
| Variable | All patients (n=60) (%) | ALDH-positive CTCs (n=46) | Absence of ALDH-positive CTCs (n=14) | P-Value |
|---|---|---|---|---|
|
| ||||
| Average Age (range) (years) | 64.6 (27–88) | 65.3 (27–88) | 63.4 (40–86) | 0.42 |
|
| ||||
| Gender | ||||
|
|
||||
| Male | 37 (62%) | 29 (63%) | 8 (57%) | 0.76 |
|
|
||||
| Female | 23 (38%) | 17 (37%) | 6 (24%) | |
|
| ||||
| Average CA19-9 | 612 (0.6–9032) | 711 (0.6–9032) | 242 (1–1031) | 0.16 |
|
| ||||
| CA 19-9 Level (n=46) | 0.43 | |||
|
|
||||
| High (> 36) | 28 (61%) | 23 (64%) | 5 (50%) | |
|
|
||||
| Low (< 36) | 18 (39%) | 13 (36%) | 5 (50%) | |
|
| ||||
| Surgical Resection | ||||
|
| ||||
| Whipple | 44 (73%) | 33 (72%) | 11 (79%) | 0.87 |
|
|
||||
| Distal pancreatectomy | 12 (20%) | 10 (22%) | 2 (14%) | |
|
|
||||
| Total pancreatectomy | 4 (7%) | 3 (6%) | 1 (7%) | |
|
| ||||
| Average Tumor Size (range) (cm) | 3.2 (0.1 – 8) | 3.2 (0.1–8) | 3.1 (0.1–6) | 0.85 |
|
| ||||
| Tumor Grade | ||||
|
|
||||
| Well | 3 (5%) | 3 (7%) | 0 (0%) | >0.99 |
|
|
||||
| Moderate | 31 (52%) | 23 (50%) | 8 (57%) | |
|
|
||||
| Poor | 25 (41%) | 19 (41%) | 6 (43%) | |
|
|
||||
| Not specified | 1 (2%) | 1 (2%) | 0 (0%) | |
|
| ||||
| Positive lymph nodes | 42 (70%) | 31 (67%) | 11 (79%) | 0.52 |
|
| ||||
| Positive margin | 12 (20%) | 9 (20%) | 3 (21%) | > 0.99 |
|
| ||||
| Stage | ||||
|
|
||||
| Stage I | 12 (20%) | 10 (22%) | 2 (14%) | 0.39 |
|
|
||||
| Stage II | 46 (76%) | 35 (76%) | 11 (79%) | |
|
|
||||
| Stage III | 1 (2%) | 0 (0%) | 1 (7%) | |
|
|
||||
| Stage IV | 1 (2%) | 1 (2%) | 0 (0%) | |
|
| ||||
| Perineural invasion | 47 (78%) | 36 (78%) | 11 (79%) | 0.99 |
|
| ||||
| Perivascular invasion | 40 (67%) | 31 (67%) | 9 (64%) | >0.99 |
|
| ||||
| Neoadjuvant Chemotherapy | 24 (40%) | 19 (41%) | 5 (36%) | 0.77 |
|
| ||||
| Adjuvant Chemotherapy | 52 (91%) | 40 (89%) | 12 (100%) | 0.57 |
|
| ||||
| Average Percent Cells Staining with ALDH | 50% (<5–100%) | 50% (<5–100%) | 60% (20–90%) | 0.59 |
|
| ||||
| Primary tumor ALDH Staining - Intensity | 0.55 | |||
|
|
||||
| Weak | 9 (15%) | 6 (13%) | 3 (21%) | |
|
|
||||
| Moderate | 34 (57%) | 27 (59%) | 7 (50%) | |
|
|
||||
| Strong | 17 (28%) | 13 (28%) | 4 (29%) | |
|
| ||||
| ALDH staining as intense as controls (n=57) | 0.52 | |||
|
|
||||
| Yes | 24 (42%) | 20 (45%) | 4 (31%) | |
|
|
||||
| No | 33 (58%) | 24 (55%) | 9 (69%) | |
Identification of ALDH-expressing cells in the tumor and blood
Primary pancreatic cancers from all sixty patients were analyzed with immunohistochemistry for ALDH (Supplemental figures 1A and 1B). These cancers were scored based on the intensity and distribution of labeling of the neoplastic cells with the ALDH antibody. All patients in this study had tumors that labeled with ALDH. The majority of patients had either moderate (57%) or strong (28%) staining, while only nine patients (15%) had weak staining. On average, 51% of the neoplastic cells labeled with the antibody to ALDH (range, <5% to 100%). Fifty-seven samples had appropriate normal pancreatic tissue that could be used as a control. In these patients, 24 (42%) had carcinomas with ALDH-expression as intense or more intense than the normal pancreatic tissue.
Circulating tumor cells isolated from blood from all sixty patients were first labeled with antibodies to cytokeratin and ALDH. Forty-six patients (77%) were found to have circulating tumor cells that were cytokeratin-positive and ALDH-positive, a previously reported TIC phenotype (Figure 1a, A–D).(17) The remaining patients (33%) did not have any CTCs as identified by ALDH and cytokeratin expression. The mean number of CTCs expressing both cytokeratin and ALDH was 7.1 CTC/ml blood (range, 1 – 54 CTC/ml blood) with a median number of 4 CTC/ml blood. Differences between patients with and without cytokeratin-positive, ALDH-positive CTCs are described in Table 1. There were no significant differences with regards to any patient or tumor characteristics, including age, tumor size, average CA19-9 level, lymph node status, margin status, grade, stage, or treatment with neoadjuvant or adjuvant therapies. In addition, there was no difference between the overall intensity of ALDH expression, the average percent of the tumor with ALDH expression, or patients with ALDH expression at least as intense as nearby normal pancreatic tissue (all, P>0.05).
Figure 1.
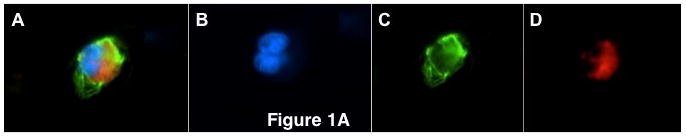


Figure 1a: Circulating tumor cells from pancreatic cancer patients demonstrating (A) pan-cytokeratin positive, ALDH-positive CTC (merge), (B) DAPI (blue), (C) aldehyde dehydrogenase (green), (D) pan-cytokeratin (red)
Figure 1b: Circulating tumor cells from pancreatic cancer patients demonstrating (A) pan-cytokeratin positive, CD133 positive, CD44 positive CTC (merge), (B) DAPI (blue), (C) CD133 (green), (D) pan-cytokeratin (red), (E) CD44 (pink)
Figure 1c: Circulating tumor cells from pancreatic cancer patients demonstrating (A) pan-cytokeratin positive, CD133 positive, CD44 negative CTC (merge), (B) DAPI (blue), (C) CD133 (green), (D) pan-cytokeratin (red), (E) CD44 (absence of pink)
Identification of CTCs expressing CD133 and CD44
Next, additional samples from all sixty patients were labeled with antibodies to cytokeratin, CD133, and CD44. Forty-five patients (75%) were found to have circulating tumor cells by the presence of one or more TIC markers, and all CTCs labeled for cytokeratin. Thirty-four (57%) patients had CTCs that labeled cytokeratin-positive, CD133-positive, and CD44-positive, constituting a previously reported TIC phenotype (Figure 1b, A–D).(18, 23) The mean number of CTCs labeling positive for cytokeratin, CD133 and CD44 was 2.1 CTC/ml blood (range, 1–4 CTC/ml blood) with median of 2 CTC/ml blood. In addition, there were 40 (67%) patients with CTCs that expressed cytokeratin and CD133, but were CD44-negative (Figure 1c, A–D).(24) The mean number of CTCs labeling positive for cytokeratin and CD133 without CD44 expression was 3.1 CTC/ml blood (range, 1–17 CTC/ml blood) with median of 2 CTC/ml blood. Although this exact pattern of expression has not been previously reported as a TIC phenotype, the strong expression of CD133 suggests that these CTCs also have TIC characteristics. No patients had CTCs that were cytokeratin-positive, CD44-positive, and CD133-negative. Seventeen (28%) patients had CTCs that were positive for only cytokeratin, including one patient where these were the only CTCs found in the blood. The other 16 patients with cytokeratin-only CTCs also had another subset of CTCs expressing cytokeratin and at least one TIC marker. Differences between patients with and without cytokeratin-positive, CD133-positive, CD44-positive CTCs are described in Table 2, and in Table 3 for patients with and without cytokeratin-positive, CD133-positive, CD44-negative CTCs. There were no significant differences with regards to any patient or tumor characteristics, including age, tumor size, average CA19-9 level, lymph node status, margin status, grade, stage, or treatment with neoadjuvant or adjuvant therapies, based on the presence or absence of CTCs staining with cytokeratin, CD133, and CD44 or cytokeratin and CD133 alone. Interesting, 37 of the 45 patients (82%) with CTCs had more than one type of CTC present in the blood including nine patients (20%) with all three phenotypes of CTC.
Table 2.
Patient Demographics, Tumor Clinicopathologic Features and Genetic Characteristics of Patients with Circulating Tumor Cells based upon staining with cytokeratin, CD133 and CD44.
| Variable | PanCK positive, CD133 positive, CD44 positive CTCs (n=34) | Absence of triple positive CTCs (n=26) | P-Value |
|---|---|---|---|
|
| |||
| Average Age (years) | 63.4 (27–83) | 66.3 (45–88) | 0.35 |
|
| |||
| Gender | 0.12 | ||
|
|
|||
| Male | 24 (71%) | 13 (50%) | |
|
|
|||
| Female | 10 (29%) | 13 (50%) | |
|
| |||
| Average CA19-9 | 896 (0.6–9032) | 219 (1–1031) | 0.11 |
|
| |||
| CA 19-9 Level (n=46) | 0.37 | ||
|
|
|||
| High (> 36) | 17 (68%) | 11 (52%) | |
|
|
|||
| Low (< 36) | 8 (32%) | 10 (48%) | |
|
| |||
| Surgical Resection | 0.90 | ||
|
|
|||
| Whipple | 26 (76%) | 18 (69%) | |
|
|
|||
| Distal pancreatectomy | 6 (18%) | 6 (23%) | |
|
|
|||
| Total pancreatectomy | 2 (6%) | 2 (8%) | |
|
| |||
| Average Tumor Size (cm) | 3.4 (1.8) | 2.9 (1.5) | 0.26 |
|
| |||
| Tumor Grade | 0.76 | ||
|
|
|||
| Well | 1 (3%) | 2 (8%) | |
|
|
|||
| Moderate | 18 (55%) | 13 (50%) | |
|
|
|||
| Poor | 14 (42%) | 11 (42%) | |
|
|
|||
| Not specified | |||
|
| |||
| Positive lymph nodes | 26 (76%) | 16 (62%) | 0.26 |
|
| |||
| Positive margin | 9 (26%) | 3 (12%) | 0.20 |
|
| |||
| Stage | 0.08 | ||
|
|
|||
| Stage I | 4 (12%) | 8 (31%) | |
|
|
|||
| Stage II | 29 (85%) | 17 (65%) | |
|
|
|||
| Stage III | 0 (0%) | 1 (4%) | |
|
|
|||
| Stage IV | 1 (3%) | 0 (0%) | |
|
| |||
| Perineural invasion | 28 (82%) | 19 (73%) | 0.53 |
|
| |||
| Perivascular invasion | 26 (76%) | 14 (54%) | 0.10 |
|
| |||
| Neoadjuvant Chemotherapy | 13 (38%) | 11 (42%) | 0.80 |
|
| |||
| Adjuvant Chemotherapy (n=57) | 30 (91%) | 22 (92%) | > 0.99 |
Table 3.
Patient Demographics, Tumor Clinicopathologic Features and Genetic Characteristics of Patients with Circulating Tumor Cells based upon staining with cytokeratin and CD133.
| Variable | PanCK positive, CD133 positive, CD44 negative CTCs (n=40) | Absence of PanCK positive, CD133 positive, CD44 negative CTCs (n=20) | P-Value |
|---|---|---|---|
|
| |||
| Average Age (years) | 65 (27–85) | 64 (40–88) | 0.76 |
|
| |||
| Gender | 0.26 | ||
|
|
|||
| Male | 27 (68%) | 10 (50%) | |
|
|
|||
| Female | 13 (32%) | 10 (50%) | |
|
| |||
| Average CA19-9 | 483 (0.6–3758) | 946 (1–9032) | 0.55 |
|
| |||
| CA 19-9 Level (n=46) | 0.35 | ||
|
|
|||
| High (> 36) | 21 (66%) | 7 (50%) | |
|
|
|||
| Low (< 36) | 11 (34%) | 7 (50%) | |
|
| |||
| Surgical Resection | 0.64 | ||
|
|
|||
| Whipple | 29 (73%) | 15 (75%) | |
|
|
|||
| Distal pancreatectomy | 9 (22%) | 3 (15%) | |
|
|
|||
| Total pancreatectomy | 2 (5%) | 2 (10%) | |
|
| |||
| Average Tumor Size (cm) | 3.2 (1.7) | 3.3 (1.7) | 0.81 |
|
| |||
| Tumor Grade | 0.90 | ||
|
|
|||
| Well | 2 (5%) | 1 (5%) | |
|
|
|||
| Moderate | 21 (54%) | 10 (50%) | |
|
|
|||
| Poor | 16 (41%) | 9 (45%) | |
|
|
|||
| Not specified | |||
|
| |||
| Positive lymph nodes | 28 (70%) | 14 (70%) | >0.99 |
|
| |||
| Positive margin | 8 (20%) | 4 (20%) | >0.99 |
|
| |||
| Stage | 0.69 | ||
|
|
|||
| Stage I | 8 (20%) | 4 (20%) | |
|
|
|||
| Stage II | 31 (78%) | 15 (75%) | |
|
|
|||
| Stage III | 0 (0%) | 1 (5%) | |
|
|
|||
| Stage IV | 1 (2%) | 0 (0%) | |
|
| |||
| Perineural invasion | 31 (78%) | 16 (80%) | 0.99 |
|
| |||
| Perivascular invasion | 27 (68%) | 13 (65%) | 0.99 |
|
| |||
| Neoadjuvant Chemotherapy | 15 (38%) | 9 (45%) | 0.59 |
|
| |||
| Adjuvant Chemotherapy | 35 (88%) | 17 (100%) | 0.31 |
Overall, 47 patients (78%) were found to have CTCs by one or both analyses, and 44 (94%) of these 47 patients with CTCs had cells found on both analyses. One patient had cells that stained with cytokeratin, CD133 and CD44 but did not have CTCs expressing ALDH, while two patients had cytokeratin-positive, ALDH-positive but no CTCs staining with CD133 or CD44. The remaining patients (25%) did not have any CTCs as identified by cytokeratin, CD133, and/or CD44 expression. Of the patients who underwent staining for cytokeratin, CD133, and CD44, 44 of 45 (98%) patients with CTC had at least one cell that stained for one or both TIC markers. The average and median number of cells that stained with CD133 and/or CD44 compared to the total number of CTCs found was 87.4% and 100%, respectively (range 44%–100%).
Disease-Free and Overall Survival Analysis
At the time of this analysis, 26 (44%) of 59 patients were noted to have either local or distant tumor recurrence. This excluded the one patient who had metastatic disease at the time of surgical resection. The identification of CTCs positive for all three markers (cytokeratin, CD133, and CD44) was associated with higher risk of tumor recurrence compared to patients without these CTCs during the study period (Hazard Ratio 6.4; 95% Confidence Interval 2.1–19.6; P<0.01) by Fine and Grey’s model. In addition, CTCs positive for cytokeratin and CD133 without CD44 expression were also associated with a higher risk of recurrence compared to those patients without these specific CTCs (HR 3.2; 95%CI 1.22–8.6; P=0.02) (Table 4). Median disease free survival (DFS) by Kaplan-Meier analysis was 9.3 months in patients with triple positive CTCs (cytokeratin, CD133, and CD44) compared to 19.8 months in patients without these CTCs (P=0.001). Median DFS was 9.5 months in patients with cytokeratin-positive, CD133-positive, CD44-negative CTCs compared to 23.4 months in patients without these CTCs (P=0.03). Cytokeratin-positive, ALDH-positive CTCs were also associated with tumor recurrence (HR 3.37; 95%CI 1.16–9.76; P=0.03), and remained significant even when accounting for other factors associated with recurrence by multivariate analysis. Median DFS by Kaplan-Meier analysis was 9.7 months in patients with cytokeratin-positive, ALDH-positive CTCs while median DFS was not yet reached in patients without these CTCs (P=0.03). However, cytokeratin-only positive CTCs were not associated with an increased risk of tumor recurrence in this study population (HR 0.8; 95% CI 0.32–2.0; P=0.64). An analysis comparing the number of each CTC phenotype to tumor recurrence found that increasing number of CTCs was associated with an increased risk of tumor recurrence only for the triple positive (pan-cytokeratin, CD133, CD44) phenotype (P=0.01). However, this finding is a result of the fact that of the 26 patients with recurrence, only four occurred in patients without any triple positive CTCs. In addition, a subgroups analysis was performed to test for an interaction between each CTC phenotype and CA19-9 level (low or high) on tumor recurrence. There was no indication that CA19-9 level modifies the association between recurrence and CTCs expressing a stem cell phenotype (interaction P>0.05, all). Finally, CA19-9 level was not associated with recurrence, even when accounting for jaundice by total bilirubin level in the model (HR 1.33, 95%CI 0.54, 3.28; P=0.54).
Table 4.
Cumulative incidence of tumor recurrence accounting for death as a competing risk, with hazard ratio adjusted for patient age and gender
| Variable | Hazard Ratio | 95% Confidence Interval | p-value |
|---|---|---|---|
|
| |||
| ALDH-positive CTC | 3.4 | 1.16, 9.76 | 0.03 |
|
| |||
| Number of cells: ALDH positive CTC | 1.00 | 0.94, 1.06 | 0.93 |
|
| |||
| Cytokeratin-positive only CTC | 0.8 | 0.32, 2 | 0.64 |
|
| |||
| Number of cells: PanCK+ only | 1.18 | 0.83, 1.68 | 0.36 |
|
| |||
| Triple Positive (cytokeratin, CD133, CD44) CTC | 6.45 | 2.12, 19.65 | < 0.01 |
|
| |||
| Number of cells: Triple positive | 1.76 | 1.16, 2.65 | 0.01 |
|
| |||
| Cytokeratin-positive, CD133 positive CTC | 3.24 | 1.22, 8.62 | 0.02 |
|
| |||
| Number of cells: PanCK+/CD133+ | 0.98 | 0.78, 1.21 | 0.83 |
|
| |||
| Positive Lymph Nodes | 3.4 | 1.15, 10.0 | 0.03 |
|
| |||
| Perivascular Invasion | 2.33 | 0.98, 5.56 | 0.06 |
|
| |||
| ALDH Stain | |||
|
| |||
| Weak | Ref | Ref | Ref |
|
|
|||
| Moderate | 1.01 | 0.45, 2.28 | 0.98 |
|
|
|||
| Strong | 0.997 | 0.35, 2.7 | 0.96 |
|
| |||
| ALDH as intense as controls | 0.69 | 0.3, 1.59 | 0.39 |
|
| |||
| Total bilirubin level | 1.33 | ||
|
| |||
| Positive Margin | 1.6 | 0.65, 3.97 | 0.31 |
|
| |||
| Tumor Grade | |||
|
| |||
| Well/Moderate | Ref | Ref | Ref |
|
|
|||
| Poor | 1.5 | 0.72, 3.3 | 0.27 |
|
| |||
| Perineural Invasion | 2.6 | 0.9, 7.6 | 0.08 |
|
| |||
| Tumor > 3 cm | 1.5 | 0.69, 3.22 | 0.31 |
|
| |||
| Neoadjuvant Chemo | 1.6 | 0.74, 3.4 | 0.23 |
|
| |||
| Adjuvant Chemo | 1.58 | 0.24, 10.55 | 0.63 |
Median overall survival for the entire cohort of patients was 20.2 months. Differences in overall survival were estimated from Cox proportional hazard models adjusted for age and gender to determine factors that were associated with decreased survival in this patient cohort (Table 5). The presence of triple positive (cytokeratin, CD133, and CD44) CTCs were significantly associated with survival (P<0.01) as was the presence of any CTC (P=0.01). However, the presence of only cytokeratin-positive CTCs was not associated with survival (P=0.34), while the presence of cytokeratin-positive, CD133-positive, CD44-negative CTCs trended towards worse survival (P=0.055). An additional analysis showed the presence of cytokeratin-positive, ALDH-positive CTCs was significantly associated with worse survival (P<0.01). However, neither the overall intensity (P=0.62) nor intensity compared to normal pancreatic control tissue (P=0.80) of ALDH expression of the primary tumor was associated with survival. An analysis comparing the number of each CTC phenotype to overall survival found that increasing number of CTCs was associated with poor OS only for the triple positive (pan-cytokeratin, CD133, CD44) phenotype (P=0.02). This finding is a result of the fact that none of the patients without triple positive CTCs were deceased at the time of the analysis. In addition, of the other factors included in this analysis, only the presence of positive surgical margins (P=0.002) or perivascular invasion (P=0.01) was associated with poor survival (P=0.002). There was no association between survival and other patient or tumor demographics, including the presence of positive lymph nodes, tumor grade, tumor size, or neoadjuvant chemotherapy (all, P>0.05). In addition, CA 19-9 level was not associated with survival, even when total bilirubin level was included in the model (HR 1.37 [0.34, 5.8], P=0.65). A multivariate analysis was then performed, and the presence of cytokeratin-positive, ALDH-positive CTCs and cytokeratin-positive, CD133-positive, CD44-positive CTCs remained significantly associated with poor survival even when accounting for positive surgical margin (both P<0.05). In addition, a subgroups analysis was performed to test for an interaction between each CTC phenotype and CA19-9 level (low or high) on overall survival. There was no indication that CA19-9 level modifies the association between OS and CTCs expressing a stem cell phenotype (interaction P>0.05, all).
Table 5.
Factors associated with Overall Survival by Cox-Mantel Analysis, adjusted for patient gender and age
| Survival Factor | Median OS (months) | Hazard Ratio (HR) | 95% Confidence Interval | p-value |
|---|---|---|---|---|
|
| ||||
| PanCK+/ALDH+ CTCs | ||||
|
|
||||
| Present | 17.5 | -- | -- | 0.004 |
|
|
||||
| Absent | NR | |||
|
| ||||
| Number of cells: ALDH+ | 0.98 | 0.94, 1.02 | 0.29 | |
|
| ||||
| PanCK+ only CTC | ||||
|
|
||||
| Present | 16.2 | 1.4 | 0.48, 3.99 | 0.34 |
|
|
||||
| Absent | 22.8 | |||
|
| ||||
| Number of cells: PanCK+ only | 0.94 | 0.72, 1.23 | 0.66 | |
|
| ||||
| PanCK+/CD133+/ CD44+ CTC | ||||
|
|
||||
| Present | 16.3 | -- | -- | <0.0001 |
|
|
||||
| Absent | NR | |||
|
| ||||
| Number of cells: Triple positive | 1.51 | 1.07, 2.13 | 0.02 | |
|
| ||||
| PanCK+/CD133+/ CD44- CTC | ||||
|
|
||||
| Present | 17.5 | 4.3 | 0.55, 33.6 | 0.055 |
|
|
||||
| Absent | NR | |||
|
| ||||
| Number of cells: PanCK+/CD133+ | 0.97 | 0.87, 1.08 | 0.60 | |
|
| ||||
| ALDH intensity compared to controls | ||||
|
|
||||
| Yes | 22.8 | 0.51 | 0.16, 1.59 | 0.80 |
|
|
||||
| No | 20.2 | |||
|
| ||||
| ALDH overall stain | ||||
|
|
||||
| Weak | NR | Ref | -- | 0.62 |
|
|
||||
| Moderate | 16.4 | 0.96 | 0.32, 2.84 | |
|
|
||||
| Strong | 22.8 | 0.34 | 0.04, 2.92 | |
|
| ||||
| CA19-9 | ||||
|
|
||||
| ≥ 36 U/ml | 20.1 | 1.83 | 0.5, 6.74 | 0.24 |
|
|
||||
| < 36 U/ml | NR | |||
|
| ||||
| Tumor Size | ||||
|
|
||||
| ≥ 3 cm | 20.1 | 1.74 | 0.59, 5.17 | 0.33 |
|
|
||||
| < 3 cm | 17.5 | |||
|
| ||||
| Positive LN | ||||
|
|
||||
| Yes | 17.5 | 2.5 | 0.53, 11.76 | 0.28 |
|
|
||||
| No | NR | |||
|
| ||||
| Positive Margin | ||||
|
|
||||
| Yes | 10.4 | 5.4 | 1.63, 17.94 | 0.002 |
|
|
||||
| No | NR | |||
|
| ||||
| Tumor Grade | ||||
|
|
||||
| Well/Moderate | NR | 1.9 | 0.64, 5.9 | 0.38 |
|
|
||||
| Poor | 16.3 | |||
|
| ||||
| Tumor Stage | ||||
|
|
||||
| Stage I | NR | 4.0 | 0.5, 32.7 | 0.39 |
|
|
||||
| Stage II to IV | 17.5 | |||
|
| ||||
| Perineural invasion | ||||
|
|
||||
| Yes | 20.2 | 2.4 | 0.5, 11.2 | 0.49 |
|
|
||||
| No | NR | |||
|
| ||||
| Perivascular invasion | ||||
|
|
||||
| Yes | 17.5 | 8.1 | 1.06, 62.2 | 0.01 |
|
|
||||
| No | NR | |||
|
| ||||
| Neoadjuvant chemotherapy | ||||
|
|
||||
| Yes | 16.4 | 0.87 | 0.3, 2.56 | 0.63 |
|
|
||||
| No | 20.2 | |||
|
| ||||
| Adjuvant chemotherapy | ||||
|
|
||||
| Yes | 20.2 | 0.84 | 0.17, 4.3 | 0.59 |
|
|
||||
| No | NR | |||
Discussion
Pancreatic adenocarcinoma carries a poor prognosis even among patients with clinically localized disease who undergo a potentially curative resection. More than 80% of these patients will recur with distant disease.(25) This creates an urgent need to understand the cells of origin of systemic failures. As CTCs are a potential source of systemic recurrence, a more thorough understanding of CTCs in a highly systemic disease like PDAC could lead to new prognostic markers or therapeutic strategies. Since the majority of treatment failures following surgical resection are systemic, therapies targeted toward CTC populations could reduce metastatic recurrence and improve survival. The first step in realizing the clinical potential of CTCs is to classify these cells along the lines of cell types already know to play a role in cancers. Previous studies have demonstrated the presence of neoplastic cells expressing TIC markers in both the primary tumor and CTCs for several different cancers.(14–17) Previous research from our laboratory has identified subsets of CTCs with epithelial and mesenchymal characteristics, with unique relationships to outcome.(12) The current study further analyzes CTCs in PDAC by identifying cells with a TIC phenotype and determining their effect on patient outcomes.
CTCs expressing the TIC markers ALDH, CD133 and CD44 were found in a subset of the patients studied. Furthermore, cells labeling with either ALDH or dual labeling with CD133 and CD44, in the presence of cytokeratin, were significantly associated both with tumor recurrence and poor prognosis. Thus, these CTCs may be a biomarker to pre-operatively identify patients at higher risk for tumor recurrence who would thus benefit from more aggressive systemic therapy prior to surgery. However, in our study, only one patient had only CTCs that did not express markers of TICs, eliminating our ability to directly compare clinical outcomes in patients with CTCs with and without markers of TICs. Although the presence of CTCs without circulating TICs (CTCs that only expressed cytokeratin) was not correlated with survival or recurrence, our study does not definitively show whether the presence tumor initiating CTCs, rather than the presence any CTCs, is the true clinical correlate. Furthermore, while an increasing number of triple positive CTCs appeared to be predictive of worse OS and tumor recurrence, this finding is impacted by the few patients without these cells that had tumor recurrence or were deceased at the time of analysis. Thus, it appears that the presence or absence of each CTC phenotype is a better prognostic predictor than the number of CTCs present.
As with prior research on CTCs in PDAC, this study demonstrated that there were no patient or tumor characteristics that accurately predicted the presence or absence of CTCs with TIC markers.(12) In particular, patients with CTCs with TIC markers were not more likely to have larger tumors, positive lymph nodes, higher tumor grade, or higher CA19-9 levels compared to patients without CTCs. This is important, as these factors typically are associated with poor prognosis. Notably, patients in both cohorts had elevated CA19-9 levels at the time of surgery. This is often reflective of the advanced tumors that are treated at this institution, despite the majority of patients included having stage I or II diseases. However, even despite elevated CA19-9 levels with or without additional therapy, all patients had tumors that were resectable and were thus considered eligible for surgery.
Our data raise the intriguing possibility that these circulating TICs are a direct source of recurrence and metastasis. However, while the presence of CTCs with TIC markers was associated with tumor recurrence, this does not conclusively demonstrate that these cells are the “tumor initiating cells” responsible for distant metastasis. Additional studies to map subclones of neoplastic cells in the primary tumor, circulation, and distant metastases will be required to convincingly demonstrate a connection between CTCs and the formation of metastatic disease.
The majority of CTCs in each patient expressed one or more TIC marker when compared to the total number of CTCs present. Of the 47 patients in this study who were found to have CTCs, all but one patient had one or more CTCs that labeled for CD133 and/or CD44. In addition, the average proportion of CTCs labeling for at least one of these TIC markers was 87.4%. Furthermore, all but one of these patients had more than half of all CTCs staining for at least one TIC marker (CD133 and/or CD44). This is an interesting finding, as previous studies have shown that only a small proportion of the cancer cells in the primary pancreatic tumor express TIC markers such as CD44 or CD133. Studies in other cancer types, including ovarian and prostate cancers, have similarly shown expression of TIC markers in only a minority of cells in the primary tumor, although data are notably lacking for many tumor types. (26, 27) These data suggest an increased propensity for cancer cells with a TIC phenotype to be shed into or survive in the blood stream, despite comprising a relatively low percentage of the total cancer cell population. The presence of CTCs with a TIC phenotype in the majority of PDAC patients, even those with surgically resectable disease, may also contribute to the high rate of pancreatic cancer metastasis even after surgery and chemotherapy. However, characterization of these CTC populations in other tumor types will be required to more thoroughly address this hypothesis.
Staining of the primary tumor demonstrated a lack of association between ALDH intensity or distribution in the primary tumor and the presence of cytokeratin-positive, ALDH-positive CTCs. In addition, using the scoring system previously put forth by Rasheed et al, patients with ALDH-expression at least as intense as normal pancreatic cells were not more likely to have ALDH-positive CTCs. Given that all patients included in this study had pancreatic cancers that expressed ALDH at some level, this indicates that analysis of the primary tumor alone is not sufficient to predict the presence or absence of ALDH-positive CTCs. Moreover, because the primary tumors of all patients contained ALDH-expressing cells, the factors allowing these cells to enter and survive in the circulation of some patients but not others remain to be elucidated. Of note, unlike a prior study comparing staining of pancreatic tumors with ALDH, no survival difference was seen based upon the total percentage or intensity of ALDH labeling.(17) Thus, analysis of the primary tumor alone may be insufficient to predict poor survival related to ALDH expression. However, it is important to note that our study included fewer patients than were analyzed in the original study, possibly contributing to the differences noted.
This study demonstrates that the primary carcinomas of all patients show at least some level of ALDH expression – similar findings have been reported for CD133 and CD44 in primary PDACs.(18) Our findings raise the possibility that these TICs may enter the circulation and become a source of tumor recurrence and/or metastasis, potentially contributing to the high percentage of patients who ultimately develop tumor progression. However, the factors that promote entrance and survival of these cells in the circulation in only a subset of patients remain to be identified. Similar studies in other forms of cancer have demonstrated a relationship between tumor cells expressing TIC markers and poor outcomes, perhaps suggesting that this role of TICs is not limited to pancreatic cancer.(27),(28) If future studies can demonstrate the relationship between the TICs in the primary pancreatic tumor, circulation, and distant metastases, circulating TICs could be a potential target for therapies to prevent metastatic progression altogether.
This study identifies several interesting features of CTCs in patients with PDAC, but it has several limitations impacting its immediate clinical applicability. First, our study was limited to patients who had resectable tumors and consented to a pre-surgical blood draw. As such, only sixty patients could be included in this study with adequate follow-up to determine the relationship to recurrence or survival. Further study in a large number of patients, including patients with non-adenocarcinoma disease of the pancreas, will be needed to confirm these results before any clinical application. In addition, patient blood samples were only collected prior to surgical resection, and as such only one time point was analyzed for the presence of CTCs with TIC markers. Future studies will focus on collection of blood samples at several times points through the clinical course, such as both before and after surgical resection or chemotherapy. Such samples will allow us to determine how the number and phenotype of CTCs in PDAC change over time and in response to therapy. Until further studies can be performed in a larger patient cohort and in blood samples over time, the use of CTCs with TIC markers in clinical decision-making is limited.
In conclusion, CTCs expressing cytokeratin and TIC markers, including ALDH, CD133, and CD44, were identified in patients with PDAC. These TIC-like CTCs were associated with poor prognosis after surgical resection and with an increased incidence of tumor recurrence. While further studies in a larger population are needed to further demonstrate the clinical significance of these cells, these results suggest a potential method for pre-operative stratification of patients at high risk of metastasis who could benefit from more aggressive systemic therapies. Moreover, the presence of CTCs with a TIC phenotype suggests a possible mechanism for metastatic spread which could be useful in the development of novel therapies to prevent progression of pancreatic cancer.
Supplementary Material
Statement of Translational Relevance.
This study furthers the understanding of circulating tumor cells in pancreatic adenocarcinoma by identifying CTCs expressing tumor initiating cell markers, including ALDH, CD133 and CD44. At this time, it is difficult to identify which patients may benefit from systemic therapy prior to or after tumor resection, and our research demonstrates the potential use of CTCs for patient stratification of treatment for those at highest risk of recurrence. The presence of CTCs labeling with antibodies to both ALDH and cytokeratin, or with cytokeratin, CD133 and CD44 were associated with a higher likelihood of tumor recurrence and poorer survival, indicating a possible use for patient stratification for neoadjuvant chemotherapy. Moreover, the presence of CTCs with a tumor initiating cell phenotype may help to broaden the understanding of tumor metastasis and, therefore, be a potential target for therapies after resection.
Acknowledgments
FUNDING: Funding for this study was provided by NIH grants CA126607-06A1 and CA62924, the Sol Goldman Pancreatic Cancer Research Grant, the Buffone Family Gastrointestinal Cancer Research Fund, the Kaya Tuncer Career Development Award in GI Cancer Prevention, the AGA-Bernard Lee Schwartz Research Scholar Award in Pancreatic Cancer, the Sidney Kimmel Foundation for Cancer Research, Sigma Beta Sorority, Joseph C. Monastra Foundation, Rolfe Pancreatic Cancer Foundation, Gerald O Mann Charitable Foundation (Harriet and Allan Wulfstat, Trustees), Tampa Bay Fisheries Inc.
We would like to thank Dr. Ralph H. Hruban in the Department of Pathology for his critical reading of this manuscript.
Footnotes
DISCLOSURE: The authors of this manuscript have no potential conflicts of interest to declare.
AUTHORSHIP CONTRIBUTIONS: All authors contributed to this manuscript, including conception and design (KEP, ZAR, LDW, CLW), acquisition of data (KEP, LDW), analysis and interpretation of data (KEP, AB), material support (MJW, JLC, CLW), study supervision (MG, LDW, CLW), and writing, review and revision of the manuscript (KEP, AB, MJW, JLC, CLW, MG, ZAR, LDW, CLW).
References
- 1.Siegel RL, Miller KD, Jemal A. Cancer statistics, 2015. CA: a cancer journal for clinicians. 2015;65:5–29. doi: 10.3322/caac.21254. [DOI] [PubMed] [Google Scholar]
- 2.Shaib YH, Davila JA, El-Serag HB. The epidemiology of pancreatic cancer in the United States: changes below the surface. Alimentary pharmacology & therapeutics. 2006;24:87–94. doi: 10.1111/j.1365-2036.2006.02961.x. [DOI] [PubMed] [Google Scholar]
- 3.Hishinuma S, Ogata Y, Tomikawa M, Ozawa I, Hirabayashi K, Igarashi S. Patterns of recurrence after curative resection of pancreatic cancer, based on autopsy findings. Journal of gastrointestinal surgery : official journal of the Society for Surgery of the Alimentary Tract. 2006;10:511–8. doi: 10.1016/j.gassur.2005.09.016. [DOI] [PubMed] [Google Scholar]
- 4.Sperti C, Pasquali C, Piccoli A, Pedrazzoli S. Recurrence after resection for ductal adenocarcinoma of the pancreas. World journal of surgery. 1997;21:195–200. doi: 10.1007/s002689900215. [DOI] [PubMed] [Google Scholar]
- 5.Oettle H, Neuhaus P, Hochhaus A, Hartmann JT, Gellert K, Ridwelski K, et al. Adjuvant chemotherapy with gemcitabine and long-term outcomes among patients with resected pancreatic cancer: the CONKO-001 randomized trial. Jama. 2013;310:1473–81. doi: 10.1001/jama.2013.279201. [DOI] [PubMed] [Google Scholar]
- 6.Neoptolemos JP, Stocken DD, Friess H, Bassi C, Dunn JA, Hickey H, et al. A randomized trial of chemoradiotherapy and chemotherapy after resection of pancreatic cancer. The New England journal of medicine. 2004;350:1200–10. doi: 10.1056/NEJMoa032295. [DOI] [PubMed] [Google Scholar]
- 7.Kalser MH, Ellenberg SS. Pancreatic cancer. Adjuvant combined radiation and chemotherapy following curative resection. Archives of surgery. 1985;120:899–903. doi: 10.1001/archsurg.1985.01390320023003. [DOI] [PubMed] [Google Scholar]
- 8.Chausovsky G, Luchansky M, Figer A, Shapira J, Gottfried M, Novis B, et al. Expression of cytokeratin 20 in the blood of patients with disseminated carcinoma of the pancreas, colon, stomach, and lung. Cancer. 1999;86:2398–405. [PubMed] [Google Scholar]
- 9.Nagrath S, Sequist LV, Maheswaran S, Bell DW, Irimia D, Ulkus L, et al. Isolation of rare circulating tumour cells in cancer patients by microchip technology. Nature. 2007;450:1235–9. doi: 10.1038/nature06385. [DOI] [PMC free article] [PubMed] [Google Scholar]
- 10.Kurihara T, Itoi T, Sofuni A, Itokawa F, Tsuchiya T, Tsuji S, et al. Detection of circulating tumor cells in patients with pancreatic cancer: a preliminary result. Journal of hepato-biliary-pancreatic surgery. 2008;15:189–95. doi: 10.1007/s00534-007-1250-5. [DOI] [PubMed] [Google Scholar]
- 11.Tjensvoll K, Nordgard O, Smaaland R. Circulating tumor cells in pancreatic cancer patients: methods of detection and clinical implications. International journal of cancer Journal international du cancer. 2014;134:1–8. doi: 10.1002/ijc.28134. [DOI] [PubMed] [Google Scholar]
- 12.Poruk KE, Valero V, 3rd, Saunders T, Blackford AL, Griffin JF, Poling J, et al. Circulating Tumor Cell Phenotype Predicts Recurrence and Survival in Pancreatic Adenocarcinoma. Annals of surgery. 2016 doi: 10.1097/SLA.0000000000001600. [DOI] [PMC free article] [PubMed] [Google Scholar]
- 13.Rasheed ZA, Kowalski J, Smith BD, Matsui W. Concise review: Emerging concepts in clinical targeting of cancer stem cells. Stem Cells. 2011;29:883–7. doi: 10.1002/stem.648. [DOI] [PMC free article] [PubMed] [Google Scholar]
- 14.Li C, Heidt DG, Dalerba P, Burant CF, Zhang L, Adsay V, et al. Identification of pancreatic cancer stem cells. Cancer Res. 2007;67:1030–7. doi: 10.1158/0008-5472.CAN-06-2030. [DOI] [PubMed] [Google Scholar]
- 15.Aktas B, Tewes M, Fehm T, Hauch S, Kimmig R, Kasimir-Bauer S. Stem cell and epithelial-mesenchymal transition markers are frequently overexpressed in circulating tumor cells of metastatic breast cancer patients. Breast cancer research : BCR. 2009;11:R46. doi: 10.1186/bcr2333. [DOI] [PMC free article] [PubMed] [Google Scholar]
- 16.Li M, Zhang B, Zhang Z, Liu X, Qi X, Zhao J, et al. Stem cell-like circulating tumor cells indicate poor prognosis in gastric cancer. Biomed Res Int. 2014;2014:981261. doi: 10.1155/2014/981261. [DOI] [PMC free article] [PubMed] [Google Scholar]
- 17.Rasheed ZA, Yang J, Wang Q, Kowalski J, Freed I, Murter C, et al. Prognostic significance of tumorigenic cells with mesenchymal features in pancreatic adenocarcinoma. J Natl Cancer Inst. 2010;102:340–51. doi: 10.1093/jnci/djp535. [DOI] [PMC free article] [PubMed] [Google Scholar]
- 18.Hou YC, Chao YJ, Tung HL, Wang HC, Shan YS. Coexpression of CD44-positive/CD133-positive cancer stem cells and CD204-positive tumor-associated macrophages is a predictor of survival in pancreatic ductal adenocarcinoma. Cancer. 2014;120:2766–77. doi: 10.1002/cncr.28774. [DOI] [PMC free article] [PubMed] [Google Scholar]
- 19.Hermann PC, Huber SL, Herrler T, Aicher A, Ellwart JW, Guba M, et al. Distinct populations of cancer stem cells determine tumor growth and metastatic activity in human pancreatic cancer. Cell Stem Cell. 2007;1:313–23. doi: 10.1016/j.stem.2007.06.002. [DOI] [PubMed] [Google Scholar]
- 20.Ting DT, Wittner BS, Ligorio M, Vincent Jordan N, Shah AM, Miyamoto DT, et al. Single-cell RNA sequencing identifies extracellular matrix gene expression by pancreatic circulating tumor cells. Cell reports. 2014;8:1905–18. doi: 10.1016/j.celrep.2014.08.029. [DOI] [PMC free article] [PubMed] [Google Scholar]
- 21.Vona G, Sabile A, Louha M, Sitruk V, Romana S, Schutze K, et al. Isolation by size of epithelial tumor cells : a new method for the immunomorphological and molecular characterization of circulatingtumor cells. Am J Pathol. 2000;156:57–63. doi: 10.1016/S0002-9440(10)64706-2. [DOI] [PMC free article] [PubMed] [Google Scholar]
- 22.Cancer AJCo. AJCC Cancer Staging Manual. New York, NY: Springer; Exocrine and Endocrine Pancreas; pp. 241–6. [Google Scholar]
- 23.Sahlberg SH, Spiegelberg D, Glimelius B, Stenerlow B, Nestor M. Evaluation of cancer stem cell markers CD133, CD44, CD24: association with AKT isoforms and radiation resistance in colon cancer cells. PLoS One. 2014;9:e94621. doi: 10.1371/journal.pone.0094621. [DOI] [PMC free article] [PubMed] [Google Scholar]
- 24.Wang C, Xie J, Guo J, Manning HC, Gore JC, Guo N. Evaluation of CD44 and CD133 as cancer stem cell markers for colorectal cancer. Oncol Rep. 2012;28:1301–8. doi: 10.3892/or.2012.1951. [DOI] [PMC free article] [PubMed] [Google Scholar]
- 25.Kleeff J, Reiser C, Hinz U, Bachmann J, Debus J, Jaeger D, et al. Surgery for recurrent pancreatic ductal adenocarcinoma. Ann Surg. 2007;245:566–72. doi: 10.1097/01.sla.0000245845.06772.7d. [DOI] [PMC free article] [PubMed] [Google Scholar]
- 26.Di J, Yigit R, Figdor C, de Boer T, Massuger L, Torensma R. Expression Compilation of Several Putative Cancer Stem Cell Markers by Primary Ovarian Carcinoma. Journal of Cancer Therapy. 2010;1:165–73. [Google Scholar]
- 27.Li T, Su Y, Mei Y, Leng Q, Leng B, Liu Z, et al. ALDH1A1 is a marker for malignant prostate stem cells and predictor of prostate cancer patients’ outcome. Lab Invest. 2010;90:234–44. doi: 10.1038/labinvest.2009.127. [DOI] [PMC free article] [PubMed] [Google Scholar]
- 28.Abraham BK, Fritz P, McClellan M, Hauptvogel P, Athelogou M, Brauch H. Prevalence of CD44+/CD24-/low cells in breast cancer may not be associated with clinical outcome but may favor distant metastasis. Clinical cancer research : an official journal of the American Association for Cancer Research. 2005;11:1154–9. [PubMed] [Google Scholar]
Associated Data
This section collects any data citations, data availability statements, or supplementary materials included in this article.