

Abstract
HapMap imputed genome-wide association studies (GWAS) have revealed >50 loci at which common variants with minor allele frequency >5% are associated with kidney function. GWAS using more complete reference sets for imputation, such as those from The 1000 Genomes project, promise to identify novel loci that have been missed by previous efforts. To investigate the value of such a more complete variant catalog, we conducted a GWAS meta-analysis of kidney function based on the estimated glomerular filtration rate (eGFR) in 110,517 European ancestry participants using 1000 Genomes imputed data. We identified 10 novel loci with p-value < 5 × 10⁻⁸ previously missed by HapMap-based GWAS. Six of these loci (HOXD8, ARL15, PIK3R1, EYA4, ASTN2, and EPB41L3) are tagged by common SNPs unique to the 1000 Genomes reference panel. Using pathway analysis, we identified 39 significant (FDR < 0.05) genes and 127 significantly (FDR < 0.05) enriched gene sets, which were missed by our previous analyses. Among those, the 10 identified novel genes are part of pathways of kidney development, carbohydrate metabolism, cardiac septum development and glucose metabolism. These results highlight the utility of re-imputing from denser reference panels, until whole-genome sequencing becomes feasible in large samples.
Chronic kidney disease (CKD) is a major public health concern affecting ~10% of the global adult population1. CKD is defined based on the glomerular filtration rate estimated from serum creatinine (eGFRcrea), a quantitative phenotype for which 53 loci have been identified so far by meta-analyses of genome-wide association studies (GWAS)2,3,4,5,6,7. These GWAS meta-analyses were based on ~2.5 million variants imputed from the HapMap Project reference panel8. Similar to the genetic variants identified for other phenotypes, all variants associated with eGFRcrea had a minor allele frequency (MAF) of >5%. However, though heritability of eGFR has been estimated in family studies to range between 36–75%9,10, the identified variants explain less than 4% of the variance of eGFRcrea7 and are located in regions of extended linkage disequilibrium (LD). So far, causal genes or variants have only been identified for a few of the association signals11,12.
It has been shown that variants poorly tagged by GWAS arrays and HapMap imputation, particularly low-frequency variants (1% ≤ MAF ≤ 5%), can explain additional variability13. Recent technological advances resulted in large collections of whole-genome sequence data, such as those from The 1000 Genomes project14,15. These data provide better coverage and increased imputation quality compared to previous HapMap imputation16, particularly for low-frequency variants.
We undertook a meta-analysis of GWAS from 33 studies that imputed genotypes from The 1000 Genomes reference panel, hypothesizing that this would uncover novel common variants associated with eGFRcrea, extend to low-frequency variants, reveal novel pathways of eGFRcrea associated genes, and improve fine-mapping of known eGFRcrea loci previously identified by our HapMap-based GWAS3,4,5,6,7.
Results
Study characteristics
In total, 110,517 adult individuals of European ancestry from 33 studies participated in GWAS meta-analysis of eGFRcrea using genotypes imputed with The 1000 Genomes Phase I reference panel14 (1000 Genomes meta-analysis). In addition, we performed a GWAS meta-analysis of eGFR derived from cystatin C (eGFRcys), an alternative marker of kidney function available in 11 of the 33 studies (n = 24,063). Participating studies, phenotypic characteristics, genotype information, and methods of analysis are reported in Supplementary Tables 1, 2, 3 and 4, respectively. The 1000 Genome meta-analysis results on eGFRcrea are compared with our previously published HapMap imputed data7, which was a HapMap-based meta-analysis of 133,814 European ancestry individuals from 50 studies.
Imputation quality of variants imputed with The 1000 Genomes reference panel
The 1000 Genomes meta-analysis consisted of 10,971,307 genetic variants (10,159,097 SNPs and 812,210 insertion-deletions) with imputation quality IQ > 0.417 in each of the studies and present in at least 50% of the subjects. Depending on the imputation methodology used, the IQ was reported as RSQ18 or info-score19 (Supplementary Table 3). Compared to the HapMap meta-analysis, the 1000 Genomes meta-analysis included a higher number of well imputed variants (8,103,124 versus 2,249,027 variants with IQ > 0.8), particularly among the low-frequency variants (1,585,176 versus 191,580, Supplementary Table 5). While rare variants (MAF ≤ 1%) were not available in the previous HapMap meta-analysis, there were even 632,526 well-imputed rare variants in the 1000 Genomes meta-analysis. When limiting the comparison to variants available in both panels, the proportion of well-imputed variants was higher in the 1000 Genomes compared to the HapMap meta-analysis (96.9% versus 93.3% for all; 88.3% versus 78.4% for the less frequent variants, Supplementary Table 5).
1000 Genomes meta-analysis results
The 1000 Genomes meta-analysis identified 49 genome-wide significant loci for eGFRcrea including 10 novel loci (lead variant p-value < 5 × 10⁻⁸, Table 1, Fig. 1, and Supplementary Figure 1). All identified lead variants were SNPs, and all were common, except rs187355703 near HOXD8 (MAF = 0.03). None of the novel loci contained genes known to cause monogenic forms of kidney disease and for most genes no connection to kidney function or kidney disease has yet been described (Supplementary Table 6). However, it should be acknowledged that genetic variants identified in GWAS are not necessarily associated with the function of the physically closest gene. Of the 53 known eGFRcrea loci identified previously based on HapMap2,3,4,5,6,7, 39 were also genome-wide significant in the current 1000 Genomes meta-analysis (Supplementary Table 7) and the remaining 14 showed directions of association consistent with published reports, but did not reach significance (p-values 2.2 × 10⁻² to 5.2 × 10⁻⁷; Supplementary Table 8). These results are consistent with our expectations from power computations (Fig. 2). Among the 39 lead variants in previously published loci that were genome-wide significant in the 1000 Genomes meta-analysis, 6 lead variants were found to be the same as the previously published variants, 25 were highly correlated (r2 > 0.6), and 8 showed moderate or no correlation (r2 ≤ 0.6).
Table 1. The 10 novel genome-wide significant loci (p < 5 × 10⁻⁸) associated with eGFRcrea in up to 110,517 subjects from up to 33 studies.
| Variant ID | Chr | Position | Index Gene | Effect allele/non-effect allele | Effect allele frequency | Effect (SE) | p-value | I2 (%) | IQ | Number of subjects in analysis |
|---|---|---|---|---|---|---|---|---|---|---|
| rs10874312 | 1 | 82,944,571 | LPHN2 | A/G | 0.67 | −0.0057 (0.0011) | 2.20 × 10−08 | 19 | 1.00 | 107,335 |
| rs12144044 | 1 | 113,248,791 | RHOC | A/C | 0.28 | −0.0061 (0.0011) | 2.87 × 10−08 | 0 | 0.96 | 110,517 |
| rs187355703 | 2 | 176,993,583 | HOXD8 | C/G | 0.97 | 0.0182 (0.0030) | 5.15 × 10⁻¹⁰ | 5 | 0.89 | 109,257 |
| rs111366116 | 5 | 53,295,546 | ARL15 | T/C | 0.11 | 0.0094 (0.0015) | 6.27 × 10⁻¹⁰ | 22 | 0.97 | 110,517 |
| rs113246091 | 5 | 67,739,274 | PIK3R1 | A/G | 0.10 | −0.0095 (0.0016) | 1.98 × 10−09 | 43 | 0.98 | 110,105 |
| rs7764488 | 6 | 133,812,872 | EYA4 | A/G | 0.32 | 0.0061 (0.0011) | 4.08 × 10−09 | 1 | 0.98 | 110,516 |
| rs13298297 | 9 | 119,264,108 | ASTN2 | A/G | 0.20 | −0.0075 (0.0014) | 1.53 × 10−08 | 0 | 0.81 | 110,514 |
| rs1111571 | 16 | 68,363,181 | SLC7A6 | A/G | 0.71 | 0.0061 (0.0011) | 6.20 × 10−09 | 0 | 1.00 | 109,275 |
| rs9962915 | 18 | 5,593,171 | EPB41L3 | T/C | 0.48 | −0.0055 (0.0010) | 7.19 × 10−09 | 0 | 0.98 | 110,516 |
| rs12458009 | 18 | 59,350,507 | RNF152 | T/G | 0.78 | −0.0064 (0.0012) | 2.90 × 10−08 | 21 | 1.00 | 107,325 |
Positions are given on GRCh build 37. The gene closest to the variant is listed (index gene). Effect sizes are given on the log scale. IQ = Imputation quality metric computed as median of info score (ImputeV2) or RSQ (minimac) across studies. SE = standard error. I2 = between-study heterogeneity statistic.
Figure 1. Manhattan Plot of the results of the 1000 Genome meta-analysis of eGFRcrea.

Shown are the (−log10) p-values by genomic position (GRCh build 37). Highlighted are the 10 novel loci identified with genome-wide significance (blue, annotated by nearest gene), the 39 previously published2,3,4,5,6,7 and confirmed (genome-wide significant) loci (green) and the 14 previously published loci that were not genome-wide significant in this analysis (orange).
Figure 2. Effects of the 1000 Genomes lead variants for all novel and known loci.
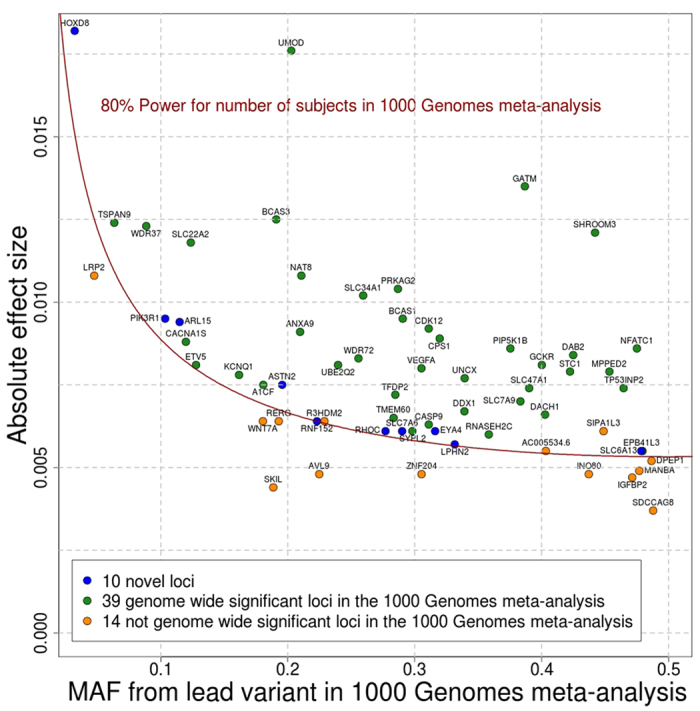
Shown are the effect sizes and minor allele frequencies (MAF) of the 1000 Genomes lead variants (variants with smallest p-value) in each of the 10 novel (blue), the 39 known genome-wide significant loci (green), and the 14 known loci that were not genome-wide significant in this analysis (orange). Additionally, the 80% power to detect such effects in a sample size of 110,000 subjects (as in this 1000 Genomes meta-analysis) is shown as a red line. A known locus is defined by the published lead variant ±1 Mb; a novel locus is defined by the 1000 Genome lead variant ±1 Mb.
The 1000 Genomes meta-analysis of eGFRcys confirmed previously identified loci in or near CST3/CST9 (p-value = 4.1 × 10−153), UMOD (p-value = 2.9 × 10⁻¹⁰), and ATXN2 (p-value = 1.6 × 10⁻⁸), but did not reveal any novel signal.
The ten novel eGFRcrea loci in the context of the different reference panels
For six of the ten novel loci (HOXD8, ARL15, PIK3R1, EYA4, ASTN2, and EPB41L3), the lead variant identified in the 1000 Genomes meta-analysis was not observed in any previous HapMap meta-analysis and in fact was not genotyped as part of the HapMap reference panel. Moreover, no variant in LD with any of these six lead variants (r2 or D’ ≥ 0.4) was available in the HapMap panel. These loci have been missed due to the limited coverage of the HapMap panel.
For one further locus, RHOC, the 1000 Genome meta-analysis lead variant was present also in our previous HapMap meta-analysis, but with a lower imputation quality (1000 Genomes median IQ across all studies of 0.96 versus HapMap median IQ of 0.86). The effect size was slightly higher in the 1000 Genomes compared to the HapMap meta-analysis (0.0061 versus 0.0051 ln ml/min/1.73 m2, Supplementary Table 9). This locus might have been missed in the HapMap meta-analysis due to the higher uncertainty in the imputed genotypes, which is known to diminish power and to attenuate effect size in linear regression20.
For the remaining three loci (LPHN2, SLC7A6 and RNF152), the lead variants of the 1000 Genomes meta-analysis were observed in the HapMap meta-analysis and similarly well imputed (IQ near 1.0 for both panels). The effect sizes were similar for all three SNPs in both 1000 Genomes and HapMap meta-analyses (0.0057 versus 0.0041, 0.0061 versus 0.0049, 0.0064 versus 0.0050 ln ml/min/1.73 m2 respectively) and the HapMap estimates lie well within the 98.5% confidence interval of the 1000 Genomes estimates. No substantial between-study heterogeneity was observed (I2 = 19%, 0%, or 21%, respectively, Supplementary Table 9). Since the p-values in the HapMap analysis were just short of genome-wide significance (p-values 8.38 × 10⁻⁶ to 2.33 × 10⁻⁷; type II error of 14–29%), it is conceivable that these variants have been missed previously by chance.
Pathway analyses
Data-driven Expression Prioritized Integration for complex Traits (DEPICT)21 analysis of eGFRcrea identified 39 significant (FDR < 0.05) genes and 127 significantly (FDR < 0.05) enriched gene sets that were not identified previously7. Among those, 23 gene sets contained at least one of the 10 novel index genes as a top 10 hit, underpinning the influence of ureteric bud morphogenesis on kidney development and the influence of abnormal glucose homeostasis and glucan metabolic process on carbohydrate metabolism (Supplementary Table 10). All 127 significant gene sets were further grouped into meta gene sets, corresponding to their correlation of gene expression. The two most significant meta gene sets were Cardiac Septum Development (p-value = 4.48 * 10−5) and Glucose Metabolism (p-value = 6.11 * 10−5), containing one of the 10 novel index genes (Supplementary Figure 2). We repeated the analysis with varying parameters (50, 200, and 500 repetitions and 500, 2000, and 5000 permutations, respectively), confirming our primary top gene sets at an FDR of <0.05. P-values ranged from 1.32 × 10⁻³ to 4.48 × 10⁻⁵ and from 8.27 × 10⁻⁴ to 4.98 × 10⁻⁵ for Cardiac Septum Development and Glucose Metabolism, respectively. We replicated also the strong influence of embryonic development, kidney transmembrane transporter activity, and kidney and urogenital system morphology in the genesis of CKD from our previous findings7: enrichment of all 148 previously identified gene sets was nominally significant (p-value < 0.05).
Independent association signals at novel and known loci
To identify independent association signals within a known or novel locus, we performed joint conditional analysis of eGFRcrea based on aggregated study-specific statistics using the GCTA software22. Among the combined 49 loci (39 known and 10 novel) attaining genome-wide significance, we uncovered eight independent signals, all among the previously reported loci, with p-values ranging from 2.39 × 10⁻⁸ to 2.78 × 10⁻¹⁷ after conditioning on the lead variants at each locus (Supplementary Table 11 and Supplementary Figure 3). We found that in all but one locus (DDX1), the previously reported lead variant was also genome-wide significant in our 1000 Genomes meta-analysis. A more detailed reasoning for the independent association signals is proposed in Supplementary Table 12. Information about biological knowledge of the highlighted genes is presented in Supplementary Table 13.
Proportion of phenotypic variance explained and polygenic risk score (PRS) analysis
The overall proportion of phenotypic variance of eGFRcrea explained by the lead variants of the 1000 Genomes meta-analysis in all novel and known loci was 3.99%: 0.46% by the 10 lead variants in the novel loci, 3.12% by the 39 lead variants in the known loci, and 0.41% by the 1000 Genomes lead variants in the 14 known loci that were not genome-wide significant in this analysis.
Next, we tested the proportion of eGFRcrea variance that could be explained by common genetic variants in 1,071 independent adolescents participating in the TRAILS study. Given prior evidence that eGFRcrea-associated genes are preferentially expressed in the kidney and enriched for genes important in kidney development23, external influences on eGFRcrea such as those for the two main drivers of CKD, diabetes and hypertension, may be less important in this setting. In TRAILS, the maximum proportion of variance explained by SNPs associated at pre-defined p-value thresholds was 2.2% for a PRS composed of SNPs associated with eGFRcrea at p-value < 1 × 10⁻⁵ (Supplementary Table 14).
SNP-based heritability analysis
The heritability estimate using variants of MAF > 0.01 for eGFRcrea in the ARIC study was 0.21 (95% CI 0.14–0.28) and 0.31 (95% CI 0.20–0.41) for all variants. This is in line with estimates in the literature from population-based family studies such as the Framingham Heart Study (adjusted h2 0.33, 95% CI 0.19–0.47)24.
Expression quantitative trait loci (eQTL) lookup
To explore potential functional implications of the novel loci, we interrogated published databases of cis eQTL in whole blood25 for the significant SNPs or their proxy variants (r2 > 0.8 within a 1 MB window). At 2 novel loci, significant association (p-value < 0.004) with gene expression were found: rs1111571 with SLC7A6, ZFP90, LYPLA3 and NFATC3, and for rs12144044 with RHOC and ST7L (Supplementary Table 15).
We expanded our downstream analysis by annotating the significant variants with known and predicted regulatory elements using Regulome DB26: We confirmed rs1111571 and rs12144044 as significant associations with gene expression and found supporting evidence that these two variants show also evidence for transcription factor binding sites and DNase peaks. For the locus identified by rs187355703 no proxy was found for lookup.
Genetic correlation
To investigate the genetic correlation of serum creatinine with related phenotypes, we queried LD Hub27 and identified modest genetic correlation with metabolic syndrome traits such as HDL, LDL, Type 2 diabetes, fasting glucose, BMI, and waist (LD score regression genetic correlation between −0.07 and 0.05). Little evidence for kidney damage is reported for a risk score of SNPs which are significant predictors of blood pressure28.
Discussion
The main finding of our study is that imputing from denser and larger reference panels is a valid strategy to advance gene mapping even when the sample size cannot be increased. Using genotype imputation based on The 1000 Genomes panel led to the identification of 10 novel genome-wide significant loci for kidney function that were missed by earlier HapMap-imputed GWAS of larger sample size, partly due to the enhanced coverage of genomic variation. This phenomenon was observed in similar analyses of other phenotypes29. Still, it needs to be acknowledged that the additional proportion of trait variance explained by these new loci is moderate, which is also in line with findings from GWAS of other phenotypes30.
There are several methodological insights that can be gained from our analyses. First, this 1000 Genomes-based meta-analysis of 110,517 individuals has identified 10 novel loci and 8 independent association signals in known loci that were missed by our latest HapMap based analysis7. Our detailed dissection shows that 1000 Genomes imputation (i) provides variants missed or poorly tagged by HapMap based analysis and (ii) achieves a higher effective sample size through increased imputation quality.
Second, although the 1000 Genomes imputation enables the analysis of low-frequency variants, insertions and deletions, all identified top variants were SNPs, and all but one (near HOXD8) were common. Moreover, we did not identify any low-frequency variant of large effect. Our results are highly concordant with those of other recent complex diseases studies31 showing that low-frequency variants are also contributing to complex disease risk, but that most observed effect sizes are small or modest, and hundreds of thousands of subjects are required for detection. To identify the contribution of rare variants (MAF < 1%) to eGFRcrea, large-scale sequencing data in addition to genomic chip data have been shown to be a promising approach31.
Third, these novel loci, missed by our previous analysis7, extend our knowledge of pathways underlying kidney function, which depicts the influence of kidney development, kidney structure, and metabolic activity on the development of CKD.
The comparison of our 1000 Genomes meta-analysis with our previous HapMap meta-analysis is limited by several factors: the current analysis consists of a reduced number of samples and a slightly different study composition. Furthermore, different 1000 Genomes reference panels were used to impute genotypes and advances in imputation software and methodology must be acknowledged32,33. Nevertheless, six of the ten lead variants in the novel loci are only covered by The 1000 Genomes reference panels, which demonstrates the advantage of meta-analyses on 1000 Genomes over HapMap imputed genotypes.
In conclusion, we identified 10 novel loci and 8 additional independent association variants within known loci associated with kidney function and identified 127 novel pathways for kidney function. These results highlight the utility of re-imputing studies from improved reference panels as an intermediate cost-efficient approach to scan the full allelic frequency range for kidney function associated variants, until whole genome sequencing is feasible in large samples.
Methods
Phenotype definition
Each study measured serum creatinine as described in Supplementary Table 1. Between-laboratory variation has been accounted for by calibrating creatinine to the US nationally representative National Health and Nutrition Examination Study (NHANES) data in all studies4,34,35. GFR based on serum creatinine (eGFRcrea) was estimated using the four-variable Modification of Diet in Renal Disease (MDRD) Study Equation36,37. In a subset of studies, serum cystatin C was also obtained and eGFRcys estimated as 76.7*(serum cystatin C)−1 19 (see also ref. 38). The eGFRcrea and eGFRcys values < 15 ml/min/1.73 m2 were set to 15, and values > 200 were set to 200 ml/min/1.73 m2. If not stated otherwise, our presented data and results are for eGFRcrea, which was our main analysis.
Genotyping
Genotyping was conducted in each study as specified in Supplementary Table 3. After applying appropriate quality filters, participating studies performed genotype imputation with standard imputing procedures32,33,39 using any version of the 1000 Genome Phase 1 reference panels. The obtained imputed genetic variants were coded as allelic dosages. Details of study specific imputation procedure and specific reference panel are given in Supplementary Table 3.
Genome-wide association analysis
Each study performed GWAS according to a uniform analysis plan by regressing sex- and age-adjusted residuals of the natural logarithm of eGFRcrea and eGFRcys on the allelic dosage levels. When appropriate, adjustment for study-specific features such as study site or genetic principal components was included in the model. Family-based studies accounted for relatedness using mixed effect models. Details on the study-specific methods are reported in Supplementary Table 4.
GWAS meta-analysis
All GWAS files underwent quality control using the GWAtoolbox package40. GWAS meta-analyses for eGFRcrea and eGFRcys were performed using the software METAL41 assuming fixed effects across studies and using inverse-variance weighting, excluding variants with imputation quality IQ ≤ 0.4 or variants present in less than 50% of the 110,517 subjects (yielding 10,971,307 variants). The genomic inflation factor λ was estimated for each study as the ratio between the median of all observed test statistics (b/SE)2 and the expected median of a chi-squared with 1 degree of freedom, with b and SE representing the effect of each SNP on ln eGFRcrea or ln eGFRcys and its standard error, respectively. Genomic-control (GC) correction42 was applied to p-values and SEs in case of λ > 1 (1st GC correction). To limit the possibility of false positives, a second GC correction on the aggregated results was applied after the meta-analysis. Between-study heterogeneity was assessed with the I2 statistic43.
Definition of known and novel loci
Known loci were defined by a previously published lead variant that had shown genome-wide significant association with eGFRcrea (p-value < 5 × 10⁻⁸) and the genetic segment around it (lead SNP ± 1 Mb)2,3,4,5,6,7. Variants outside such segments and associated with eGFRcrea at a p-value < 5 × 10⁻⁸ in the 1000 Genomes meta-analysis defined the novel loci. Each novel locus was pinpointed by the lead variant with the smallest p-value ± 1 Mb.
Comparison of 1000 Genomes and HapMap results
For the variants available in both the 1000 Genomes and HapMap meta-analyses, we compared lead variants, effect sizes, imputation quality as well as the power that we had in the data to detect the respective effects. For this comparison, we also utilized the association results of our previous HapMap meta-analysis7 in 50 studies including a maximum of 133,814 subjects. Power was calculated in R (www.r-project.org) for the approximate maximum number of subjects in the 1000 Genomes meta-analyses (n = 110,000) to identify the lead variants with an alpha of 5 × 10⁻⁸. Further, effective power, which takes into account the imputation quality of the variant, was calculated based on the effective number of subjects, which is the number of subjects per variant multiplied by the median of the imputation quality across studies.
Pathway Analyses
Pathway analyses, comprised of pathway/gene set enrichment and tissue/cell type analyses, were performed by applying a software package called Data-Driven Expression Prioritized Integration for Complex Traits (DEPICT)21. DEPICT performs gene set enrichment analyses by testing whether genes in GWAS-associated loci are enriched for reconstituted versions of known molecular pathways (jointly referred to as reconstituted gene sets). The reconstitution is accomplished by identifying genes that are co-regulated with other genes in a given gene set based on a panel of 77,840 gene expression microarrays44. Genes that are found to be transcriptionally co-regulated with genes from the original gene set are added to the gene set, which results in the reconstitution. Several types of gene sets were reconstituted in DEPICT: 5,984 protein molecular pathways derived from 169,810 high-confidence experimentally derived protein-protein interactions45, 2,473 phenotypic gene sets derived from 211,882 gene-phenotype pairs from the Mouse Genetics Initiative46, 737 Reactome database pathways47, 184 Kyoto Encyclopedia of Genes and Genomes (KEGG) database pathways48 and 5,083 Gene Ontology database terms49. In total, 14,461 gene sets were assessed for enrichment in genes in associated regions. DEPICT also facilitates tissue and cell type enrichment analyses by testing whether the genes in associated regions are highly expressed in any of the 209 MeSH annotations for 37,427 microarrays on the Affymetrix U133 Plus 2.0 Array platform.
In our analysis, we used DEPICT version 1 rel194 and to be comparable to our previous analysis, included all variants reaching eGFRcrea association p-values < 1 × 10⁻⁵ from HapMap and 1000 Genomes imputed data with genomic coordinates defined by genome build GRCh38 (https://genome.ucsc.edu/cgi-bin/hgLiftOver). Since 1000 Genomes imputed loci in the DEPICT analysis differed slightly from the HapMap imputed loci, our HapMap and 1000 Genomes input was created by adding all significant 1000 Genomes variants to all significant HapMap variants. This process resulted in a total of 3,659 variants for HapMap, 7,894 variants for 1000 Genomes, and 9,270 variants for HapMap and 1000 Genomes analyses. Next, independent lead variants were identified with Plink50 using ± 500 kb flanking regions and r2 > 0.01 with the 1000 Genomes data14 as reference. Genomic intervals are generated consisting of all variants within r2 > 0.5 to each lead variant. If any of the 19,987 genes in the analysis overlaps or resides within a genomic interval, it is mapped to that interval. After merging of overlapping regions and excluding regions within the major histocompatibility complex on chromosome 6, base pairs 25,000,000–35,000,000, DEPICT analyses were conducted using the following parameters: 200 repetitions to compute FDR and 2,000 permutations to compute p-values adjusted for gene length by using 500 null GWAS. For the enrichment analysis we used 10,968 reconstituted gene sets. For visualization, all novel significant gene sets were further merged into meta gene sets by running an affinity propagation51 from Pythons scikit-learn package (http://scikit-learn.org/). The network was visualized with Cytoscape (http://cytoscape.org/).
Identification of independent association signals with GCTA
We searched for independent association signals in the known and novel loci with a joint conditional analysis on the aggregated meta-analysis results using the GCTA-COJO method (conditional and joint genome-wide association analysis)22,52. The KORA-F4 GWAS data53 were used to estimate the LD (r2) in the joint conditional analysis, and to quantify the extent of coinheritance (D’)50. A potential independent association signal within a given locus was reported if the variant with the smallest conditional p-value was genome-wide significant (p-value < 5 × 10⁻⁸) after conditioning on the previously reported variant in a locus.
SNP-based heritability analysis
The heritability of eGFRcrea was estimated using GCTA GREML-LDMS methods54 (version 1.25) with imputed genotype accounting for linkage disequilibrium. The imputed genotype was based on dosage (probability > 0.9) imputed using the 1000 Genomes Phase I reference panel and filtered by the following criteria: HWE < 1 × 10⁻⁶, individual missingness >5%, SNP missingness >5%, and MAF < 0.0005 (~3 copies).
Proportion of phenotypic variance explained
To quantify the impact of the identified genetic loci on renal function, the percent of phenotypic variance explained by all lead variants in the novel and known loci was estimated as 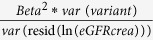 , where var (variant) = 2 * MAF * (1−MAF)and beta is the estimated effect of the variant in the 1000 Genomes meta-analysis55. The variance of the residuals of ln (eGFRcrea) is computed in the ARIC study (n = 9,038). All variants were assumed to have independent effects on the phenotype.
Polygenic risk score analysis
PriorityPruner (http://prioritypruner.sourceforge.net) was used to select independent SNPs from The 1000 Genomes reference panel using an algorithm that preferentially selects SNPs that are more significant in the current 1000 Genomes meta-analysis compared to the previous HapMap meta-analysis. Polygenic risk scores (PRSs), using various thresholds of significance, as obtained from the 1000 Genomes meta-analysis results and weighted for the effects sizes within study were generated in TRAILS56 (n = 1,071), an independent study of adolescents, which was not part of the meta-analysis. These PRSs were tested for association with eGFRcrea using linear regression in R and the variance explained by the PRSs was calculated.
Additional Information
How to cite this article: Gorski, M. et al. 1000 Genomes-based meta-analysis identifies 10 novel loci for kidney function. Sci. Rep. 7, 45040; doi: 10.1038/srep45040 (2017).
Publisher's note: Springer Nature remains neutral with regard to jurisdictional claims in published maps and institutional affiliations.
Supplementary Material
Acknowledgments
Study specific acknowledgements and funding sources for participating studies are reported in the supplement.
Footnotes
Caroline S Fox became a Merck employee as of Dec 14, 2015 and Audrey Chu became a Merck Employee as of July 18, 2016. The majority of the work related to this manuscript was completed before that. Daniel I Chasman has received grant support for genotyping and analysis in the WGHS. Ingrid B Borecki became employed at Regeneron Pharmaceuticals, Inc. recently, after the majority of the work related to this manuscript was completed.
Author Contributions Study Design E. Bottinger, J. Coresh, G.C. Curhan, J. Ding, V. Gudnason, C. Helmer, A. Hofman, M. Kähönen, B.K. Krämer, T. Lehtimäki, Y. Liu, A. Metspalu, P.P. Pramstaller, N. Probst-Hensch, O.T. Raitakari, H. Schmidt, R. Schmidt, B. Stengel, D. Toniolo, J.S. Viikari, P. Vollenweider, H. Völzke, A. Köttgen. Study Management R. Biffar, E. Boerwinkle, E. Bottinger, J. Coresh, M.C. Cornelis, A. Dehghan, L. Dengler, G. Eiriksdottir, T. Esko, O. Franco, V. Gudnason, S.J. Hancock, A. Hofman, N. Hutri-Kähönen, M. Imboden, M. Kähönen, W. König, H. Kramer, B.K. Krämer, T. Lehtimäki, R.J.F. Loos, M. Nauck, P.P. Pramstaller, N. Probst-Hensch, O.T. Raitakari, R. Rettig, P.M. Ridker, H. Schmidt, R. Schmidt, D. Toniolo, J.S. Viikari, P. Vollenweider, D. Chasman, C. Fox. Subject Recruitment E. Bottinger, M. Ciullo, J. Coresh, A.P. d’Adamo, G. Eiriksdottir, K. Endlich, P. Gasparini, G. Girotto, C. Helmer, A. Hofman, C. Huth, N. Hutri-Kähönen, M. Imboden, M. Kähönen, B.K. Krämer, T. Lehtimäki, M.A. McEvoy, C. Meisinger, A. Metspalu, P.P. Pramstaller, N. Probst-Hensch, O.T. Raitakari, A. Robino, C. Sala, R. Schmidt, R.J. Scott, S. Stracke, D. Toniolo, S. Ulivi, J.S. Viikari, P. Vollenweider. Interpretation of Results M. Gorski, A. Teumer, M. Li, Y. Li, B. Tayo, M. Feitosa, I. Borecki, A. Dehghan, L. Dengler, J. Ding, K. Endlich, W. König, S. Höllerer, Y. Liu, K. Lohman, R.J.F. Loos, Y. Lu, M. Olden, R. Rettig, F. Rivadeneira, S.E. Rosas, S. Sedaghat, A.V. Smith, I. Heid, C. Fox, A. Köttgen, C. Pattaro, C. Böger, C. Fuchsberger. Drafting of manuscript M. Gorski, P. van der Most, A. Teumer, A. Chu, M. Li, V. Mijatovic, I.M. Nolte, H. Snieder, I. Heid, A. Köttgen, C. Pattaro, C. Böger, C. Fuchsberger. Critical review of manuscript M. Gorski, P. van der Most, A. Teumer, A. Chu, M. Li, V. Mijatovic, I.M. Nolte, M. Cocca, D. Taliun, F. Gomez, Y. Li, B. Tayo, A. Tin, M. Feitosa, T. Aspelund, J. Attia, R. Biffar, M. Bochud, E. Boerwinkle, I. Borecki, E. Bottinger, M. Chen, V. Chouraki, M. Ciullo, J. Coresh, M.C. Cornelis, G.C. Curhan, A.P. d’Adamo, A. Dehghan, L. Dengler, J. Ding, G. Eiriksdottir, K. Endlich, S. Enroth, T. Esko, O. Franco, P. Gasparini, C. Gieger, G. Girotto, O. Gottesman, V. Gudnason, U. Gyllensten, S.J. Hancock, T.B. Harris, C. Helmer, S. Höllerer, E. Hofer, A. Hofman, E. Holliday, G. Homuth, F.B. Hu, C. Huth, N. Hutri-Kähönen, S. Hwang, M. Imboden, A. Johansson, M. Kähönen, W. König, H. Kramer, B.K. Krämer, A. Kumar, Z. Kutalik, J. Lambert, L.J. Launer, T. Lehtimäki, Lifelines Cohort Study, Y. Liu, K. Lohman, R.J.F. Loos, Y. Lu, L. Lyytikäinen, M.A. McEvoy, C. Meisinger, T. Meitinger, A. Metspalu, M. Metzger, E. Mihailov, P. Mitchell, M. Nauck, A.J. Oldehinkel, M. Olden, B.W.J.H. Penninx, G. Pistis, P.P. Pramstaller, N. Probst-Hensch, O.T. Raitakari, R. Rettig, P.M. Ridker, F. Rivadeneira, A. Robino, S.E. Rosas, D. Ruderfer, D. Ruggiero, Y. Saba, C. Sala, H. Schmidt, R. Schmidt, R.J. Scott, S. Sedaghat, A.V. Smith, R. Sorice, B. Stengel, S. Stracke, K. Strauch, D. Toniolo, A.G. Uitterlinden, S. Ulivi, J.S. Viikari, U. Völker, P. Vollenweider, H. Völzke, D. Vuckovic, M. Waldenberger, J. Wang, Q. Yang, D.I. Chasman, G. Tromp, H. Snieder, I. Heid, C. Fox, A. Köttgen, C. Pattaro, C. Böger, C. Fuchsberger. Statistical Methods and Analysis M. Gorski, P. van der Most, A. Teumer, A. Chu, M. Li, I.M. Nolte, M. Cocca, D. Taliun, F. Gomez, B. Tayo, A. Tin, M. Feitosa, T. Aspelund, M. Bochud, M. Chen, M.C. Cornelis, J. Ding, S. Enroth, T. Esko, G. Girotto, S.J. Hancock, S. Höllerer, E. Hofer, S. Hwang, M. Imboden, A. Kumar, Z. Kutalik, Y. Liu, K. Lohman, Y. Lu, L. Lyytikäinen, M. Metzger, E. Mihailov, M. Olden, G. Pistis, D. Ruderfer, D. Ruggiero, Y. Saba, S. Sedaghat, A.V. Smith, S. Ulivi, D. Vuckovic, Q. Yang, C. Pattaro, C. Böger, C. Fuchsberger. Genotyping A. Teumer, E. Boerwinkle, G.C. Curhan, A.P. d’Adamo, T. Esko, C. Gieger, G. Homuth, T. Lehtimäki, Y. Liu, Y. Lu, L. Lyytikäinen, T. Meitinger, A. Metspalu, D. Ruderfer, H. Schmidt, R.J. Scott, K. Strauch, A.G. Uitterlinden, U. Völker, P. Vollenweider, M. Waldenberger, D.I. Chasman. Bio-informatics, M. Gorski, P. van der Most, M. Cocca, D. Taliun, S. Enroth, T. Esko, S. Höllerer, E. Hofer, A. Kumar, Z. Kutalik, Y. Lu, L. Lyytikäinen, M. Olden, F. Rivadeneira, D. Ruderfer, Y. Saba, A.V. Smith, C. Fuchsberger.
References
- Eckardt K. U. et al. Evolving importance of kidney disease: from subspecialty to global health burden. Lancet 382, 158–69 (2013). [DOI] [PubMed] [Google Scholar]
- Chambers J. C. et al. Genetic loci influencing kidney function and chronic kidney disease. Nat Genet 42, 373–5 (2010). [DOI] [PMC free article] [PubMed] [Google Scholar]
- Chasman D. I. et al. Integration of genome-wide association studies with biological knowledge identifies six novel genes related to kidney function. Hum Mol Genet 21, 5329–43 (2012). [DOI] [PMC free article] [PubMed] [Google Scholar]
- Kottgen A. et al. Multiple loci associated with indices of renal function and chronic kidney disease. Nat Genet 41, 712–7 (2009). [DOI] [PMC free article] [PubMed] [Google Scholar]
- Kottgen A. et al. New loci associated with kidney function and chronic kidney disease. Nat Genet 42, 376–84 (2010). [DOI] [PMC free article] [PubMed] [Google Scholar]
- Pattaro C. et al. Genome-wide association and functional follow-up reveals new loci for kidney function. PLoS Genet 8, e1002584 (2012). [DOI] [PMC free article] [PubMed] [Google Scholar]
- Pattaro C. et al. Genetic associations at 53 loci highlight cell types and biological pathways relevant for kidney function. Nat Commun 7, 10023 (2016). [DOI] [PMC free article] [PubMed] [Google Scholar]
- International HapMap C. et al. Integrating common and rare genetic variation in diverse human populations. Nature 467, 52–8 (2010). [DOI] [PMC free article] [PubMed] [Google Scholar]
- Boger C. A. & Heid I. M. Chronic kidney disease: novel insights from genome-wide association studies. Kidney Blood Press Res 34, 225–34 (2011). [DOI] [PubMed] [Google Scholar]
- Pattaro C. et al. Genome-wide linkage analysis of serum creatinine in three isolated European populations. Kidney Int 76, 297–306 (2009). [DOI] [PubMed] [Google Scholar]
- Trudu M. et al. Common noncoding UMOD gene variants induce salt-sensitive hypertension and kidney damage by increasing uromodulin expression. Nat Med 19, 1655–60 (2013). [DOI] [PMC free article] [PubMed] [Google Scholar]
- Yeo N. C. et al. Shroom3 contributes to the maintenance of the glomerular filtration barrier integrity. Genome Res 25, 57–65 (2015). [DOI] [PMC free article] [PubMed] [Google Scholar]
- Sveinbjornsson G. et al. Rare mutations associating with serum creatinine and chronic kidney disease. Hum Mol Genet 23, 6935–43 (2014). [DOI] [PubMed] [Google Scholar]
- Genomes Project C. et al. An integrated map of genetic variation from 1,092 human genomes. Nature 491, 56–65 (2012). [DOI] [PMC free article] [PubMed] [Google Scholar]
- Genomes Project C. et al. A global reference for human genetic variation. Nature 526, 68–74 (2015). [DOI] [PMC free article] [PubMed] [Google Scholar]
- Wood A. R. et al. Imputation of variants from the 1000 Genomes Project modestly improves known associations and can identify low-frequency variant-phenotype associations undetected by HapMap based imputation. PLoS One 8, e64343 (2013). [DOI] [PMC free article] [PubMed] [Google Scholar]
- Nikpay M. et al. A comprehensive 1,000 Genomes-based genome-wide association meta-analysis of coronary artery disease. Nat Genet 47, 1121–30 (2015). [DOI] [PMC free article] [PubMed] [Google Scholar]
- Li Y., Willer C. J., Ding J., Scheet P. & Abecasis G. R. MaCH: using sequence and genotype data to estimate haplotypes and unobserved genotypes. Genet Epidemiol 34, 816–34 (2010). [DOI] [PMC free article] [PubMed] [Google Scholar]
- Marchini J., Howie B., Myers S., McVean G. & Donnelly P. A new multipoint method for genome-wide association studies by imputation of genotypes. Nat Genet 39, 906–13 (2007). [DOI] [PubMed] [Google Scholar]
- Carroll R. J. Measurement error in nonlinear models: a modern perspective. xxviii, 455 p. (Chapman & Hall/CRC, Boca Raton, FL, 2006). [Google Scholar]
- Pers T. H. et al. Biological interpretation of genome-wide association studies using predicted gene functions. Nat Commun 6, 5890 (2015). [DOI] [PMC free article] [PubMed] [Google Scholar]
- Yang J. et al. Conditional and joint multiple-SNP analysis of GWAS summary statistics identifies additional variants influencing complex traits. Nat Genet 44, 369–75, S1–3 (2012). [DOI] [PMC free article] [PubMed] [Google Scholar]
- Pattaro C. et al. Genetic associations at 53 loci highlight cell types and biological pathways relevant for kidney function. Nat Commun 7, 10023 (2016). [DOI] [PMC free article] [PubMed] [Google Scholar]
- Fox C. S. et al. Genomewide linkage analysis to serum creatinine, GFR, and creatinine clearance in a community-based population: the Framingham Heart Study. J Am Soc Nephrol 15, 2457–61 (2004). [DOI] [PubMed] [Google Scholar]
- Westra H. J. et al. Systematic identification of trans eQTLs as putative drivers of known disease associations. Nat Genet 45, 1238–43 (2013). [DOI] [PMC free article] [PubMed] [Google Scholar]
- Boyle A. P. et al. Annotation of functional variation in personal genomes using RegulomeDB. Genome Res 22, 1790–7 (2012). [DOI] [PMC free article] [PubMed] [Google Scholar]
- Zheng J. et al. LD Hub: a centralized database and web interface to perform LD score regression that maximizes the potential of summary level GWAS data for SNP heritability and genetic correlation analysis. Bioinformatics 33, 272–279 (2017). [DOI] [PMC free article] [PubMed] [Google Scholar]
- Ehret G. B. et al. The genetics of blood pressure regulation and its target organs from association studies in 342,415 individuals. Nat Genet 48, 1171–84 (2016). [DOI] [PMC free article] [PubMed] [Google Scholar]
- Horikoshi M. et al. Discovery and Fine-Mapping of Glycaemic and Obesity-Related Trait Loci Using High-Density Imputation. PLoS Genet 11, e1005230 (2015). [DOI] [PMC free article] [PubMed] [Google Scholar]
- Visscher P. M., Brown M. A., McCarthy M. I. & Yang J. Five years of GWAS discovery. Am J Hum Genet 90, 7–24 (2012). [DOI] [PMC free article] [PubMed] [Google Scholar]
- Fritsche L. G. et al. A large genome-wide association study of age-related macular degeneration highlights contributions of rare and common variants. Nat Genet 48, 134–43 (2016). [DOI] [PMC free article] [PubMed] [Google Scholar]
- Howie B., Fuchsberger C., Stephens M., Marchini J. & Abecasis G. R. Fast and accurate genotype imputation in genome-wide association studies through pre-phasing. Nat Genet 44, 955–9 (2012). [DOI] [PMC free article] [PubMed] [Google Scholar]
- Fuchsberger C., Abecasis G. R. & Hinds D. A. minimac2: faster genotype imputation. Bioinformatics 31, 782–4 (2015). [DOI] [PMC free article] [PubMed] [Google Scholar]
- Coresh J. et al. Calibration and random variation of the serum creatinine assay as critical elements of using equations to estimate glomerular filtration rate. Am J Kidney Dis 39, 920–9 (2002). [DOI] [PubMed] [Google Scholar]
- Fox C. S. et al. Predictors of new-onset kidney disease in a community-based population. JAMA 291, 844–50 (2004). [DOI] [PubMed] [Google Scholar]
- Levey A. S. et al. A more accurate method to estimate glomerular filtration rate from serum creatinine: a new prediction equation. Modification of Diet in Renal Disease Study Group. Ann Intern Med 130, 461–70 (1999). [DOI] [PubMed] [Google Scholar]
- Levey A. S. et al. Using standardized serum creatinine values in the modification of diet in renal disease study equation for estimating glomerular filtration rate. Ann Intern Med 145, 247–54 (2006). [DOI] [PubMed] [Google Scholar]
- Stevens L. A. et al. Estimating GFR using serum cystatin C alone and in combination with serum creatinine: a pooled analysis of 3,418 individuals with CKD. Am J Kidney Dis 51, 395–406 (2008). [DOI] [PMC free article] [PubMed] [Google Scholar]
- Porcu E., Sanna S., Fuchsberger C. & Fritsche L. G. Genotype imputation in genome-wide association studies. Curr Protoc Hum Genet Chapter 1, Unit 1 25 (2013). [DOI] [PubMed] [Google Scholar]
- Fuchsberger C., Taliun D., Pramstaller P. P., Pattaro C. & consortium, C. K. GWAtoolbox: an R package for fast quality control and handling of genome-wide association studies meta-analysis data. Bioinformatics 28, 444–5 (2012). [DOI] [PubMed] [Google Scholar]
- Willer C. J., Li Y. & Abecasis G. R. METAL: fast and efficient meta-analysis of genomewide association scans. Bioinformatics 26, 2190–1 (2010). [DOI] [PMC free article] [PubMed] [Google Scholar]
- Devlin B. & Roeder K. Genomic control for association studies. Biometrics 55, 997–1004 (1999). [DOI] [PubMed] [Google Scholar]
- Higgins J. P., Thompson S. G., Deeks J. J. & Altman D. G. Measuring inconsistency in meta-analyses. BMJ 327, 557–60 (2003). [DOI] [PMC free article] [PubMed] [Google Scholar]
- Fehrmann R. S. et al. Gene expression analysis identifies global gene dosage sensitivity in cancer. Nat Genet 47, 115–25 (2015). [DOI] [PubMed] [Google Scholar]
- Lage K. et al. A human phenome-interactome network of protein complexes implicated in genetic disorders. Nat Biotechnol 25, 309–16 (2007). [DOI] [PubMed] [Google Scholar]
- Blake J. A. et al. The Mouse Genome Database: integration of and access to knowledge about the laboratory mouse. Nucleic Acids Res 42, D810–7 (2014). [DOI] [PMC free article] [PubMed] [Google Scholar]
- Croft D. et al. Reactome: a database of reactions, pathways and biological processes. Nucleic Acids Res 39, D691–7 (2011). [DOI] [PMC free article] [PubMed] [Google Scholar]
- Kanehisa M., Goto S., Sato Y., Furumichi M. & Tanabe M. KEGG for integration and interpretation of large-scale molecular data sets. Nucleic Acids Res 40, D109–14 (2012). [DOI] [PMC free article] [PubMed] [Google Scholar]
- Ashburner M. et al. Gene ontology: tool for the unification of biology. The Gene Ontology Consortium. Nat Genet 25, 25–9 (2000). [DOI] [PMC free article] [PubMed] [Google Scholar]
- Purcell S. et al. PLINK: a tool set for whole-genome association and population-based linkage analyses. Am J Hum Genet 81, 559–75 (2007). [DOI] [PMC free article] [PubMed] [Google Scholar]
- Frey B. J. & Dueck D. Clustering by passing messages between data points. Science 315, 972–6 (2007). [DOI] [PubMed] [Google Scholar]
- Wright A. K. & Thompson M. R. Hydrodynamic structure of bovine serum albumin determined by transient electric birefringence. Biophys J 15, 137–41 (1975). [DOI] [PMC free article] [PubMed] [Google Scholar]
- Wichmann H. E., Gieger C., Illig T. & Group M. K. S. KORA-gen–resource for population genetics, controls and a broad spectrum of disease phenotypes. Gesundheitswesen 67 Suppl 1, S26–30 (2005). [DOI] [PubMed] [Google Scholar]
- Yang J. et al. Genetic variance estimation with imputed variants finds negligible missing heritability for human height and body mass index. Nat Genet 47, 1114–20 (2015). [DOI] [PMC free article] [PubMed] [Google Scholar]
- Rosner B. Fundamentals of biostatistics. xvii, 859 p. (Brooks/Cole, Cengage Learning, Boston, 2011). [Google Scholar]
- Huisman M. et al. Cohort profile: the Dutch ‘TRacking Adolescents’ Individual Lives’ Survey’; TRAILS. Int J Epidemiol 37, 1227–35 (2008). [DOI] [PubMed] [Google Scholar]
Associated Data
This section collects any data citations, data availability statements, or supplementary materials included in this article.