Abstract
Study Design
The Oswestry Disability Index v2.0 (ODI), SF36 Physical Function Domain (SF-36 PFD) and PROMIS Physical Function CAT v1.2 (PF CAT) questionnaires were prospectively collected from 1,607 patients complaining of back or leg pain, visiting a university-based spine clinic. All questionnaires were collected electronically, using a tablet computer.
Objective
To compare the psychometric properties of the PROMIS PF CAT to the ODI and SF36 Physical Function Domain in the same patient population.
Summary of Background Data
Evidence-based decision-making is improved by using high quality patient reported outcomes measures. Prior studies have revealed the shortcomings of the ODI and SF36, commonly used in spine patients. The PROMIS Network has developed measures with excellent psychometric properties. The Physical Function domain, delivered by Computerized Adaptive Testing (PF CAT), performs well in the spine patient population, though to-date direct comparisons with common measures have not been performed.
Methods
Standard Rasch analysis was performed to directly compare the psychometrics of the PF CAT, ODI, and SF36 PFD. Spearman correlations were computed to examine the correlations of the three instruments. Time required for administration was also recorded.
Results
1,607 patients were administered all assessments. The time required to answer all items in the PF CAT, ODI and SF-36 PFD was 44, 169, and 99 seconds. The ceiling and floor effects were excellent for the PF CAT (0.81%, 3.86%), while the ceiling effects were marginal and floor effects quite poor for the ODI (6.91% and 44.24%) and SF-36 PFD (5.97% and 23.65%). All instruments significantly correlated with each other.
Conclusions
The PROMIS PF CAT outperforms the ODI and SF-36 PFD in the spine patient population and is highly correlated. It has better coverage, while taking less time to administer with fewer questions to answer.
Keywords: PROMIS, Psychometrics, PF-CAT, Rasch Modeling, Patient Reported Outcomes
INTRODUCTION
Patient reported outcome measures play a central role in discerning the effectiveness of treatments and understanding the effectiveness of interventions.1 Both disease specific measures and general outcome measures are frequently obtained. In the lumbar spinal disorder patient population, particularly the lumbar surgical patient population, the Oswestry Disability Index (ODI) is the most commonly used disease specific measure and the SF-36 is the most common general outcome measure obtained.2,3 Ten items of the 36 in the SF-36 are scored for the Physical Function Domain (SF-36 PFD). Due to the length of 10 and 36 items respectively, there is a patient and physician office burden to administering the instruments on a regular basis, and that burden increases when multiple measures are administered.
In 2004, the PROMIS group began work, funded by the National Institutes of Health, on the development of new outcome measures using Item Response Theory4,5. The approach taken was to develop measures that test domains of health, such as physical, mental and social health, instead of disease specific measures. All measure scores are given as a T-score (Mean = 50, Standard Deviation = 10). The measures were also developed with a plan to use Computerized Adaptive Testing (CAT), allowing for high levels of accuracy with lower burden.6
For the spine patient population, one of the most relevant PROMIS domains is the Physical Function domain, as most patients visit the physician's office complaining of loss of function and desire a return to increased function. This PROMIS PF domain (v1.2) has 121 items that place patients on the continuum of function from extremely low to very high. Using CAT allows for accuracy similar to delivering all of the items, but generally only requires delivery of 4 to 6 items. The advantages of CAT in reducing the patient and office burden have been well studied.7-10 Initial assessment of the PROMIS Physical Function Domain in a spine patient population revealed excellent psychometric properties, with excellent fit, reliability, as well as excellent coverage, with a floor effect of only 0.2% and ceiling effect of 1.7%.11
While questions have been raised about the potential deficits of the most common disease specific and general outcome measures used in the spine populations, the ODI, and the SF-36 , direct head-to-head comparisons with the PROMIS PF CAT have not been tested in the same patient population12,13. This study aims to directly compare each of these patient reported outcome measures directly, as well as assess their correlation. If well correlated, to link scores and allow for calculating one score from the other when comparing studies or older data to newer data.
METHODS
Data collection
Completed ODI v2.0, SF36 PFD, and PROMIS Physical Function CAT v1.2 (PF CAT) questionnaires were used in this study from 1,607 consecutive patients visiting a tertiary, university-based spine center with the chief complaint of back or leg pain that completed the outcome measures. All questionnaires were collected electronically at the time of the visit and prior to seeing the doctor using a tablet computer. Patient responses were linked with patient demographic information already on file. Institutional Review Board Approval was obtained.
Description of Instruments
The ODI has 10 items and is scored based on the answers chosen for each question14. If the first statement is chosen (least disabled answer) then 0 points are given to that question, while if the last (most disabled) statement is chosen, then 5 points are given for that question. The intermediate statements are scored according to rank, sequentially. The total ODI score is calculated by summing the individual item scores and dividing by (5 × the number of items answered) and multiplied by 100% (example: score of all items added together is 20 divided by 5 × 10 items answered (50) × 100% = 40%. If an item answer was missing and 9 items scored with a score of 18, then the above scoring method would be: 18 divided by 5 × 9 items (45) × 100% = 40%) The total score has a range of 0% to 100%, with 0% being the least disabled and 100% being the most disabled.
The SF-36 PFD has 10 items and category responses range from 1 to 3. Scores for category 1 = 0 (limited a lot); for category 2 = 50 (limited a little); and for category 3 = 100 (not at all limited). The total score is created by summing up the individual item score for all 10 items, then dividing by 10. Its total score ranges from 0 to 100, with 0 being the lowest physical function and most disabled and 100 having the highest functioning.
The PROMIS PF CAT was administered from the PROMIS Physical Function item bank v1.2, which consists of 121 items, each individually validated and calibrated along the continuum of physical function, using item response theory. The algorithm for the CAT, which assigns the next item to be answered by the patient based on the previous answers, was provided through an application program interface (API) connected to the PROMIS Assessment Center (Assessment Center®, PROMIS Group, Chicago, IL). Item category responses range from 1 to 5. The scores for the PF CAT were recorded in T-scores, derived from the US population, with a mean score of 50 and standard deviation of 10 points. Low scores in the PF CAT represent low physical function, while high scores represent high physical function.
Analytic Approach
Patient characteristics were examined using a number of descriptive statistics including mean, standard deviation, proportion, and correlation as appropriate. Psychometric evaluations of the three instruments were carried out using Rasch analysis, a method based on item response theory (IRT) 15. The Rasch partial credit model allows patients and items (e.g., individual questions) to be incorporated into the same metric to provide meaningful score comparisons. This type of modeling is increasingly used in modern instrument evaluation 16,17. Alternative modeling approaches including 2-,3- and 4- parameter IRT models have been extensively discussed in the literature18,19. The specific instrument qualities analyzed here include item fit, dimensionality, coverage and reliability. Instrument correlations, time for administration as well as item level statistics were reported. Spearman correlations were computed between the three instruments to check whether the instruments were related to each other. They were reported with an r coefficient in the range from −1 to 1.
Fit
The outfit Mean Square (MNSQ) statistic is used to fit the data to the Rasch partial credit model. An outfit MNSQ less than 2 is considered a good fit 20. If there is not a good fit of the data to the Rasch model no further analysis using this model would be recommended as it is unlikely that the instrument conforms to the assumptions of this type of quantitative analysis 15.
Dimensionality
Unidimensional instruments measure only one underlying idea, construct, or phenomenon. If there is more than one factor influencing scale scores, a measure is considered to be multidimensional, for example a measure of physical function might be influenced by depression or pain. If after controlling for the first dimension, the unexplained variance of the residuals is greater than 5%, this indicates extra noise in the measurement or a lack of unidimensionality of the scale 21. Principle component analyses of the residuals was used to evaluate dimensionality of the instruments being assessed.
Reliability
Reliability can be assessed both at the item and individual level. Item reliability is the extent to which the item scores are reproducible with a similar population. Person reliability is the extent to which patient physical function scores are reproducible. The item and person reliabilities are reported as an r coefficient and falls within the range of −1 to 1.
Coverage
Coverage is the extent to which an instrument is able to accurately measure the full range of the trait, particularly at the low end and high end, for the group being examined. Coverage is displayed by the person-item histogram that places the patient scores along the trait in the top panel against the instrument item measures in the bottom panel. The horizontal axis reflects the continuum of the trait being tested from low to high (i.e. disability due to back pain for the ODI, and physical function for the SF-36 PFD and PF CAT). The vertical axis represents the number of patients above and the number of items at that specific trait score or level. The area of the distribution in which person counts are not mirrored by item coverage suggests a lack of sensitivity in the instrument. The trait continuum for each measure is graphed as it is used clinically, meaning that high scores on the ODI are high disability due to back pain (poor function), while high scores for the SF-36 PFD and PF CAT are good physical function. Good coverage is indicated by the ability to differentiate patients across the full spectrum of the assessment range. Greater than 15% ceiling or floor effects are considered as lacking instrument coverage or sensitivity.
RESULTS
Demographics
A total of 1,607 patients completed the instruments with a mean age of 54.2 years (range, 18-96) (Figure 1). Demographic information is presented (Table 1) and indicated that 765 patients were male (47.6%) and 842 were female. A total of 1,414 patients identified as Caucasian (89.7%) and 95 (6.1%) identified as Hispanic ethnicity.
Figure 1.
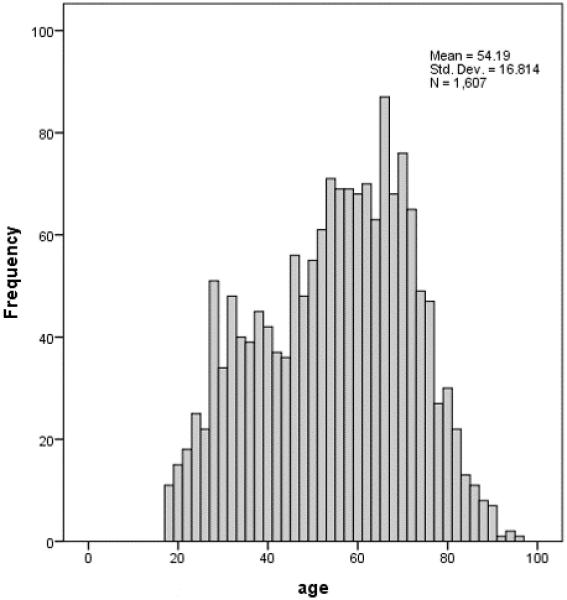
Age distribution
Table 1.
Demographics of the total population
| Variables | Min | Max | Median | Mean | Std | IQR |
|---|---|---|---|---|---|---|
| Age | 18 | 96 | 56 | 54.2 | 16.81 | 41-67 |
| N | % | ||
|---|---|---|---|
| Race | White or Caucasian | 1414 | 89.72 |
| Black or African American | 22 | 1.40 | |
| American Indian and Alaska Native | 11 | 0.70 | |
| Native Hawaiian and Other Pacific Islander | 5 | 0.32 | |
| Asian | 17 | 1.08 | |
| Other | 107 | 6.79 | |
| Missing | 31 | ||
| Ethnicity | W | 1467 | 93.92 |
| H | 95 | 6.08 | |
| Missing | 45 | ||
| Gender | Male | 765 | 47.60 |
| Female | 842 | 52.40 |
Instrument correlations and answering time
Spearman correlation indicated that all three instruments were highly correlated. The correlation of SF-36 PFD with PF CAT was 0.807. The correlation of SF-36 PFD with ODI was −0.804. The correlation of PF CAT with ODI was −0.810.
The time spent answering questions for each instrument averaged 44 seconds for the PF CAT with an average 4.15 items answered. For the ODI average time was 169 seconds with 9.29 average items answered. For the SF-36 PFD average time was 99 seconds with 9.96 average items answered.
Item Level Statistics
The distribution of scores across the three outcome measures is presented in Table 2. The average ODI score was 38.58 (SD = 19.78, N = 1,115) (Figure 2). Individual item responses for each answer type (category) ranged from category 5 chosen least often (2%) to category 2 chosen most often (37%). There was relatively good spread with category 0 (9%), category 1 (24%), category 3 (19%), and category 4 (9%). Average point biserial correlations ranged from 0.65 to 0.79, with all items positive and showing very good correlations.
Table 2.
Descriptive Statistics for the 3 measures
| SF36 | PFCAT | ODI | ||
|---|---|---|---|---|
| N | N (Valid) | 1180 | 1239 | 1115 |
| N (Missing) | 427 | 368 | 492 | |
| Mean | 39.65 | 38.05 | 38.58 | |
| Median | 35.00 | 38.00 | 38.00 | |
| Standard deviation | 28.10 | 8.21 | 19.78 | |
| Minimum | 0 | 15.40 | 0 | |
| Maximum | 100 | 73.35 | 91 | |
| Percentiles | 25 | 15.00 | 32.55 | 24.00 |
| 50 | 35.00 | 38.00 | 38.00 | |
| 75 | 60.00 | 42.63 | 53.00 | |
Figure 2.
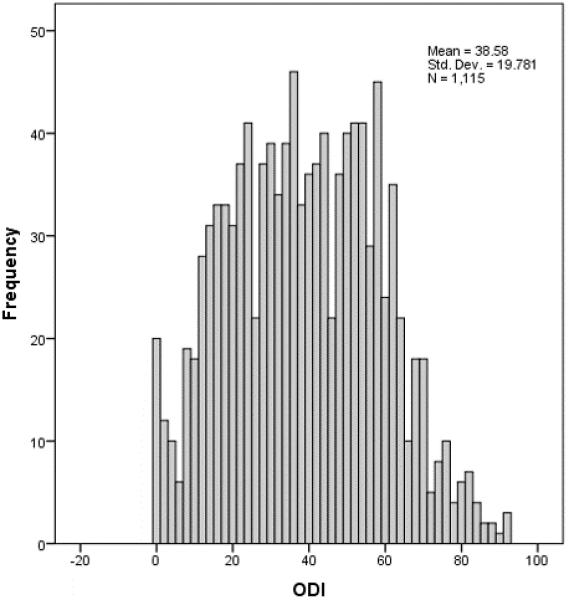
Distribution of ODI scores
The mean SF-36 PPD score was 39.65 (SD = 28.10, N = 1,180) (Figure 3). Assessing individual items, category 1 was chosen most often (77%) and category 3 was chosen least often (4%), with category 2 selected 19% of the time. Average point biserial correlations ranged from 0.56 to 0.83.
Figure 3.
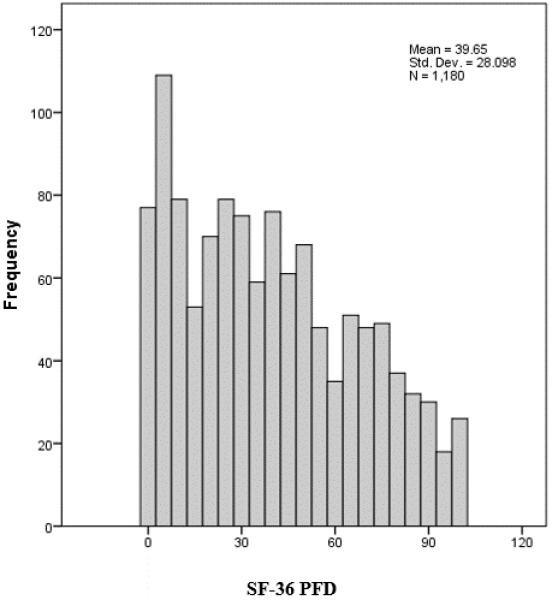
Distribution of SF-36 PFD scores
The PF CAT mean score was 38.05 (SD = 8.21, N = 1,239) (Figure 4). Evaluating individual items, category 3 was chosen most often (32%) and category 5 was chosen least often (2%). There was good spread across answer choices with category 1 (25%), category 2 (31%), and category 4 (10%). Average point biserial correlations ranged from 0.33 to 1.00.
Figure 4.
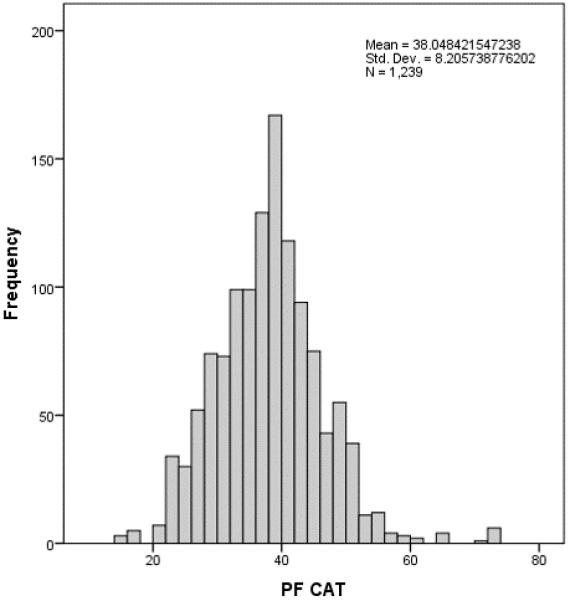
Distribution of PF CAT scores
Fit
Overall item fit for the ODI was good. The average outfit MNSQ was 1.00 (SD = 0.16), ranging from 0.77 to 1.27. Item fit for the SF-36 PFD was good overall, with its average outfit MNSQ being 1.26 (SD = 1.02), ranging from 0.69 to 4.23. Fit with the Rasch model for SF-36 PFD was good except with one item (i.e., SFPF_1), which had an outfit MNSQ over 2.0. Item fit for the PF CAT was also good overall, with its average outfit MNSQ being 1.47 (SD = 2.03), ranging from 0.21 to 9.90. Fit of the Rasch model for the PF CAT was good except with four items (i.e., PFB7, PFA30, PFA11, PFC13R1), which have outfit MNSQ over 2.0.
Dimensionality
Both the ODI and the SF-36 PFD were marginally unidimensional with 6.9% unexplained variance in the residuals of the first dimension for the ODI and 6.8% unexplained variance with the SF-36 PFD. The PF CAT demonstrated sufficient unidmensionality, with unexplained variance in the residuals of the first dimension being 2.6%.
Coverage
The ODI (Figure 5) had poor coverage in the low disability range (a floor effect of 44.24%), and adequate coverage at the high disability range (ceiling effect of 6.91%). The SF-36 PFD person-item histogram (Figure 6) had poor coverage at low physical function (floor effect of 23.65%) and fairly good coverage at high physical function (ceiling effect of 5.97%). Coverage for the PF CAT (Figure 7) was excellent for both low and high physical function (floor effects of 3.86% and ceiling effects 0.81%).
Figure 5.
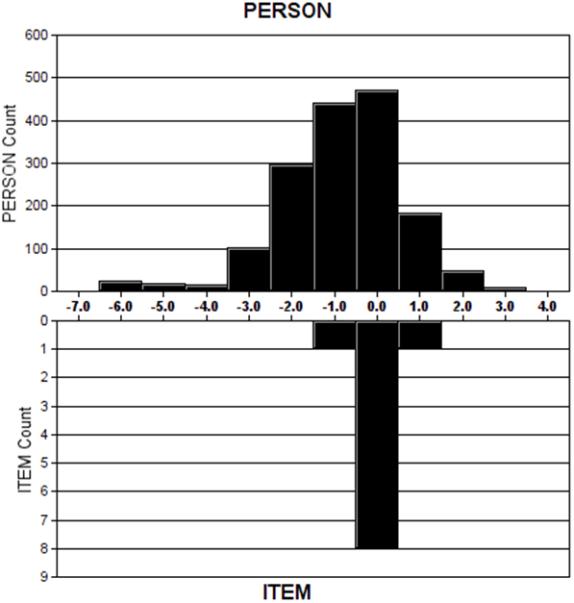
ODI person-item histogram.
Figure 6.
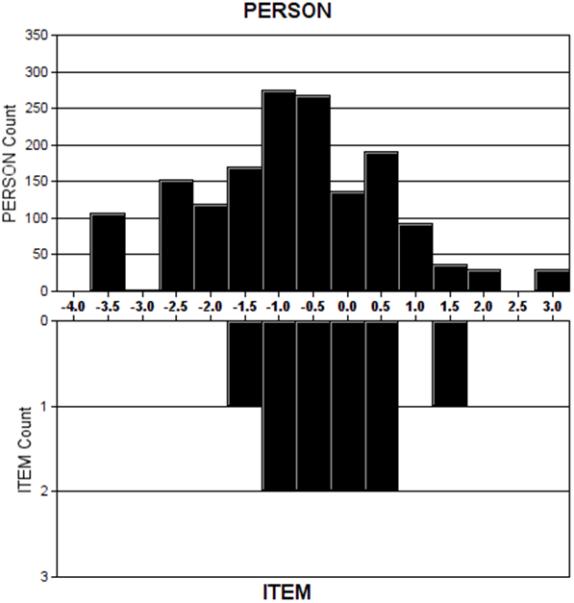
SF-36 PFD person-item histogram.
Figure 7.
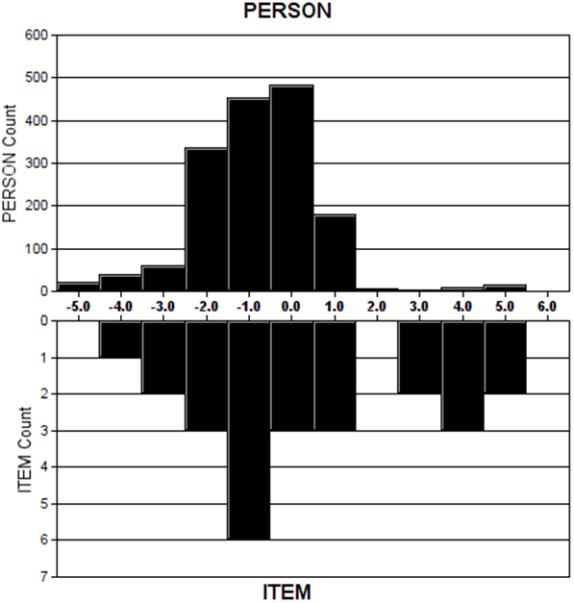
PF CAT person-item histogram.
Reliability
All instruments demonstrated good person and item reliability (Tables 3 and 4). The person reliability for the ODI (r = 0.87), the SF-36 PFD (r = 0.87), and the PF CAT (r = 0.95) all suggest that patient functioning would occur in similar orderings in future studies. The item reliability for the ODI (r = 1.00), the SF-36 PFD (r = 1.00), and the PF CAT (r = 0.99) indicates that the order of item difficulty would be similar across populations.
Table 3.
Summary statistics across persons.
| Total Score | Count | Measure | Model Std. Error | |
|---|---|---|---|---|
| PF CAT | ||||
| Mean | 10.6 | 4.1 | −.80 | .24 |
| Population SD | 3.9 | .5 | 1.26 | .08 |
| Sample SD | 3.9 | .5 | 1.26 | .08 |
| Maximum | 52.0 | 11.0 | 4.83 | 1.56 |
| Minimum | 5.0 | 3.0 | −4.37 | .16 |
| SF10 | ||||
| Mean | 18.1 | 10.0 | −.69 | .37 |
| Population SD | 5.2 | .2 | 1.18 | .11 |
| Sample SD | 5.2 | .2 | 1.18 | .11 |
| Maximum | 29.0 | 10.0 | 2.09 | .66 |
| Minimum | 10.0 | 9.0 | −2.70 | .29 |
| ODI | ||||
| Mean | 18.5 | 9.5 | −0.74 | 0.39 |
| Population SD | 9.2 | 0.6 | 1.29 | 0.10 |
| Sample SD | 9.2 | 0.6 | 1.29 | 0.10 |
| Maximum | 46.0 | 10.0 | 3.88 | 1.05 |
| Minimum | 1.0 | 8.0 | −4/74 | 0.32 |
Table 4.
Summary statistics across items.
| Total Score | Count | Measure | Model Std. Error | |
|---|---|---|---|---|
| PF CAT | ||||
| Mean | 692.2 | 265.0 | .38 | .11 |
| Population SD | 934.4 | 389.5 | 2.57 | .14 |
| Sample SD | 953.7 | 397.5 | 2.62 | .14 |
| Maximum | 3689.0 | 1581.0 | 4.65 | .53 |
| Minimum | 9.0 | 2.0 | −3.92 | .01 |
| SF10 | ||||
| Mean | 2856.2 | 1600.2 | −.27 | .03 |
| Population SD | 466.2 | 2.0 | .79 | .00 |
| Sample SD | 491.4 | 2.1 | .84 | .00 |
| Maximum | 3693.0 | 1602.0 | 1.25 | .04 |
| Minimum | 2038.0 | 1596.0 | −1.72 | .03 |
| ODI | ||||
| Mean | 2930.2 | 1525.1 | .00 | .03 |
| Population SD | 748.1 | 176.2 | .49 | 0.00 |
| Sample SD | 788.6 | 185.7 | .51 | 0.00 |
| Maximum | 4276.0 | 1601.0 | .99 | 0.03 |
| Minimum | 1725.0 | 998.0 | −.90 | 0.03 |
Error
Error is a measure of the accuracy of the score along the continuum being evaluated. Error varies depending on the location of the patient's score along the trait level being measured. The PROMIS PF CAT showed lower error then the SF-36 or ODI at all levels of function. It was less than the threshold of 0.32 for scores of subjects almost 3 standard deviations below the mean physical function to almost 5 standard deviations above the mean physical function. SF-36 maintained an error of 0.32 or less for 1.5 standard deviations below the mean to approximately 1 standard deviation above the mean. The ODI did not reach an error threshold of 0.32 at any level of function.
Differential Item Functioning
All 3 Patient Reported Outcome Measures had some items that functioned differently based on the patient's age or gender. The PROMIS PF CAT had 5 items having age DIF (Table 5) and 2 items having gender DIF (Table 6). The SF-36 PFD had 4 items having age DIF and 5 items having gender DIF. The ODI had 6 items having age DIF and 3 items having gender DIF.
Table 5.
Differential Item Functioning based on Age for the 3 measures
| Age DIF Item | Mantel Chi-square | p-value |
|---|---|---|
| PFA4 | 6.9771 | 0.0083 |
| PFA42 | 6.2818 | 0.0122 |
| PFB5R1 | 5.3683 | 0.0205 |
| PFC37 | 4.7948 | 0.0301 |
| PFC56 | 5.2446 | 0.0220 |
| SFPF6 | 4.1805 | 0.0409 |
| SFPF7 | 12.4398 | 0.0004 |
| SFPF9 | 5.2043 | 0.0225 |
| SFPF10 | 15.9766 | 0.0001 |
| ODI3 | 6.3844 | 0.0115 |
| ODI4 | 42.8347 | 0.0000 |
| ODI5 | 38.6146 | 0.0000 |
| ODI6 | 27.2124 | 0.0000 |
| ODI9 | 4.4294 | 0.0353 |
| ODI10 | 11.6227 | 0.007 |
Table 6.
Differential Item Functioning based on Gender for the 3 measures
| Gender DIF Item | Mantel Chi-square | p-value |
|---|---|---|
| PFA23 | 6.0515 | 0.0139 |
| PFC12 | 11.2008 | 0.0008 |
| SFPF3 | 6.3379 | 0.0118 |
| SFPF4 | 8.8534 | 0.0029 |
| SFPF5 | 6.7634 | 0.0093 |
| SFPF6 | 5.8431 | 0.0156 |
| SFPF10 | 26.0746 | 0.0000 |
| ODI3 | 8.6312 | 0.0033 |
| ODI8 | 10.8871 | 0.0010 |
| ODI9 | 5.4526 | 0.0195 |
DISCUSSION
The PROMIS set of outcomes tools has been an NIH driven initiative that set out to provide clinicians and researchers with efficient, precise, and valid outcome measures. Over the past 11 years PROMIS tools have been validated in a variety of populations ranging from rotator cuff disease to depression 22-26. PROMIS scores have been shown to outperform legacy measures in a number of populations.24,27,28 This study is the first to compare the PROMIS Physical Function domain to the ODI and SF-36 in a large population of spine patients.
The clinical usefulness of a test is a balance between the test's performance and time burden. Rasch analysis summarizes performance by measuring a test's fit, dimensionality, reliability and coverage. The PROMIS PF CAT outperformed both the SF-36 and the ODI in all four categories. The unidimensionality of a scale is the property of a scale that allows it to evaluate a single trait at a time without being influenced by other traits. The variance of a perfectly unidimensional question is fully accounted for by the trait being tested. The SF-36 PFD and ODI moderate unexplained variance, while the PF CAT had far less unexplained variance. This suggests that the PROMIS PF CAT is a more direct evaluation of physical function in this population, and is less influenced by other traits.
The PROMIS PF CAT outperformed both the SF-36 PFD and the ODI in terms of coverage, both in ceiling effect and floor effect, as well as lower error through the continuum of the trait tested. The ODI had poorer coverage at the low disability/high function end of the continuum, compared to both the PF CAT and the SF-36 PFD, while the SF-36 PFD had poorer coverage at the high disability/low function end of the continuum, as compared with the PF CAT and the ODI. The PF CAT also had lower error along the entire continuum for a much broader range than either the SF-36 PFD or ODI. These psychometric properties are key elements in selecting an appropriate tool for the population being studied. In terms of choosing between the SF-36 and the ODI, the SF-36 is the more appropriate choice for a higher functioning population while the ODI is the better instrument for a low functioning population. This study suggests that the PROMIS PF-CAT is more sensitive for both high and low functioning populations of spine patients, and is potentially a better instrument for both.
The advantages of computer adaptive testing allowed the PROMIS PF CAT to reach this higher level of performance with a substantially lower question burden. With average completion times for the PROMIS PF at less than half the SF-36PFD and less than a third of the ODI completion time, there is further advantage beyond psychometric improvements for regular clinical use. The PROMIS PF CAT provides lower burden to the patient and clinic.
Rasch modeling has been applied to both the ODI and SF-36PF to explore the psychometric properties of both tests in a variety of populations. 29-31 Lu et al found that the ODI is a unidimentional instrument in a heterogeneous population of patients with back pain.29 The outfit statistics of 0.55 to 1.26 presented in that study are similar to the performance of the ODI in our population. Hsiao et al found that the SF-36PF performs in a unidimentional manner in a population of opiate dependent patients. This is in contrast to a study of patients with Parkinsons disease that found evidence that SF-36 may not be unidimentional in that population.32 This underlines that the psychometric properties of these instruments are specific to the population that they are tested in.
The major limitation of this study is that it is a single center cohort of patients. While the sample size is large, at 1,607 patients, it is limited to the geographical and demographic heterogeneity of this institution's patient population. Further studies are necessary to investigate the extrinsic validity of these findings in other spine populations.
CONCLUSIONS
The PROMIS PF CAT outperformed the ODI and SF-36 PFD in the psychometric properties of dimensionality, reliability and coverage. In addition to the better performance, the PROMIS PF CAT presented a lower burden to the patient with substantially less time and questions required to complete the survey. This represents a significant step forward in the development of novel PRO measures for the spine patient population.
Acknowledgement
Research reported in this publication was supported by the National Institute of Arthritis and Musculoskeletal and Skin Diseases of the National Institutes of Health under Award Number U01AR067138. The content is solely the responsibility of the authors and does not necessarily represent the official views of the National Institutes of Health.
Footnotes
Level of Evidence: 2
Contributor Information
Darrel S. Brodke, University of Utah, Department of Orthopaedics, 590 Wakara Way, Salt Lake City, UT 84108.
Vadim Goz, University of Utah, Department of Orthopaedics, 590 Wakara Way, Salt Lake City, UT 84108.
Maren W. Voss, University of Utah, Department of Orthopaedics, 590 Wakara Way, Salt Lake City, UT 84108.
Brandon D. Lawrence, University of Utah, Department of Orthopaedics, 590 Wakara Way, Salt Lake City, UT 84108.
W. Ryan Spiker, University of Utah, Department of Orthopaedics, 590 Wakara Way, Salt Lake City, UT 84108.
Man Hung, University of Utah, Department of Orthopaedics, 590 Wakara Way, Salt Lake City, UT 84108.
REFERENCES
- 1.Marshall S, Haywood K, Fitzpatrick R. Impact of patient-reported outcome measures on routine practice: a structured review. J Eval Clin Pract. 2006;12(5):559–568. doi: 10.1111/j.1365-2753.2006.00650.x. [DOI] [PubMed] [Google Scholar]
- 2.McCormick JD, Werner BC, Shimer AL. Patient-reported outcome measures in spine surgery. J Am Acad Orthop Surg. 2013;21(2):99–107. doi: 10.5435/JAAOS-21-02-99. [DOI] [PubMed] [Google Scholar]
- 3.Chapman JR, Norvell DC, Hermsmeyer JT, et al. Evaluating common outcomes for measuring treatment success for chronic low back pain. Spine (Phila Pa 1976) 2011;36(21 Suppl):S54–68. doi: 10.1097/BRS.0b013e31822ef74d. [DOI] [PubMed] [Google Scholar]
- 4.Cella D, Riley W, Stone A, et al. The Patient-Reported Outcomes Measurement Information System (PROMIS) developed and tested its first wave of adult self-reported health outcome item banks: 2005-2008. J Clin Epidemiol. 2010;63(11):1179–1194. doi: 10.1016/j.jclinepi.2010.04.011. [DOI] [PMC free article] [PubMed] [Google Scholar]
- 5.Cella D, Yount S, Rothrock N, et al. The Patient-Reported Outcomes Measurement Information System (PROMIS): progress of an NIH Roadmap cooperative group during its first two years. Med Care. 2007;45(5 Suppl 1):S3–S11. doi: 10.1097/01.mlr.0000258615.42478.55. [DOI] [PMC free article] [PubMed] [Google Scholar]
- 6.Rose M, Bjorner JB, Becker J, Fries JF, Ware JE. Evaluation of a preliminary physical function item bank supported the expected advantages of the Patient-Reported Outcomes Measurement Information System (PROMIS). J Clin Epidemiol. 2008;61(1):17–33. doi: 10.1016/j.jclinepi.2006.06.025. [DOI] [PubMed] [Google Scholar]
- 7.Choi SW. Firestar: Computerized adaptive testing simulation program for polytomous item response theory models. Applied Psychological Measurement. 2009;33(8):644. [Google Scholar]
- 8.Fries J, Bruce B, Cella D. The promise of PROMIS: using item response theory to improve assessment of patient-reported outcomes. Clinical and experimental rheumatology. 2005;23(5):S53. [PubMed] [Google Scholar]
- 9.Revicki DA, Cella DF. Health status assessment for the twenty-first century: item response theory, item banking and computer adaptive testing. Qual Life Res. 1997;6(6):595–600. doi: 10.1023/a:1018420418455. [DOI] [PubMed] [Google Scholar]
- 10.Weiss DJ. Computerized adaptive testing for effective and efficient measurement in counseling and education. Measurement and Evaluation in Counseling and Development. 2004;37(2):70. [Google Scholar]
- 11.Hung M, Hon SD, Franklin JD, et al. Psychometric properties of the PROMIS physical function item bank in patients with spinal disorders. Spine (Phila Pa 1976) 2014;39(2):158–163. doi: 10.1097/BRS.0000000000000097. [DOI] [PubMed] [Google Scholar]
- 12.Gandek B, Sinclair SJ, Kosinski M, Ware JE., Jr Psychometric evaluation of the SF-36 health survey in Medicare managed care. Health Care Financ Rev. 2004;25(4):5–25. [PMC free article] [PubMed] [Google Scholar]
- 13.Dawson AP, Steele EJ, Hodges PW, Stewart S. Utility of the Oswestry Disability Index for studies of back pain related disability in nurses: evaluation of psychometric and measurement properties. International journal of nursing studies. 2010;47(5):604–607. doi: 10.1016/j.ijnurstu.2009.10.013. [DOI] [PubMed] [Google Scholar]
- 14.Fairbank JC, Couper J, Davies JB, O'Brien JP. The Oswestry low back pain disability questionnaire. Physiotherapy. 1980;66(8):271–273. [PubMed] [Google Scholar]
- 15.Rasch G. Studies in mathematical psychology: I. Probabilistic models for some intelligence and attainment tests. 1960.
- 16.Hobart JC, Cano SJ, Zajicek JP, Thompson AJ. Rating scales as outcome measures for clinical trials in neurology: problems, solutions, and recommendations. The Lancet Neurology. 2007;6(12):1094–1105. doi: 10.1016/S1474-4422(07)70290-9. [DOI] [PubMed] [Google Scholar]
- 17.Hung M, Hon SD, Franklin JD, et al. Psychometric properties of the PROMIS physical function item bank in patients with spinal disorders. Spine. 2014;39(2):158–163. doi: 10.1097/BRS.0000000000000097. [DOI] [PubMed] [Google Scholar]
- 18.Reise SP, Revicki DA. Handbook of item response theory modeling: Applications to typical performance assessment. Routledge; 2014. [Google Scholar]
- 19.Thissen D, Pommerich M, Billeaud K, Williams VS. Item response theory for scores on tests including polytomous items with ordered responses. Applied Psychological Measurement. 1995;19(1):39–49. [Google Scholar]
- 20.Bond TG, Fox CM. Applying the Rasch model: Fundamental measurement in the human sciences. Psychology Press; 2013. [Google Scholar]
- 21.Wright BD, Masters GN. Rating Scale Analysis. Rasch Measurement. ERIC; 1982. [Google Scholar]
- 22.Hung M, Clegg DO, Greene T, Saltzman CL. Evaluation of the PROMIS physical function item bank in orthopaedic patients. J Orthop Res. 2011;29(6):947–953. doi: 10.1002/jor.21308. [DOI] [PubMed] [Google Scholar]
- 23.Hung M, Baumhauer JF, Latt LD, et al. Validation of PROMIS (R) Physical Function computerized adaptive tests for orthopaedic foot and ankle outcome research. Clin Orthop Relat Res. 2013;471(11):3466–3474. doi: 10.1007/s11999-013-3097-1. [DOI] [PMC free article] [PubMed] [Google Scholar]
- 24.Beckmann JT, Hung M, Bounsanger J, Wylie JD, Granger EK, Tashjian RZ. Psychometric evaluation of the PROMIS Physical Function Computerized Adaptive Test in comparison to the American Shoulder and Elbow Surgeons score and Simple Shoulder Test in patients with rotator cuff disease. J Shoulder Elbow Surg. 2015 doi: 10.1016/j.jse.2015.06.025. [DOI] [PubMed] [Google Scholar]
- 25.Driban JB, Morgan N, Price LL, Cook KF, Wang C. Patient-Reported Outcomes Measurement Information System (PROMIS) instruments among individuals with symptomatic knee osteoarthritis: a cross-sectional study of floor/ceiling effects and construct validity. BMC Musculoskelet Disord. 2015;16:253. doi: 10.1186/s12891-015-0715-y. [DOI] [PMC free article] [PubMed] [Google Scholar]
- 26.Amtmann D, Bamer AM, Johnson KL, et al. A comparison of multiple patient reported outcome measures in identifying major depressive disorder in people with multiple sclerosis. J Psychosom Res. 2015 doi: 10.1016/j.jpsychores.2015.08.007. [DOI] [PubMed] [Google Scholar]
- 27.Hung M, Stuart AR, Higgins TF, Saltzman CL, Kubiak EN. Computerized Adaptive Testing Using the PROMIS Physical Function Item Bank Reduces Test Burden With Less Ceiling Effects Compared With the Short Musculoskeletal Function Assessment in Orthopaedic Trauma Patients. Journal of orthopaedic trauma. 2014;28(8):439–443. doi: 10.1097/BOT.0000000000000059. [DOI] [PubMed] [Google Scholar]
- 28.Oude Voshaar MA, Ten Klooster PM, Glas CA, et al. Validity and measurement precision of the PROMIS physical function item bank and a content validity-driven 20-item short form in rheumatoid arthritis compared with traditional measures. Rheumatology (Oxford) 2015 doi: 10.1093/rheumatology/kev265. [DOI] [PubMed] [Google Scholar]
- 29.Lu YM, Wu YY, Hsieh CL, et al. Measurement precision of the disability for back pain scale-by applying Rasch analysis. Health and quality of life outcomes. 2013;11:119. doi: 10.1186/1477-7525-11-119. [DOI] [PMC free article] [PubMed] [Google Scholar]
- 30.Lochhead LE, MacMillan PD. Psychometric properties of the Oswestry disability index: Rasch analysis of responses in a work-disabled population. Work. 2013;46(1):67–76. doi: 10.3233/WOR-121537. [DOI] [PubMed] [Google Scholar]
- 31.Hsiao YY, Shih CL, Yu WH, Hsieh CH, Hsieh CL. Examining unidimensionality and improving reliability for the eight subscales of the SF-36 in opioid-dependent patients using Rasch analysis. Qual Life Res. 2015;24(2):279–285. doi: 10.1007/s11136-014-0771-z. [DOI] [PubMed] [Google Scholar]
- 32.Jenkinson C, Fitzpatrick R, Garratt A, Peto V, Stewart-Brown S. Can item response theory reduce patient burden when measuring health status in neurological disorders? Results from Rasch analysis of the SF-36 physical functioning scale (PF-10). J Neurol Neurosurg Psychiatry. 2001;71(2):220–224. doi: 10.1136/jnnp.71.2.220. [DOI] [PMC free article] [PubMed] [Google Scholar]


