Abstract
Animal communication signals that simultaneously share the same sensory channel are likely to coevolve to maximize the transmission of each signal component. Weakly electric fish continuously produce a weakly electric field that functions in communication. Fish modulate the electric organ discharge (EOD) on short timescales to produce context-specific signals called chirps. EODs and chirps are simultaneously detected by electroreceptors and processed in the electrosensory system. We analyzed these signals, first to explore whether EOD waveform is encoded in the signal received by electroreceptors and then to examine how EODs and chirps interact to influence conspicuousness. Our findings show that gross discrimination of sinusoidal from complex EOD waveforms is feasible for all species, but fine discrimination of waveform may be possible only for species with waveforms of intermediate complexity. The degree of chirp frequency modulation and chirp relative decay strongly influenced chirp conspicuousness, but other chirp parameters were less influential. The frequency difference between the interacting EODs also strongly impacted chirp conspicuousness. Finally, we developed a method for creating hybrid chirp/EOD combinations to independently analyze the impact of chirp species, EOD species, and EOD difference frequency on chirp conspicuousness. All three components and their interactions strongly influenced chirp conspicuousness, which suggests that evolutionary changes in parameters of either chirps or EODs are likely to influence chirp detection. Examining other environmental factors such as noise created by fish movement and species-typical patterns of sociality may enrich our understanding of how interacting EODs affect the detection and discrimination of chirps across species.
Keywords: weakly electric fish, conspicuousness, signal, chirping, co-evolution
1. INTRODUCTION
Complex signals are animal communication displays that use multiple signal components (Hebets & Papaj, 2005; Partan & Marler, 2005). The function of complex signals varies across species and contexts, with complex signals used to transmit multiple messages simultaneously, to provide redundancy as a means of improving reliability, to counteract varied sources of environmental noise, or to overcome sensory constraints (Hebets & Papaj, 2005). Multimodal signals, which are complex signals that exert influence on the receiver by stimulating two or more sensory modalities, have been well-characterized, particularly in courtship displays and warning signals (reviewed in Higham & Hebets, 2013 and Rowe & Guilford, 1999). However, less is known about how the components of complex signals that share the same sensory channel interact and influence each other’s detection and evolution. Some of the most intriguing examples of unimodal complex signals come from the study of animal olfactory communication. For example, some species of ants use complex blends of pheromones to simultaneously signal fertility, caste, and/or colony identity (Denis et al., 2006; Moore & Liebig, 2010; Smith et al., 2013). In this paper we take advantage of a uniquely suited model system – the communication signals of weakly electric fishes – to examine how two functionally distinct signals impinging on the same sensory modality (electroreception) interact to influence signal detection across species.
The electrosensory system of South American weakly electric knifefish is a multipurpose sensory modality used for sampling several important types of environmental information. Weakly electric knifefish detect self-generated electric fields that are distorted in predictable ways by objects and organisms in the environment and by the signals of other electrogenic animals. With each electric organ discharge (EOD), the fish experiences a transient increase in the voltage of its head relative to its tail followed by a concomitant decrease in the voltage of its head relative to its tail (Assad et al., 1999). For weakly electric fish in the family Apteronotidae, the EOD creates a continuously alternating high-frequency electric field. The frequency, amplitude, and waveform of this wave-type EOD can communicate information about size, sex, species, and/or social status (Hopkins, 1988; Kramer & Otto, 1991; Turner et al., 2007; Zakon & Dunlap, 1999). Fish also modulate the frequency and amplitude of the EOD on short timescales (milliseconds to seconds) to produce context-specific communication signals called chirps (Fig. 1; Hagedorn & Heiligenberg, 1985; Larimer & MacDonald, 1968). Thus, the EOD is a continuous badge of identity, whereas chirps are transient indicators of motivational state (Smith, 2013). EODs and chirps have relatively simple structures that can be easily recorded, analyzed, manipulated, synthesized, and played back. This makes them ideal candidates for examining how the properties of animal communication signals convey information.
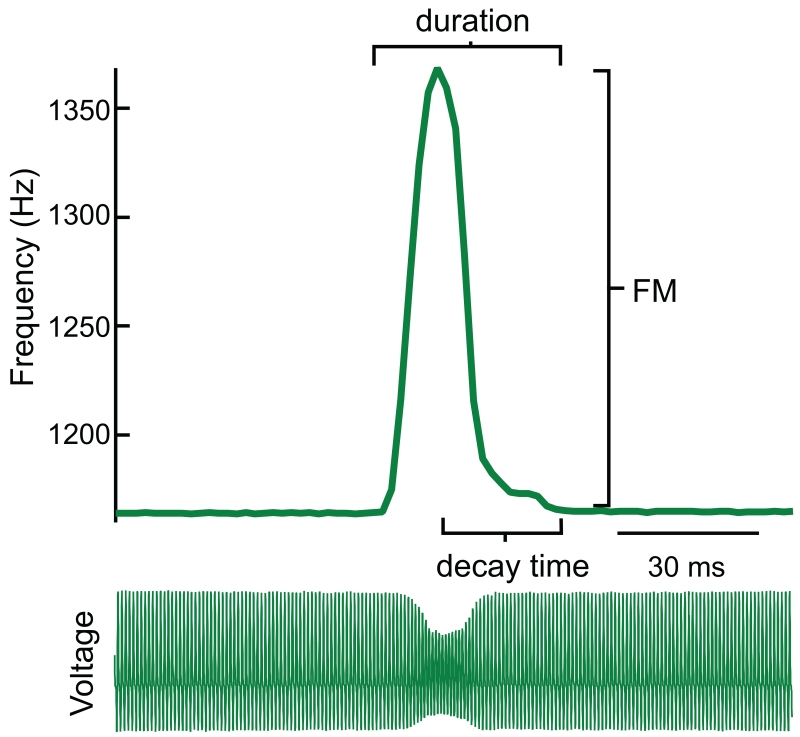
Fig. 1.
Single-peaked chirp of an Adontosterarchus devenanzii showing chirp parameters used in this study. The EOD trace (bottom) shows the change in head-tail voltage over time. During the chirp, EOD amplitude decreases and EOD frequency rapidly increases (top). Chirp FM is the maximal increase in EOD frequency relative to baseline during the chirp. Chirp duration is the time that elapses between chirp onset and cessation. Chirp decay time is the amount of time that elapses between the peak of the frequency excursion and the end of the chirp. We report relative chirp decay here, which is the ratio of chirp decay time to chirp duration.
Unlike many communication signals, EODs are not detected directly by other fish. Because the EOD is produced continuously, each fish detects a social partner’s EOD as the interaction of the signaler’s EOD with the fish’s own EOD. Since socially interacting fish usually fire their electric organs at different frequencies, the EODs of interacting fish produce a relatively slow amplitude modulation (called a beat) that forms as the two EODs come in and out of phase with each other and thereby constructively and destructively interfere (Fig. 2; Fortune et al., 2006; Rose, 2004; Scheich, 1977a). Fish are able to use the frequency of the beat to determine the relative EOD frequency of nearby fish (Scheich, 1977b; Watanabe and Takeda, 1963). The beat frequency is equal to the absolute value of the difference frequency (DF) between the EODs of two interacting fish. The frequency and pattern of the amplitude modulation (AM) created by the interaction of two or more EODs conveys social information that is encoded by amplitude-sensitive electroreceptors (P-units; Nelson et al., 1997; Zakon, 1988). When one fish rapidly increases its EOD frequency during a chirp, the beat frequency increases correspondingly. The regular beat is thus transiently disrupted by a change in the modulation frequency. This transient change in the beat causes the beat’s phase to abruptly change. The phase shift is particularly noticeable for chirps lasting less than one beat cycle (Benda et al., 2005; Walz et al., 2013; Walz et al., 2014). Similarly, a decrease in EOD amplitude during a chirp reduces beat contrast. Although EODs and chirping serve different social functions, both signals are produced and detected simultaneously by the same array of electroreceptors, since the chirp is a modulation of the EOD. Chirps can only be detected based on how they disrupt the beat, and thus their perception is likely constrained by the structure of the interacting EODs that produce the beat.
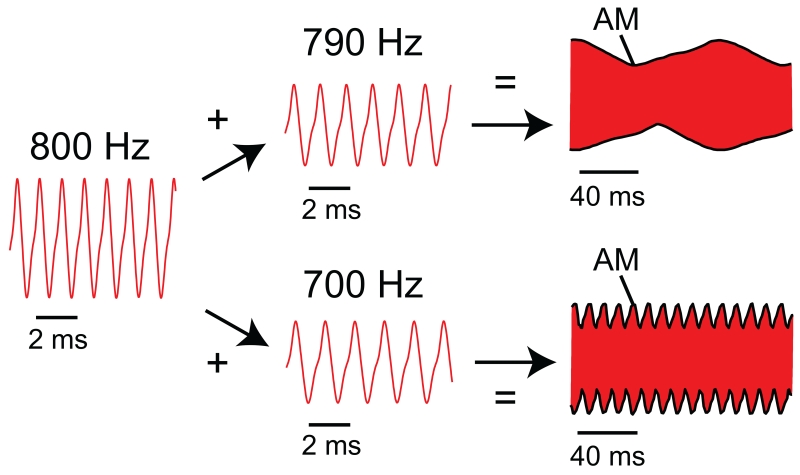
Fig. 2.
Interactions of EODs to produce beats. Red traces are the head-tail voltage during the EOD. Beat frequency is determined by the EOD frequencies of the two interacting EODs. Here an 800 Hz EOD was combined with a 790 Hz EOD to create a 10 Hz beat (top). Then the same 800 Hz EOD was combined with a 700 Hz EOD to create a 100 Hz beat (bottom). The AM (amplitude modulation) is indicated with thick black lines on the beats. Note the differing timescales for the EODs and the beats. Also note that neither the EOD waveform nor the beat waveform is precisely sinusoidal.
The complicated dynamic created by the co-evolution of EODs and chirps is one potential explanation for the existence of an enormous degree of variation in signal structure between sexes and across different species of weakly electric knifefish (Smith, 2013; Turner et. al, 2007; Zakon & Dunlap, 1999). EODs vary in the broadness of species-typical frequency range and in the shape of the EOD waveform. Some species have EOD waveforms that are nearly sinusoidal; some species have complex, multi-peaked EOD waveforms; and other species have EOD waveforms of intermediate complexity. However, it is currently unclear whether weakly electric fish perceive or attend to waveform information (Fig. 3; Dunlap & Larkins-Ford, 2003b; Fugère & Krahe, 2010; Kramer & Otto, 1991). Additionally, the relationship between EOD frequency and beat frequency is well understood, but little is known about how EOD waveform affects beat structure (Bullock et al., 1972; Heiligenberg et al., 1978; Scheich, 1977a). In recent years, the ability of the electrosensory system to encode the disruption created by chirps on different beat frequencies has been explored. However, these studies have focused on sinusoidal beats and have not yet considered how chirps interact with the more complex beats that naturally occur when species with complex EOD waveforms interact (Benda et al., 2006; Hupé et al., 2008; Walz et al., 2014). We also do not know how differing EOD waveforms and their interactions with beat frequency affect the conspicuousness of chirps.
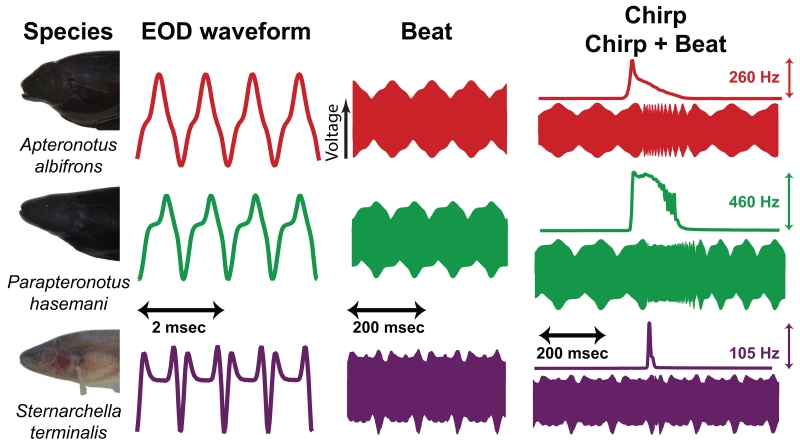
Fig. 3.
EOD waveform and chirp structure vary substantially across species. We present a few cycles of three different EODs here to illustrate this variation: a sinusoidal EOD (A. albifrons), a moderately complex EOD (P. hasemani), and a complex EOD (S. terminalis). Each EOD was combined with a temporally stretched copy of itself to generate a 10 Hz beat (middle column). The beat is shown on a longer timescale that encompasses many cycles of the interacting EODs. In the right column, the frequency trace shows the frequency modulation during the chirp (top), which translates into differing patterns of disruptions to the beat (bottom). Note the different frequency scales for each chirp.
Like EOD waveform, species-typical chirp characteristics vary widely. Quantifiable characteristics of chirps include chirp duration, chirp frequency modulation (FM), chirp amplitude modulation (AM), the proportion of time during which the EOD frequency is rising vs. falling during a chirp (chirp relative decay time), and the presence or absence of multi-peaked chirps (Turner et al., 2007). Some species use two or more distinct chirp “types,” the best-studied examples of which are the A. leptorhynchus and A. albifrons “big” and “small” chirps. These chirps are named for their bimodal distributions of chirp FM (Bastian et al., 2001; Dunlap & Larkins-Ford, 2003a; Kolodziejski et al., 2005). Finally, all species studied to date exhibit at least one sexually dimorphic signaling feature in EOD frequency or chirping (reviewed in Smith, 2013). This remarkable degree of naturally occurring variation in the primary communication channel provides a unique opportunity to examine how fitness-enhancing information about sex, species, breeding condition, and motivational state can be extracted from the complex sensory stream created by aggregations of two or more fish. Because chirps are detected as disruptions in the beat created by interacting EODs, changes in EOD properties can necessarily be expected to influence how chirps are detected. Thus, we might expect co-evolution between the properties of EODs and chirps, with chirps maximally conspicuous on conspecific beats in order to enhance the efficacy of this more transient signal. Here we use recordings of many different species of weakly electric fish to simulate social interactions in order to model how parameters of chirps and EODs interact to affect the conspicuousness of these social signals.
2. METHODS
2.1. Animals & Recordings
We analyzed 147 signals from twelve species of South American ghost knifefish that varied across several parameters of EODs and chirping. These species included Adontosternarchus balaenops, Adontosternarchus devenanzii, Apteronotus albifrons, “Apteronotus” bonapartii, Apteronotus leptorhynchus, Parapteronotus hasemani, Porotergus gimbeli, Sternarchella terminalis, Sternarchogiton nattereri, Sternarchogiton porcinum, Sternarchorhynchus roseni, and Sternarchorhynchus curvirostris. EODs and chirps were elicited using playbacks and were characterized in detail in previous studies (Ho et al., 2010; Ho et al., 2013; Kolodziejski et al., 2005; Petzold & Smith, 2015; Turner et al., 2007; Zhou & Smith, 2006). The recordings are available in an online archive of electric fish signal recordings (Electric Fish Signal Archive: http://www.indiana.edu/~efishlab/catalog/). For this study, a chirp (which is a modulation of the EOD) was included only if it had at least five seconds of unmodulated EOD before and after its occurrence. After a chirp was selected, a stable-frequency unmodulated EOD clip of identical length was taken from the same recording of the same fish to use when simulating social interactions. The sampling rate was 44.1 kHz for each file.
2.2. Extracting the Amplitude Modulation
We used audio editing software (CoolEdit Pro; Syntrillium; Phoenix, AZ, USA) to simulate social interactions by combining recordings of chirps and EODs. The simplest situation was the interaction of two EODs without any chirps. For these simulations, the EOD signal was temporally stretched and resampled to decrease the frequency by 10 Hz or 100 Hz. The amplitude of the unmanipulated EOD was reduced to 30% of its original value, and then added to the stretched EOD. The resulting signals mimic the beat detected by the fish with the lower EOD frequency, since the receiver’s own EOD is closer to its electroreceptors (and thus typically higher in amplitude) than the signaler’s EOD. For interactions in which we simulated the signaling fish (higher frequency EOD) chirping at the receiver fish (lower frequency EOD), the procedure was exactly the same except that the middle of the unmanipulated EOD signal contained a chirp. Temporally stretching the EOD signal allowed us to precisely standardize the frequency difference between the interacting EODs, and thus produce beats that had specific frequencies. For a subset of EODs, we confirmed that combining EODs with a temporally stretched/compressed copy of themselves produced similar EOD and beat waveforms as combining two unmanipulated EOD signals. We selected two difference frequencies (DF; 10 Hz and 100 Hz) in order to examine how chirp conspicuousness might be affected by the frequency difference between signaler and receiver across encounters with conspecifics within a species-typical range of EOD frequencies. These two beat frequencies also simulate same-sex (10 Hz beat) and opposite-sex (100 Hz beat) social interactions in the two species from our sample that have sexually dimorphic EOD frequencies (A. albifrons and A. leptorhynchus; Meyer et al., 1987; Zakon & Dunlap, 1999). The chirp signal was added at four different phases in the unmodulated EOD signal, which resulted in the chirp occurring at four different phases of the beat in the combined signal. For analyses using peak and sum conspicuousness, the conspicuousness results from the four phases were averaged to provide a single conspicuousness value for each chirp. For analyses that looked specifically at variability of conspicuousness across phase, we calculated the standard deviation of the four conspicuousness values for each chirp. We extracted the AM of the combined signals using a two-step method: 1) performing a full-wave rectification in MATLAB (Mathworks; Natick, MA, USA) and 2) using Adobe Audition (Adobe Systems; San Jose, CA, USA) to apply the FFT filter function (low-pass filter cut-off at 400 Hz, Hamming window size 32768). The DC offset was also removed with the Audition software.
2.3. EOD and AM Waveform Comparison
Waveform complexity of the EOD and the AM was quantified by comparing the difference in the power of the second or third harmonic relative to the fundamental frequency (F2-F1 or F3-F1, in dB) in each signal. Each EOD signal was temporally stretched or compressed twice, once to obtain an 800 Hz fundamental frequency and again to obtain an 810 Hz fundamental frequency. These two signals were combined with a 30% beat contrast, and the AM was extracted as described above by full-wave rectifying, low-pass filtering, and removing the DC offset. Short (~1 second) segments of both the 800 Hz EOD carrier and the AM of the combined EODs were selected in the Adobe Audition software, and a power spectrum was obtained with the frequency analysis tool (Blackman-Harris window size 65536). The power of the fundamental, second, and third harmonics was extracted from the resulting power spectrum, and the relative power of the second and third harmonics was calculated by subtracting the peak power at the fundamental frequency (F1) from the peak power at the second and third harmonic frequencies (F2 and F3). To verify that our calculation of F2-F1 and F3-F1 using the peak power did not introduce artifacts based on the shape of the peaks in the power spectrum, we calculated an average of the highest three power values for each frequency peak on a subset of EODs and AMs (~10%) and used these values to quantify F2-F1 and F3-F1. The values calculated this way were nearly identical to the values calculated using the maximum of each frequency peak. We also verified that the relationship between EOD waveform and AM waveform was robust to differences in beat contrast by examining a different subset of EOD waveforms at 1%, 5%, 10%, and 20% contrast.
2.4. Chirp Conspicuousness
We developed a custom MATLAB script to quantify chirp conspicuousness based on existing methods to compare the similarity of two signals (Gill et al., 2008; Kennedy, 2007; van Rossum, 2001). The algorithm relies on a correlation-like measure to compare the similarity in structure between a section of beat AM with a chirp and a section of beat AM without a chirp. Specifically, for a portion of chirp signal of length 2l centered on time x, the similarity value S(x) between this chirp signal C(t) and a beat excerpt B(t), both of which had their mean removed, was:
where W(t) is a Gaussian window with a width of 10, 20 or 40 ms at 10% height. Note that S(x) has the same numerator as a Pearson correlation coefficient but is normalized by a different denominator. The normalization we use allows for differences in absolute amplitude of a signal to influence S(x); thereby, a decrease in amplitude during a chirp could influence the similarity value. The value of S(x) is critically dependent on the alignment of the two signals. For example, two identical sinusoidal signals compared in antiphase would result in low similarity values. We therefore systematically varied the alignment of the signals to be compared by shifting the beat excerpt by a duration of as much as 1.67 cycles of the regular beat period. For each point x in the chirp signal the similarity value Smax(x) was taken as the maximum value of S(x) across all time shifted comparisons. Our conspicuousness measure is taken as 1-Smax(x).
The script generates a conspicuousness curve that depicts conspicuousness of the chirp file across the entire signal. The conspicuousness varies between 0 and 1, with values close to 0 indicating little difference between the beat with and without the chirp, and with values close to 1 indicating substantial chirp conspicuousness (Fig. 4). From these plots, we used two measures of chirp conspicuousness: the peak value of the conspicuousness curve and the sum of all points under the conspicuousness curve from the start of the chirp minus half the window width to the end of the chirp plus half the window width. The peak value provides information about maximal instantaneous conspicuousness, whereas the sum value is an integrated measure of conspicuousness over the duration of the chirp. These two measures of conspicuousness allow us to make predictions about how fish might detect chirps in natural contexts. We report here the results for the peak and sum values using the 20-ms window size. The peak values for the 10-ms and 40-ms windows are included in the supplementary materials. This range of window sizes was chosen to adequately sample both the beat and the chirp. The windows were long enough to contain a sufficient portion of the low frequency (10 Hz) beat alone to compare it with the beat + chirp and were within a range that would capture details of the disruption in the beat created by the chirps. Furthermore, our choice of window size was influenced by an interest in focusing on the modulation during the chirp, without the beat that precedes or follows the chirp influencing our quantification. Most of the chirps we analyzed had durations in the tens of milliseconds range. Windows that greatly exceeded the duration of the chirps would be dominated by portions of beat rather than the chirp itself. This would be a problem because chirps often cause a phase shift in the beat after the chirp. As a consequence, there is no way to align the beat both before and after the chirp to a segment of beat that does not contain a chirp (see Fig 4). Therefore, for windows much larger than the typical chirp, the conspicuousness value would not reflect how well the chirp modulation stands out against the beat background, but merely how well beat cycles surrounding the chirp can be matched and aligned to the reference beat excerpt.
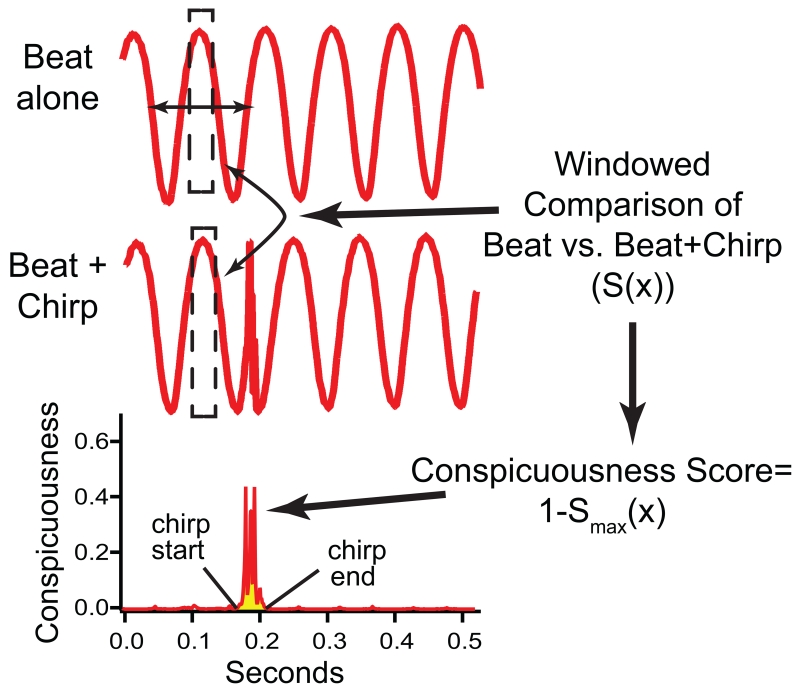
Fig. 4.
A simplified schematic of the chirp conspicuousness analysis. The AM (beat) of interacting EODs without a chirp is compared to the AM (beat) of the same EODs interacting with a chirp. The algorithm generates a conspicuousness score that is based on a windowed comparison between the beat alone vs. the beat containing the chirp (S(x), see Methods). The conspicuousness score is plotted across the duration of the signal. We report here peak conspicuousness (the maximal point in this plot) and sum conspicuousness (the area under the curve during the time that the sampling window overlaps the chirp, shaded in yellow here). Note that the red traces shown are the AM, not the original EOD. The specific parameters of the chirp displayed here caused the beat to be shifted in phase after the chirp compared to the unperturbed beat. In other words, the two signals are in phase before the chirp but nearly anti-phase after the chirp. Chirp duration and frequency jointly determine how much phase shift the chirp causes.
2.5. Heterospecific Chirp Synthesis
Species-typical chirp parameters and EOD waveform complexity are necessarily confounded by species-specific variation in these signals. That is, each species produces chirps with a specific range of parameters on a species-typical EOD waveform. These characteristics cannot be examined independently by using only naturally occurring signals. To address this problem, we developed a method for synthesizing hybrid chirps that would allow us to decouple EOD and chirp characteristics and independently examine the effects of each component on chirp conspicuousness. Constructing synthetic chirps also allowed us to investigate how chirp structure and EOD waveform interact and to test the hypothesis that chirps would be most conspicuous when they occurred on the background of conspecific EOD beats. The “ChirpSynth” algorithm was implemented in Igor Pro (Wavemetrics Version 4.09; code available on request to GTS (getsmith@indiana.edu)). Briefly, it superimposed the chirp parameters of one species on the EOD waveform of several different species. The resulting hybrid chirps could then be analyzed and compared to the same chirp re-synthesized on its own EOD waveform. The properties of chirps (EOD frequency and amplitude over time during the chirp) were calculated as described previously with autocorrelation window sizes of 3 ms and 67% window overlap (Kolodziejski et al. 2005; Turner et al. 2007). Frequency-vs.-time and amplitude-vs.-time data were then resampled at 44.1 kHz. The frequency vs. time data from the chirp were used to temporally stretch and compress an EOD recording from another fish. The amplitude vs. time data from the chirp were used to scale the EOD recording to impose the amplitude modulation of the chirp on it. The resulting signal has the chirp characteristics of one species and the EOD waveform of the same or another species (Fig. 5).
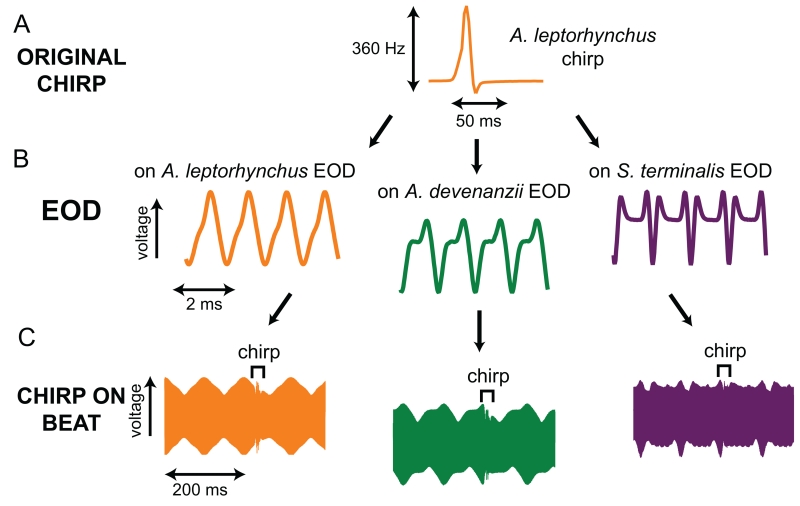
Fig. 5.
Synthesis of hybrid chirps. Parameters of A) chirps of one species were used to modulate the frequency and amplitude of B) its own and other species’ EODs of varying waveform complexity. C) The hybrid chirp was then combined with an EOD from the waveform donor species to produce 10 Hz beats. The chirp is indicated on each beat with brackets. All EODs and beats are on the same timescales shown for the A. leptorhynchus EOD and beat. The chirp shown in this example is less conspicuous on the complex S. terminalis beat than on the more sinusoidal beats.
For this analysis, we selected four species that span the range of chirp and EOD waveform diversity: A. albifrons and A. leptorhynchus, the two most widely studied species, both with two distinct chirp types and relatively sinusoidal EOD waveforms; A. devenanzii, a species with a moderately complex waveform and wide variation in chirp duration and which produces both simple chirps and chirps with multiple frequency peaks; and S. terminalis, a species with a complex EOD waveform and short, stereotyped chirps (Bastian et al., 2001; Dunlap & Larkins-Ford, 2003a; Kolodziejski et al., 2005; Turner et al., 2007; Zhou & Smith 2006). We used six chirps from A. devenanzii and S. terminalis and six small chirps and six big chirps from both A. albifrons and A. leptorhynchus. Each chirp was synthesized on all the EOD waveforms of the other species and also re-synthesized on its own waveform to control for any potential artifacts introduced during the chirp synthesis procedure (Fig. 5). Each synthetic chirp was combined with frequency-shifted EODs from the EOD waveform donor species using 10 Hz and 100 Hz DFs at 30% contrast. Chirps were analyzed for conspicuousness as described above.
2.6. Statistical Methods
Waveform complexity (F2-F1 and F3-F1) of the EOD vs. the AM of interacting EODs was analyzed using a simple linear regression. A six-step forward stepwise regression with an F-to-enter value of 1.00 was used to determine which signal features of the natural chirps and EODs had the largest impact on peak and sum chirp conspicuousness. Chirp FM, chirp duration, chirp relative decay, DF, F2-F1, and F3-F1 were entered into the stepwise regression as predictors. Chirp relative decay describes the shape of the chirp but is relatively independent of both chirp duration and chirp FM. Chirp AM is tightly correlated with chirp FM both within and across species and thus we did not include it in the analysis to avoid multicollinearity in the regressions (Turner et al., 2007). For all stepwise regression analyses, we transformed chirp FM, chirp duration, chirp relative decay, and peak conspicuousness using a natural log in order to linearize the data. For the synthetic chirps, a three-way repeated measures analysis of variance (ANOVA) was used to examine the effects of chirp species, EOD species, and DF on peak and sum chirp conspicuousness. Fisher’s Protected Least Significant Difference tests (PLSDs) were used for post-hoc analyses of significant interaction terms. All statistical analyses were performed with Statistica 7 (StatSoft Inc.; Tulsa, OK).
3. RESULTS
3.1. EOD Waveform and AM Waveform
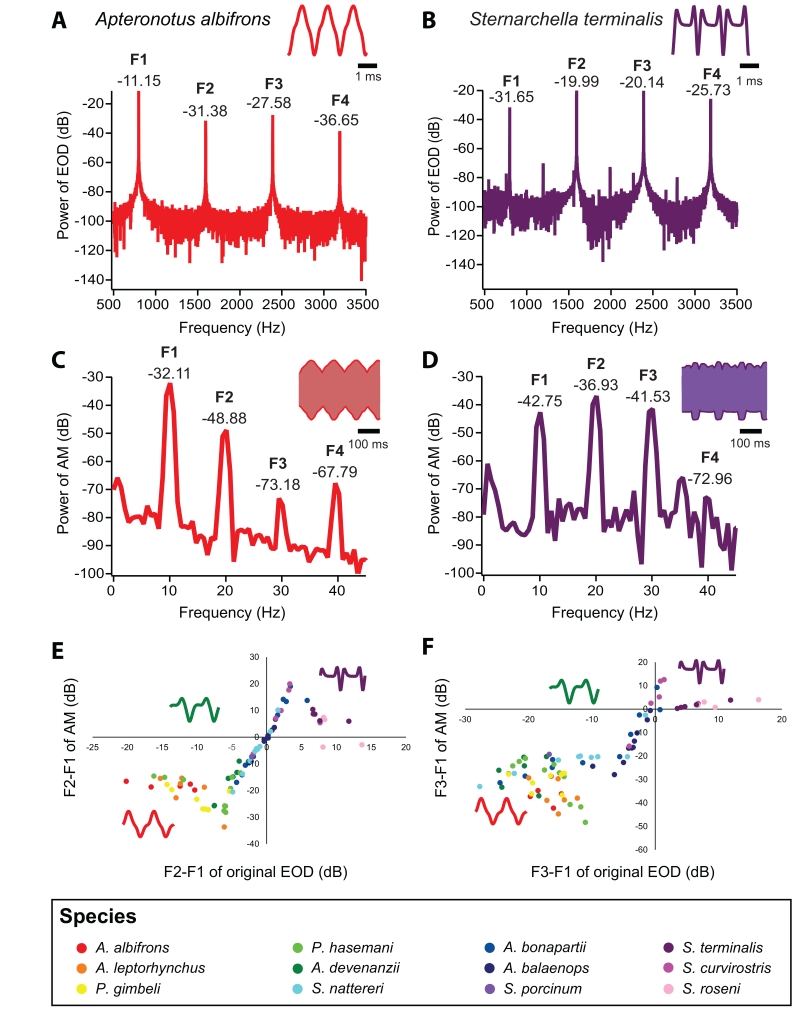
The distribution of power in the fundamental frequency (F1) and the harmonic frequencies (F2, F3, and F4) of EODs varied substantially across species, as illustrated by the power spectra of A. albifrons and S. terminalis EODs, which are the two extremes in EOD waveform complexity in our sample (Fig. 6 A&B). Correspondingly, species also varied substantially in the relative power in F1 and higher harmonics of the AM created by the interaction of two conspecific EODs (Fig. 6 C&D). Across all species, we saw a striking relationship between the waveform complexity variables (F2-F1 and F3-F1) for the EOD vs. that of the AM (Fig. 6 E&F). Small differences in waveform complexity for EODs that were of intermediate complexity were linearly transformed into corresponding differences in the complexity of the beats they created. However, there were both “ceiling” and “floor” effect nonlinearities in the relationship between EOD vs. AM waveform complexity. Thus, small differences in waveform complexity of either relatively sinusoidal EODs or highly complex EODs did not translate into comparable differences in beat complexity. This nonlinearity was robust at other behaviorally relevant beat contrasts ranging from 1% to 30%. Across the entire range of EOD complexity, the linear regression indicates R2 values of 0.59 for the relationship between EOD waveform F2-F1 vs. AM waveform F2-F1 and 0.68 for the relationship between EOD waveform F3-F1 vs. AM waveform F3-F1. For EODs of intermediate complexity, however, the linear relationship between EOD waveform complexity and AM complexity was much tighter (EOD F2-F1 between -6dB and 4 dB, R2=0.98; EOD F3-F1 between -7dB and 3 dB, R2=0.93).
Fig. 6.
Comparison of harmonic content in the waveform of the EOD and AM (beat) generated by two interacting EODs 10 Hz apart in frequency. Power spectrum of A) an A. albifrons EOD and B) a S. terminalis EOD. Both EODs were stretched and re-sampled to 800 Hz. Representative EODs are shown in the upper-right corner of each panel. F1, F2, F3, and F4 show the power spectrum peaks corresponding to the fundamental frequency, second harmonic, third harmonic, and fourth harmonic, respectively. The height of those peaks (in dB) indicates the power in each harmonic. We calculated F2-F1 and F3-F1 to quantify differences in waveform. The same analysis was done for C) the AM of two A. albifrons EODs combined at a 10 Hz DF and D) the AM of two S. terminalis EODs combined at a 10 Hz DF. The AM is denoted by the top and bottom traces on the combined EODs shown in the upper-right corner of panels C and D. Note the difference in the timescale of the EOD vs. AM traces and in the frequency scale on the X-axis of the power spectra in A vs. C and B vs. D. For A. albifrons, both the EOD waveform and the AM generated by the interacting EODs are relatively sinusoidal, and there was much more power in F1 than in F2 or F3. Conversely, for S. terminalis, the EODs and the AM are both relatively complex, and there was more power in F2 and F3 than in F1. Note that dB is a logarithmic scale. E) Relationship between F2-F1 in the EOD and F2-F1 of the AM of interacting EODs across individuals from twelve apteronotid species. This analysis arranged each fish according to waveform, with the most sinusoidal EODs on the left and the most complex EODs on the right. F2-F1 of the EOD is strongly correlated with F2-F1 of the AM in species with waveforms of intermediate complexity. Insets show representative waveforms for A. albifrons (nearly sinusoidal), A. devenanzii (moderately complex) and S. terminalis (complex). F) Relationship between F3-F1 in the EOD and F3-F1 of the AM of interacting EODs across the same fish from twelve apteronotid species. A pattern similar to that of F2-F1 emerges for the comparison of F3-F1 of the EOD to F3-F1 of the AM.
3.2. Conspicuousness of Recorded Chirps
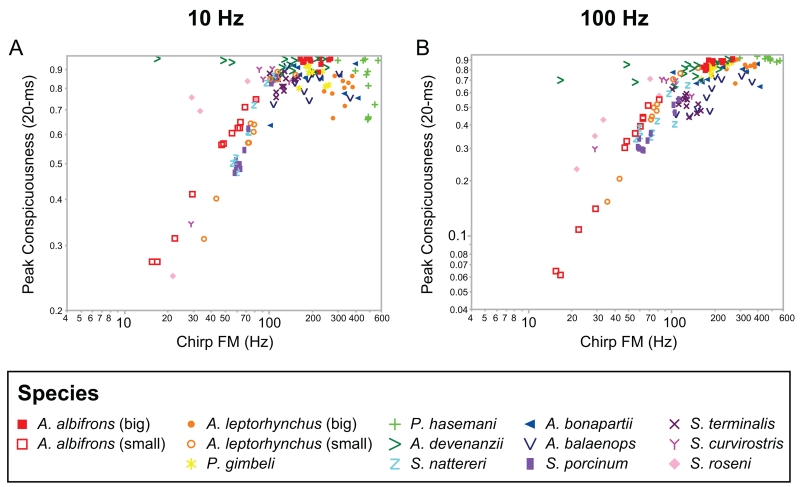
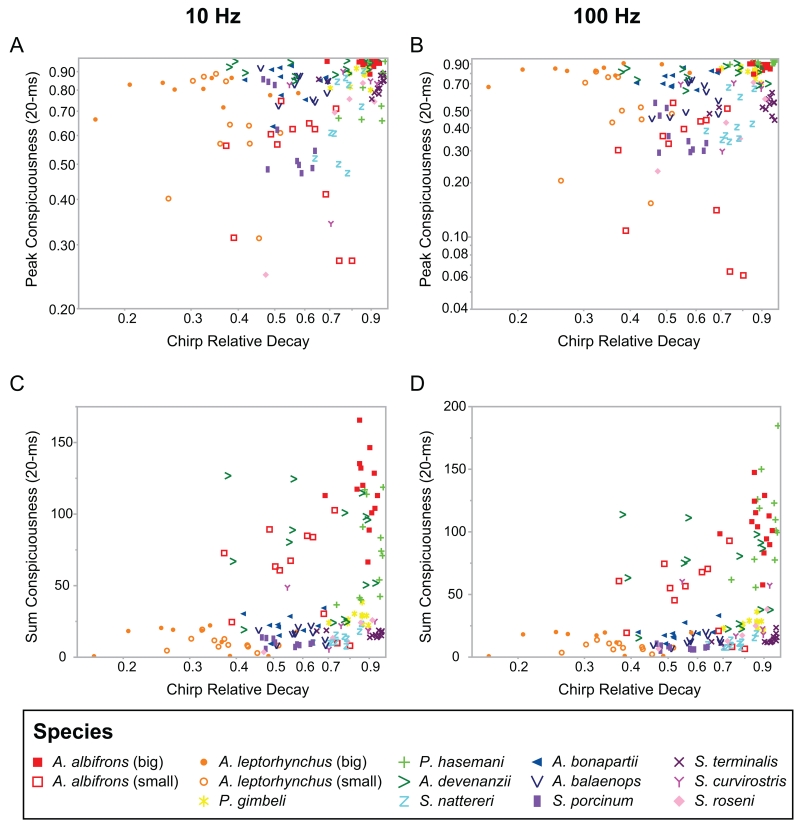
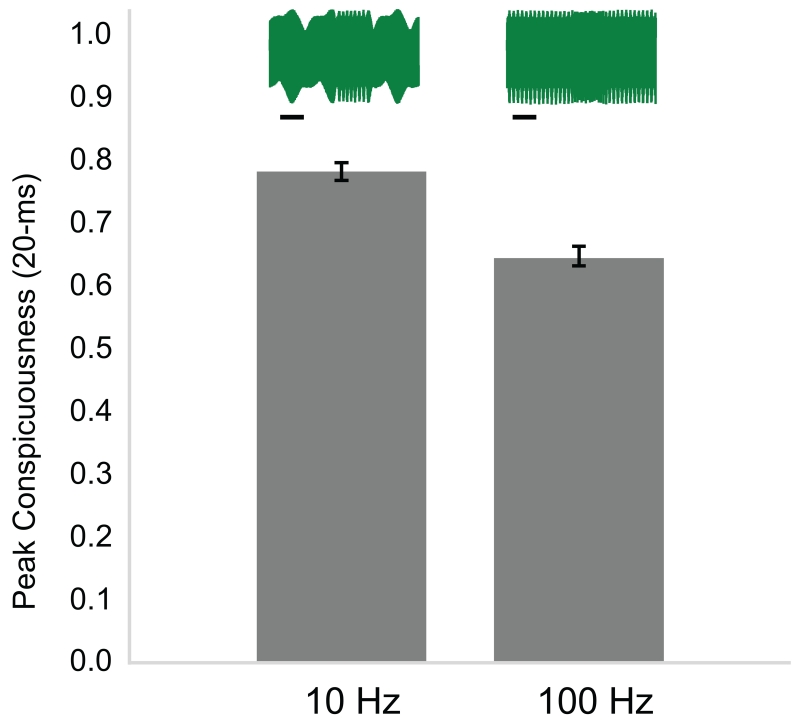
Chirp conspicuousness was influenced by properties of both the chirps themselves and of the background EOD beats on which they occurred. Chirp conspicuousness in this context refers to the degree of dissimilarity between two segments of EOD beat, one with a chirp and one without a chirp. Peak conspicuousness measures maximum instantaneous conspicuousness, whereas sum conspicuousness is an integrated measurement of conspicuousness over the duration of the chirp. In order to determine which signal parameters are likely to have the greatest impact on peak chirp conspicuousness across species, we performed a stepwise regression on all recorded chirp samples on both 10 Hz and 100 Hz DFs (beats). Chirp FM, chirp relative decay, and DF (frequency difference between the EODs) were all significant predictors of peak chirp conspicuousness using the 20-ms window (Table 1). Chirps that had a larger frequency increase were more conspicuous (Fig. 7). Chirp relative decay measures the proportion of time that the frequency was falling during the chirp. High values of chirp relative decay indicate a more abrupt chirp rise and/or a slower return to baseline, and chirps with high values of chirp relative decay were more conspicuous (Fig. 8 A&B). Chirps were also more conspicuous on a slower (10Hz) beat compared to a faster (100Hz) beat (Fig. 9; Walz, 2014). Chirp duration and EOD waveform complexity (F2-F1 and F3-F1) were not significant predictors of peak chirp conspicuousness (Supplementary Figs. 1-3). The effects of EOD and chirp parameters on peak chirp conspicuousness were consistent across analysis window sizes with two exceptions: (1) DF was a significant predictor at the two smaller window sizes but not the larger window size, and (2) the EOD waveform variable F3-F1 was significant at the largest window size (Supplementary Table 1, Supplementary Figs. 1-5).
Table 1.
Effects of EOD and Chirp Parameters on Peak and Sum Chirp Conspicuousness (20-ms window, partial correlations)
| Peak (20-ms window)1 |
Sum (20-ms window)2 |
|||
|---|---|---|---|---|
| Signal parameter | Partial correlation |
p | Partial correlation |
p |
| Chirp duration | 0.06 | 0.32 | 0.603 | <0.0001 |
| Chirp FM | 0.72 | <0.0001 | 0.28 | <0.0001 |
| Chirp relative decay | 0.17 | 0.003 | 0.30 | <0.0001 |
| DF | −0.42 | <0.0001 | −0.01 | 0.81 |
| F2-F1 | −0.002 | 0.97 | −0.25 | <0.0001 |
| F3-F1 | 0.005 | 0.94 | −0.22 | 0.0002 |
F(3, 290)=130.4, p<0.0001, R2 adj=0.57 for the multiple regression model
F(5, 288)=96.7, p<0.0001, R2 adj=0.62 for the multiple regression model
Bold values indicate variables included in the respective stepwise regression model.
Fig. 7.
Contribution of chirp FM to peak conspicuousness of natural chirps on A) a 10 Hz beat and B) a 100 Hz beat. Chirp FM and peak chirp conspicuousness are shown on a log scale. Chirps with large frequency excursions were more conspicuous (partial correlation: 0.72, p<0.0001). One notable exception to this pattern was the chirps of A. devenanzii (green > symbols), which are highly conspicuousness with low chirp FM values. This may be because these chirps have a complex, multi-peaked structure (Zhou & Smith, 2006).
Fig. 8.
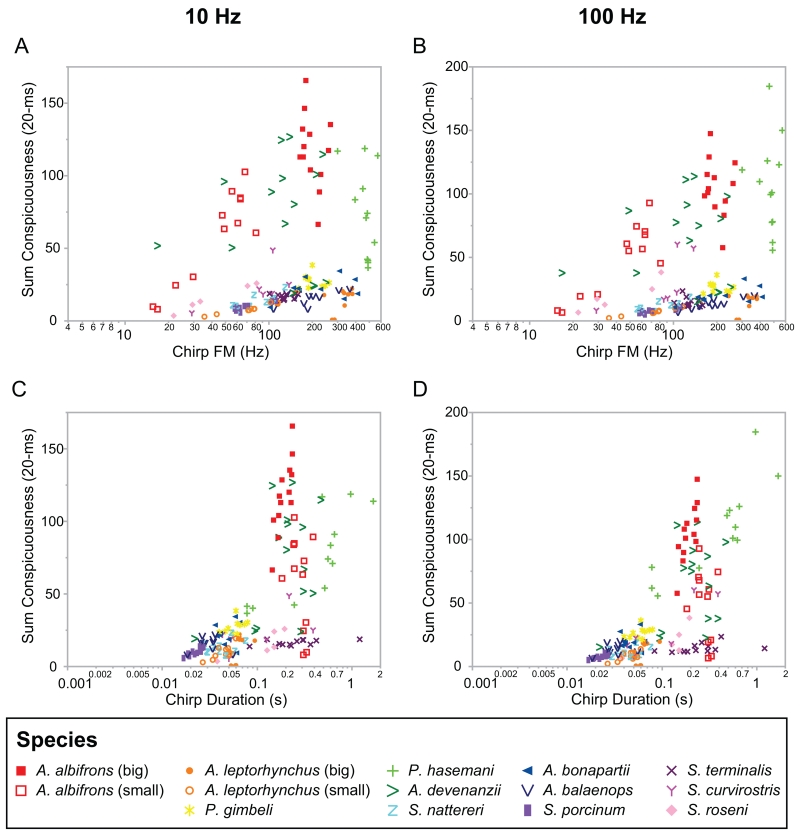
Contribution of chirp relative decay to peak (A,B) and sum (C,D) conspicuousness of natural chirps on 10 Hz (A,C) and 100 Hz (B,D) beats (20-ms analysis window). Higher values of chirp relative decay (log transformed) were significantly correlated with greater values of peak conspicuousness (partial correlation: 0.17, p=0.003). Additionally, higher values of chirp relative decay were significantly correlated with greater sum chirp conspicuousness (partial correlation: 0.30, p<0.0001). This shows that chirps that rise abruptly and/or return to baseline frequency more slowly are more conspicuous. The outlying clusters in the sum conspicuousness plots (C,D) represent chirps of species with long-duration chirps (A. albifrons, A. devenanzii, P. hasemani) that consequently have larger sum conspicuousness values.
Fig. 9.
Effect of DF on peak conspicuousness of 147 natural chirps (20-ms analysis window). Chirps were more conspicuous on a 10 Hz DF than on a 100 Hz DF (partial correlation: −0.42, <0.0001). Insets depict the same A. devenanzii chirp on a 10 Hz DF (left) and a 100 Hz DF (right). Scale bar denotes 50 ms. Error bars show one standard error from the mean.
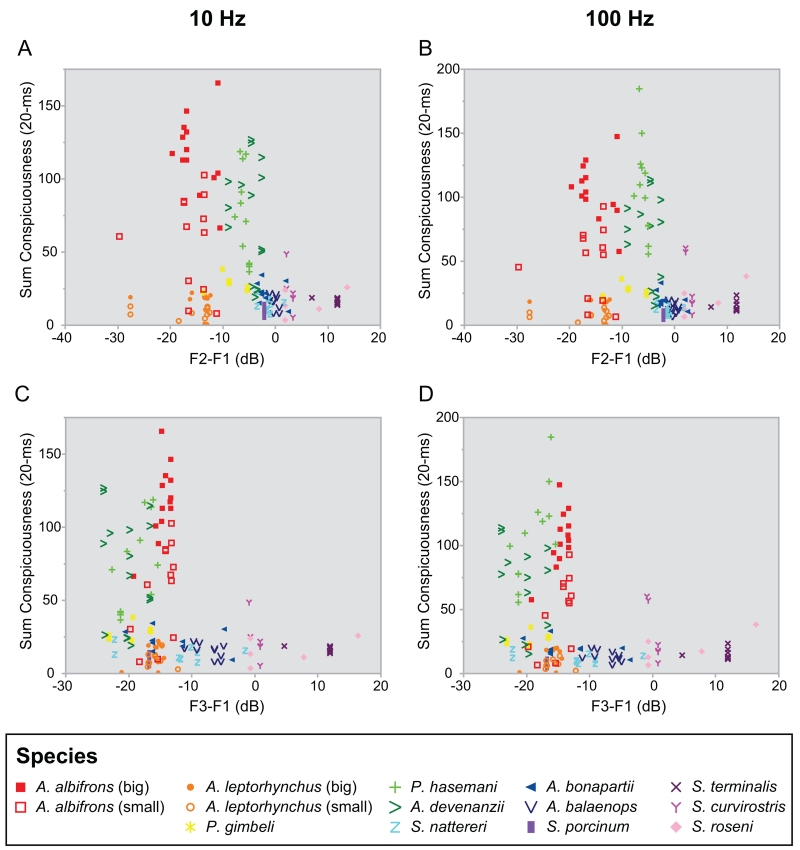
For the sum conspicuousness measure, chirp FM, chirp duration, chirp relative decay, and the EOD waveform complexity variables all significantly influenced chirp conspicuousness (20-ms window; Table 1). Chirps with greater FM, longer duration, and a prolonged relative decay time were more conspicuous (Fig. 8 C&D, Fig. 10). Chirps on more complex waveforms (higher values of F2-F1 and F3-F1) were less conspicuous relative to chirps on more sinusoidal waveforms (Fig. 11). DF was the only variable that was not a significant predictor of sum chirp conspicuousness.
Fig. 10.
Contribution of chirp FM (A,B) and chirp duration (C,D) to sum chirp conspicuousness of natural chirps on 10 Hz beats (A,C) and 100 Hz beats (B,D) (20-ms window analysis). Chirp FM (log-transformed) was a significant predictor of sum chirp conspicuousness (partial correlation 0.28, p<0.0001). Chirps with greater FM were more conspicuous. Likewise, chirp duration had a strong effect on sum conspicuousness (partial correlation 0.60, p<0.0001). Longer duration chirps were more conspicuous.
Fig. 11.
Contribution of waveform complexity (F2-F1, A,B; F3-F1, C,D) to sum chirp conspicuousness of natural chirps on 10 Hz beats (A,C) and 100 Hz beats (B,D) (20-ms analysis window). Both waveform variables were significant contributors to sum chirp conspicuousness (F2-F1 partial correlation: −0.25, p<0.0001; F3-F1 partial correlation: −0.22, p=0.0002). Chirps that naturally occur on more sinusoidal waveforms (more negative values of F2-F1) were more conspicuous. Chirps with lower values of F3-F1 were also more conspicuous. These trends appear to be driven largely by the high-frequency, long duration and/or multi-peaked chirps of P. hasemani and A. devenanzii, which naturally occur on waveforms of intermediate complexity, as well as the big and small chirps of A. albifrons.
3.3 Variation in Conspicuousness of Natural Chirps Across Phase
Conspicuousness varies depending on the phase of the beat at which the chirp occurs. We therefore used a separate stepwise regression model to determine which chirp and waveform parameters best predicted variation across phase (calculated as the standard deviation of the peak conspicuousness score). Chirp FM (log-transformed) and DF had the greatest impact on phase-related variation in conspicuousness (Supplementary Table 2). The conspicuousness of chirps with greater FM was more variable across phase. Additionally, chirp conspicuousness across phase was more variable on the 10 Hz DF than on the 100 Hz DF (Supplementary Fig. 6).
3.4. Conspicuousness of Hybrid Synthetic Chirps
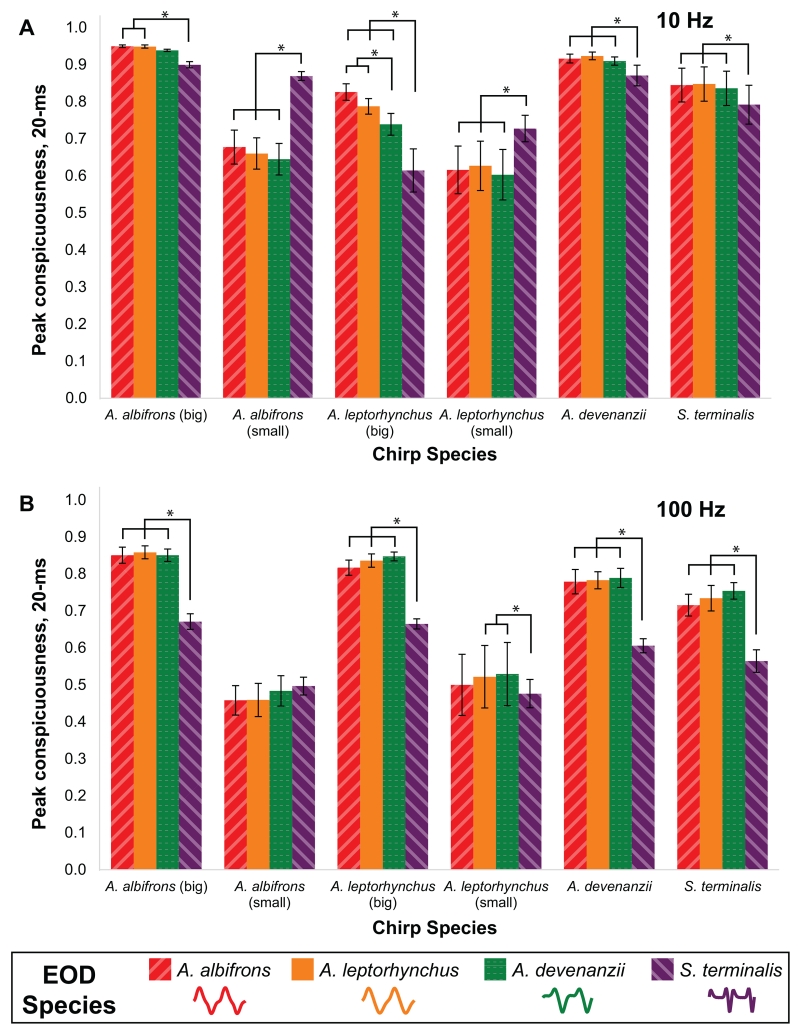
The creation of hybrid synthetic chirps allowed us to independently evaluate how chirp conspicuousness is affected by EOD waveform, since this technique enabled us to independently vary EOD waveform while keeping the parameters of a particular chirp constant. Chirp species, EOD species, DF, and all associated interactions significantly affected peak conspicuousness (Table 2). Species-specific chirp structure robustly affected conspicuousness (Fig. 12). Small chirps of both A. leptorhynchus and A. albifrons were generally less conspicuous than big chirps. Most chirps were less conspicuous on the complex EOD waveform (S. terminalis) than on the sinusoidal and intermediate EOD waveforms. The two notable exceptions to this trend were the A. leptorhyncus and A. albifrons small chirps on the 10 Hz beat, which were more conspicuous on the complex waveform. As with the natural chirps, the hybrid chirps were more conspicuous on a 10 Hz beat than on a 100 Hz beat. Additionally, the decrease in conspicuousness that occurred for most chirps on the complex waveform relative to the sinusoidal or intermediate waveforms was exaggerated on the 100 Hz beat. Finally, we did not see a pattern whereby chirp types were maximally conspicuous on conspecific EODs. In fact, S. terminalis chirps had greater mean peak conspicuousness on the three heterospecific EODs than on the conspecific EOD for both DFs, and, at least for the 10 Hz beat, the small chirps of A. albifrons and A. leptorhynchus were much more conspicuous on the S. terminalis EOD waveform. The 10-ms and 40-ms windows showed the same general trends as the 20-ms window (Supplementary Table 1). However, when analyzed with the 10-ms window, the S. terminalis chirps were most conspicuous on their own complex EOD at the 10 Hz DF and showed no differences in conspicuousness based on EOD waveform at the 100 Hz DF (Supplementary Fig. 7). In the analysis using a 40-ms window, we saw the same general trends as the 20-ms window, although some of these effects were weakened or missing, likely due to most chirps being near the maximal peak conspicuousness value on most EODs (Supplementary Fig. 8).
Table 2.
Effects of EOD and Chirp Parameters on Peak Conspicuousness of Hybrid/Synthetic Chirps (20-ms window)
| 3 Factor, Repeated Measures ANOVA Results | |||
|---|---|---|---|
| d.f. | F | p | |
| Chirp Species | 5 | 12.84 | <0.0001 |
| DF | 1 | 147.90 | <0.0001 |
| DF*Chirp Species | 5 | 14.09 | <0.0001 |
| EOD Species | 3 | 25.28 | <0.0001 |
| EOD Species*Chirp Species | 15 | 15.27 | <0.0001 |
| DF*EOD Species | 3 | 62.68 | <0.0001 |
| DF*EOD Species*Chirp Species | 15 | 3.22 | 0.0003 |
Fig. 12.
Peak conspicuousness of hybrid chirps using a 20-ms window. Chirps from four species (including two different types of A. leptorhynchus and A. albifrons chirps, n=6 from each species/chirp type) were re-synthesized on the waveform of all four species, including the waveform of the species from which the chirp came. The bars within each chirp type are arranged from most sinusoidal (A. albifrons) to most complex (S. terminalis) EOD waveform. The chirps were combined with an EOD from the waveform donor species to measure peak conspicuousness on a A) 10 Hz beat and B) 100 Hz beat. Asterisks indicate statistically significant differences (p<0.05, Fisher PLSD) between the conspicuousness of chirps on different species-specific EOD waveforms. Error bars show one standard error from the mean.
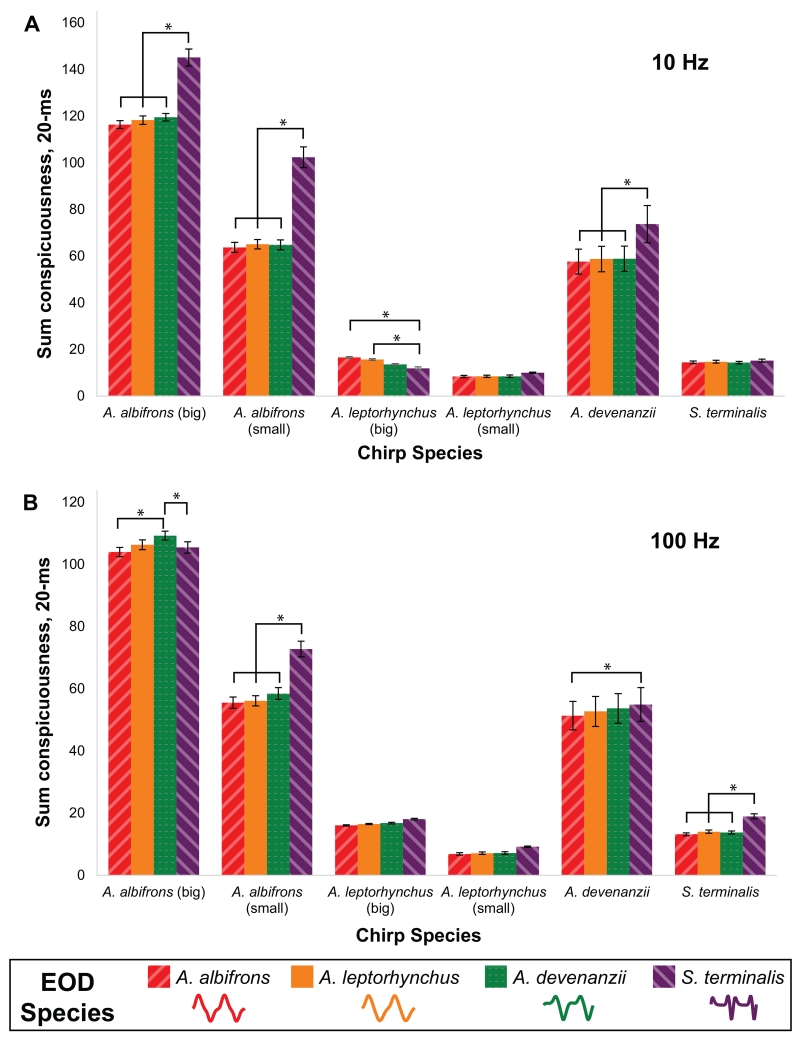
Chirp species, EOD species, and DF also significantly influenced sum chirp conspicuousness of the hybrid chirps (20-ms window; Table 3). One of the most striking comparisons for this measure of conspicuousness is the variability in conspicuousness across different chirp species and types (Fig. 13). On both the 10 Hz and 100 Hz beat, A. albifrons big and small chirps and A. devenanzii chirps were substantially more conspicuous than A. leptorhynchus big and small chirps and S. terminalis chirps. Interestingly, the A. albifrons big and small chirps and A. devenanzii chirps were also all more conspicuous on the complex EOD waveforms relative to the sinusoidal or intermediate EOD waveforms. S. terminalis chirps also had greater sum conspicuousness on its own EOD for the 100 Hz DF. Thus, the two measures of conspicuousness (peak and sum) give us different results when examining whether chirps are more or less conspicuous on complex waveforms relative to more sinusoidal waveforms.
Table 3.
Effects of EOD and Chirp Parameters on Sum Conspicuousness of Hybrid/Synthetic Chirps (20-ms window)
| 3 Factor, Repeated Measures ANOVA Results | |||
|---|---|---|---|
| d.f. | F | p | |
| Chirp Species | 5 | 45.63 | <0.0001 |
| DF | 1 | 88.79 | <0.0001 |
| DF*Chirp Species | 5 | 24.04 | <0.0001 |
| EOD Species | 3 | 44.49 | <0.0001 |
| EOD Species*Chirp Species | 15 | 10.14 | <0.0001 |
| DF*EOD Species | 3 | 37.52 | <0.0001 |
| DF*EOD Species*Chirp Species | 15 | 16.28 | <0.0001 |
Fig. 13.
Sum conspicuousness of hybrid chirps using a 20-ms window. Chirps from four species (including two different types of A. leptorhynchus and A. albifrons chirps, n=6 from each species/chirp type) were re-synthesized on the waveform of all four species, including the waveform of the species from which the chirp came. The bars within each chirp type are arranged from most sinusoidal (A. albifrons) to most complex (S. terminalis) EOD waveform. The chirps were combined with an EOD from the waveform donor species to measure sum conspicuousness on a A) 10 Hz beat and B) 100 Hz beat. Asterisks indicate statistically significant differences (p<0.05, Fisher PLSD) between the conspicuousness of chirps on different species-specific EOD waveforms. Error bars show one standard error from the mean.
4. DISCUSSION
4.1. AM Waveform Contains Information About EOD Waveform
The question of whether EOD waveform – which varies substantially across species – is both discriminable and socially relevant for weakly electric fish has not yet been conclusively established. There is evidence that at least some species can be trained to discriminate between signals based on EOD waveform alone and that untrained fish show a preference for certain EOD waveforms over others (Kramer, 1999; Kramer & Otto, 1988). Additionally, free-swimming A. leptorhynchus males chirped more robustly to playbacks of A. leptorhynchus EODs compared to sine waves of the same frequency, indicating that waveform may contain social information (Dunlap & Larkins-Ford, 2003b). However, free-swimming A. leptorhynchus did not preferentially approach conspecific (quasi-sinusoidal) waveforms relative to heterospecific (complex) waveforms and did not chirp more toward the conspecific waveforms in a chirp chamber (Fugère & Krahe, 2010).
If EOD waveform is indeed socially relevant, there are at least two potential ways in which the information could be used. First, EOD waveform may allow fish to make broad species-level distinctions between conspecific and heterospecific fish. This could be useful in social contexts in which suitable habitat is co-occupied by two or more species of weakly electric fish. In areas with high species richness, EOD frequency ranges overlap substantially, making EOD frequency alone insufficient for determining the species of a nearby individual (Kramer et al., 1981). Discriminant function analysis suggests that the inclusion of EOD waveform information alongside EOD frequency significantly enhances the power to discriminate among species based on EOD information alone (Turner, 2007). Second, and perhaps additionally, fish could potentially make finer waveform discriminations to get more detailed information about individual characteristics, such as sex or quality, or to make discriminations between species that have very similar EOD waveforms (Kramer & Otto, 1988). Generally, analyses of signal transmission and sensory perception among these animals have focused on the response of P-type tuberous receptors to the AM of the beat (Hopkins, 1976; Hopkins, 1988; Scheich et al., 1973; Walz et al., 2013; but see Stöckl et al., 2014). We demonstrate here that two interacting EODs that differ a lot in waveform should be easily distinguishable based on the AM they produce when they interact. Thus, a species with a very sinusoidal waveform should be able to distinguish a conspecific from a species with a very complex waveform and vice versa. For fish with EODs of intermediate complexity, EOD harmonic content is strongly correlated with AM harmonic content, making the finer extraction of EOD waveform detail from the AM waveform theoretically more feasible. However, because this linear relationship between EOD waveform and AM waveform falls apart for sinusoidal and very complex EODs, species that have EODs at these extremes probably cannot make such fine distinctions of within-species variation in EOD waveform based solely on beat structure.
Nevertheless, if EOD waveform is indeed a biologically relevant signal parameter, there are likely other sources of sensory input (such as information about phase modulation from T-type electroreceptors) that may allow fish to glean waveform information during an interaction with another fish. Phase modulation, like amplitude modulation, occurs at a frequency that is equal to the DF, and detection of phase modulation is an essential component of the jamming avoidance response (Heiligenberg, 1989; Heiligenberg et al., 1978). The pattern of phase modulation might differ as a function of EOD waveform and could therefore provide information about EOD waveform. Spatial information is also likely to be an important factor in waveform identification. Because the EOD is not spatially uniform, the beat waveform that is perceived by electroreceptors likely varies with where the electroreceptors are located on the fish’s body and with the position and orientation of the other fish (Assad et al., 1999). Without additional data, it is difficult to speculate as to whether local variations in waveform would simplify or complicate waveform discrimination. Further behavioral and neurophysiological experiments should explore whether fish are able to discriminate minor and/or major variation in EOD waveform and, if so, examine the neurosensory mechanisms for processing EOD and beat waveforms.
4.2. Chirp Parameters Impact Conspicuousness
Chirp FM was consistently the strongest predictor of peak chirp conspicuousness. Chirp relative decay, chirp duration, and/or DF also influenced chirp conspicuousness, depending on the measure of conspicuousness and the window size used. The two different measures of conspicuousness (peak and sum) were not always in strict agreement and led to different conclusions about the relative conspicuousness of different chirp parameters and chirp types on varying EOD waveforms and DFs. For example, the sum conspicuousness measure of the hybrid chirps led us to conclude that A. albifrons big and small chirps and A. devenanzii chirps are substantially more conspicuous than A. leptorhynchus big and small chirps and S. terminalis chirps, but the peak conspicuousness measure does not support this conclusion. The difference between findings with peak and sum conspicuousness are primarily due to the fact that sum chirp conspicuousness is highly sensitive to chirp duration, and A. albifrons and A. devenanzii chirps are longer than A. leptorhynchus or S. terminalis chirps. The relevance of these differences in peak vs. sum estimates of chirp conspicuousness might be resolved by a greater understanding of how the electrosensory system actually encodes “conspicuousness” across the natural range of signal variation. Because peak and sum conspicuousness are two ways of quantifying the same conspicuousness curve, the interpretation of the peak vs. sum measures may tell us something about the relative importance of instantaneous vs. longer-duration deviations in the beat for detecting signals. Similarly, the slight variation we see across our selected window sizes suggests that conspicuousness is likely to vary based on how the electrosensory system samples the amplitude modulation. If chirp-detecting circuits are attuned to disruptions in the beat over short timescales, they would likely perceive chirps in a manner consistent with our shorter windows/peak conspicuousness measure. If, however, chirp-detecting circuits integrate beat structure over longer timescales, they are more likely to perceive chirps in a manner consistent with the longer windows/sum conspicuousness measure.
Chirps often cause a phase shift of the beat after the chirp relative to the phase of the beat before the chirp (see Fig 4 and the corresponding legend). We chose analysis window sizes that were typically on the same order of magnitude as the duration of most chirps (i.e., 10-40 ms) so that this phase shift did not dominate the conspicuousness value. Our measure of conspicuousness thus focuses on disruption of the beat during the chirp itself, rather than a comparison of beat phase before vs. after the chirp. It is conceivable, however, that this phase shift could serve as a cue to detect the presence of the chirp that would not be well-represented in our conspicuousness measure. If this were so, chirp conspicuousness would be related to chirp properties in a complex way: i.e., small changes in chirp duration or FM would cause very large differences in phase shift/conspicuousness. For example, a small chirp of 14-ms and 60 Hz Gaussian frequency excursion might cause a 180° phase shift, whereas a 17-ms, 90 Hz chirp might cause no phase shift, and increasing chirp size/duration slightly more to 19 ms and 120 Hz chirp would again produce a 180° phase shift. If this phase shift determined how chirps were detected, we might predict that chirp parameters would cluster around those that maximized phase shift and avoid those that produced smaller phase shifts. Such a pattern is not apparent in the chirps of most species, which are largely continuously distributed in FM-duration space (Turner et al. 2007). Behavioral experiments that explicitly test detection of chirps that produce different phase shifts are needed to test whether the disruption of the beat during the chirp or the phase shift of the beat before vs. after the chirp are the critical factors in chirp detection.
In addition to shifting the phase relationship between the beat before vs. after the chirp, chirps themselves can occur at different phases of the beat. We found that chirp conspicuousness varied somewhat depending on beat phase at which the chirps occurred and that variation in chirp conspicuousness across beat phase was influenced by chirp and EOD parameters (Supplementary Fig. 2). This suggests that beat phase, and its interaction with the structure of chirps and EODs, might influence the detectability of chirps. Findings that chirps are not produced preferentially at particular beat phases and that fish produce similar behavioral responses to chirps occurring at different beat phases suggest that phase might not affect chirp discrimination (Zupanc and Maler 1993; Walz et al. 2013; Aumentado-Amstrong et al, 2015; Metzen et al, 2016). Nevertheless, studies of responses to chirps at different beat phases have typically used quite conspicuous chirp stimuli and measured behavioral preferences rather than explicitly testing whether beat phase affects the sensitivity of the fish to detect the chirps. Behavioral and electrophysiological experiments designed to test chirp detection under more challenging conditions (e.g. subtle chirps on reduced contrast beats and/or in noisy backgrounds) are needed to more fully test whether beat phase influences the ability of fish to detect chirps.
4.3 Hybrid Chirps Reveal the Complex Interplay among EOD Waveform, Chirp Parameters, and DF
Synthesizing hybrid chirps from several species on conspecific and heterospecific EODs allowed us to systematically investigate how signal context influences chirp conspicuousness. Signal context for chirps is dependent on features not just of the chirps themselves but also of the interacting EODs that generate the beat. Our results show that these animals live in complex sensory environments, producing and perceiving signals whose conspicuousness is simultaneously influenced by species-typical chirp parameters, EOD waveform, and beat frequency. We saw species-specific effects of chirp parameters similar to the natural chirp conspicuousness analysis, indicating that species-typical chirps or chirp types that tend toward greater FM and longer duration are more conspicuous in general and that chirps are usually more conspicuous on a slow beat (10 Hz) than a fast beat (100 Hz). We also saw an interesting effect of EOD waveform in that chirps were often equally conspicuous on the two quasi-sinusoidal EOD waveforms (A. albifrons and A. leptorhynchus) and the intermediate EOD waveform (A. devenanzii) but less conspicuous on the complex EOD waveform (S. terminalis). This is the case for all chirp types except A. albifrons small chirps, which show the opposite trend. A. albifrons small chirps were more conspicuous on the S. terminalis EOD waveform on the 10 Hz beat but not the 100 Hz beat. A likely explanation for this exception is based on the fact that the second harmonic of the S. terminalis beat has more power than the fundamental frequency, which effectively doubles the DF. Since P-units better encode (i.e., synchronize better to) small chirps as DF increases up to about 50 Hz, A. leptorhynchus small chirps might be more conspicuous on the S. terminalis waveform because the distribution of power in the beat waveform makes this effectively more like a 20 Hz DF instead of a 10 Hz DF (Benda et al., 2006; Walz et al., 2014). The pattern of increased conspicuousness of the small chirp on the complex waveform beat disappears in the 100 Hz DF condition because in that case the DF for the S. terminalis beat is effectively 200 Hz, and small chirps are not encoded well on very high DFs.
4.4 Co-Adaptation of Chirps and EODs May Be Influenced By Sociality
Regardless of the strong EOD waveform effect, we did not find strong support for a strict co-adaptation of EOD waveform and chirp structure to maximize chirp conspicuousness on conspecific EODs. In other words, chirps were not always more conspicuous on their own species’ EODs. There could be other environmental factors that complicate signal perception and help explain why this is the case. For example, it seems likely that differences in sociality (e.g., degree of territoriality or gregariousness) may play a large role in determining how chirps and EODs are molded by evolution. Our model used two interacting EODs, but many highly social species are routinely found in lively social groups of a dozen or more individuals (Kramer et al., 1981; McNeil et al., 2014). The simultaneous interactions of all these EODs with each other and with the amplitude modulations created by the interactions of these EODs creates a beat structure that is far more complex than that of two interacting EODs. This extraordinarily complex sensory environment likely makes it even more difficult to detect chirps and to discriminate among them. Among territorial species, social interactions are unlikely to occur in the presence of more than one or two other EODs, which would make the extraction of relevant information a less complicated process. Thus, one possibility is that the relationship among chirp parameters, EOD waveform, DF, and conspicuousness is itself influenced by the presence of complex social beats (gregarious species) or more simple beats (territorial species). It is likely, then, that the features of chirps that make them more or less conspicuous are tailored to the unique signal environment (EOD waveform, DF, number of electrically signaling animals nearby) and may differ across physical and social environment. Additionally, the degree of aggression or level of competition for mates within the social structure of a species might optimize sensory processing to emphasize certain chirp types or chirp features. For example, rapid detection may be more important for aggressive chirps used to threaten attack or to appease an attacker, but other features might be useful for attracting or judging the quality of a mate. One possible way to expand the model of chirp conspicuousness would be to include information about group size, species-typical EOD range, and territoriality in order to model naturally occurring signal contexts. This would allow us to gain more insight into how EODs, chirping, and sociality influence the evolution of electrocommunication across species.
4.5 Chirp Encoding Likely Varies With Species-Typical Chirp Properties
Although our measures of chirp conspicuousness reflect properties of chirps and beats that make the chirps embedded in the beat different from the beat alone (and thus potentially more detectable), the fishes’ ability to actually detect chirps may depend both on the signal properties that we analyzed as well as on the environment (e.g. noise) and the sensory systems of receivers. Generally, our evidence suggests that the encoding of chirps by the electrosensory system is likely influenced by the features of the chirps themselves. Recent work in A. leptorhynchus shows that the encoding of different chirp types in the electroreceptive periphery is based on a pattern of synchronization (small chirps) or de-synchronization (big chirps) of firing across the population of electroreceptor cells (Benda et al., 2006). Small chirps on slow beats cause P-units to synchronize their firing and big chirps on fast beats cause P-unit firing to desynchronize, relative to the response of P-units to the beat alone. This pattern is thought to enhance the rapid detection of aggressive signals (small chirps on slow beats) while also allowing for the finer discrimination of signal parameters – and thus potentially signaler quality – during courtship signals (big chirps on fast beats; reviewed in Marsat et al., 2012). In the electrosensory lateral line lobe (ELL) of A. leptorhynchus, two distinct populations of cells are responsible for encoding the two chirp types. E-type pyramidal cells encode small chirps on slow beats with a bursting code that is optimized for signal detection but does not allow fine discrimination. Conversely, big chirps are encoded with a graded, heterogeneous code by I-type pyramidal cells that preserve information about fine details of chirps (Marsat et al., 2012). Thus, in the one species in which the electroreceptive encoding of chirps is best studied, there is clear evidence of adaptation of specific sensory mechanisms that link signal structure to how signals are detected and how the information the signals convey is encoded. Importantly, recent evidence suggests that neurons in the midbrain may have invariant responses to chirps at differing beat phases and that phase differences in chirp presentation may not affect behavioral responses (Aumentado-Armstrong, 2015; Metzen et al., 2016). More information about higher-order processing and behavioral responses across species will elucidate whether beat phase in particular is an important factor in the perception of chirps among weakly electric fish.
The current study shows that variation in chirp and EOD parameters (waveform, DF) across species has a strong potential to influence how chirps are embedded in the beat. This raises the question of how and whether electrosensory systems of other apteronotid species might be adapted to species-level variation in chirp structure to optimize chirp detection and encoding of fine differences in chirp structure. Therefore, species with extreme or unusual EODs or chirps may have novel and interesting ways of encoding signals.
Supplementary Material
Highlights.
We examined how 2 electric communication signals interact on the same sensory channel
We present a new method for quantifying conspicuousness of electric fish chirps
Species-specific properties of both chirps and EODs affect chirp conspicuousness
Chirps and EODs do not tightly co-evolve to maximize chirp conspicuousness
Species-specific EOD waveform is encoded in the AM of two interacting EODs
ACKNOWLEDGMENTS
This research was supported by National Science Foundation IOS 0950721 (GTS) and IOS 1557935 (GTS, GM), National Institutes of Health T32HD049336 (Common Themes in Reproductive Diversity training grant, JMP), and the Center for the Integrative Study of Animal Behavior at Indiana University. This research was also supported in part by Lilly Endowment, Inc. through its support for the Indiana University Pervasive Technology Institute, and in part by the Indiana METACyt Initiative.
Footnotes
Publisher's Disclaimer: This is a PDF file of an unedited manuscript that has been accepted for publication. As a service to our customers we are providing this early version of the manuscript. The manuscript will undergo copyediting, typesetting, and review of the resulting proof before it is published in its final citable form. Please note that during the production process errors may be discovered which could affect the content, and all legal disclaimers that apply to the journal pertain.
REFERENCES
- Assad C, Rasnow B, Stoddard PK. Electric organ discharges and electric images during electrolocation. Journal of Experimental Biology. 1999;202:1185–1193. doi: 10.1242/jeb.202.10.1185. [DOI] [PubMed] [Google Scholar]
- Aumentado-Armstrong T, Metzen MG, Sproule MKJ, Chacron MJ. Electrosensory midbrain neurons display feature invariant responses to natural communication stimuli. Plos Computational Biology. 2015;11:e1004430. doi: 10.1371/journal.pcbi.1004430. [DOI] [PMC free article] [PubMed] [Google Scholar]
- Bastian J, Schniederjan S, Nguyenkim J. Arginine vasotocin modulates a sexually dimorphic communication behavior in the weakly electric fish Apteronotus leptorhynchus. Journal of Experimental Biology. 2001;204:1909–1924. doi: 10.1242/jeb.204.11.1909. [DOI] [PubMed] [Google Scholar]
- Benda J, Longtin A, Maler L. Spike-frequency adaptation separates transient communication signals from background oscillations. Journal of Neuroscience. 2005;25:2312–2321. doi: 10.1523/JNEUROSCI.4795-04.2005. [DOI] [PMC free article] [PubMed] [Google Scholar]
- Benda J, Longtin A, Maler L. A synchronization-desynchronization code for natural communication signals. Neuron. 2006;52:347–358. doi: 10.1016/j.neuron.2006.08.008. [DOI] [PubMed] [Google Scholar]
- Bullock TH, Hamstra RH, Scheich H. Jamming avoidance response of high-frequency electric fish. 1. General features. Journal of Comparative Physiology. 1972;77:1–22. [Google Scholar]
- Denis D, Blatrix R, Fresneau D. How an ant manages to display individual and colonial signals by using the same channel. Journal of Chemical Ecology. 2006;32:1647–1661. doi: 10.1007/s10886-006-9099-7. [DOI] [PubMed] [Google Scholar]
- Dunlap KD, Larkins-Ford J. Diversity in the structure of electrocommunication signals within a genus of electric fish, Apteronotus. Journal of Comparative Physiology A-Neuroethology Sensory Neural and Behavioral Physiology. 2003a;189:153–161. doi: 10.1007/s00359-003-0393-3. [DOI] [PubMed] [Google Scholar]
- Dunlap KD, Larkins-Ford J. Production of aggressive electrocommunication signals to progressively realistic social stimuli in male Apteronotus leptorhynchus. Ethology. 2003b;109:243–258. [Google Scholar]
- Fortune ES, Rose GJ, Kawasaki M. Encoding and processing biologically relevant temporal information in electrosensory systems. Journal of Comparative Physiology A-Neuroethology Sensory Neural and Behavioral Physiology. 2006;192:625–635. doi: 10.1007/s00359-006-0102-0. [DOI] [PubMed] [Google Scholar]
- Fugère V, Krahe R. Electric signals and species recognition in the wave-type gymnotiform fish Apteronotus leptorhynchus. Journal of Experimental Biology. 2010;213:225–236. doi: 10.1242/jeb.034751. [DOI] [PubMed] [Google Scholar]
- Gill P, Woolley SMN, Fremouw T, Theunissen FE. What’s that sound? Auditory area CLM encodes stimulus surprise, not intensity or intensity changes. Journal of Neurophysiology. 2008;99:2809–2820. doi: 10.1152/jn.01270.2007. [DOI] [PubMed] [Google Scholar]
- Hagedorn M, Heiligenberg W. Court and spark - electric signals in the courtship and mating of gymnotid fish. Animal Behaviour. 1985;33:254–265. [Google Scholar]
- Hebets EA, Papaj DR. Complex signal function: developing a framework of testable hypotheses. Behavioral Ecology and Sociobiology. 2005;57:197–214. [Google Scholar]
- Heiligenberg W. Coding and processing of electrosensory information in gymnotiform fish. Journal of Experimental Biology. 1989;146:255–275. doi: 10.1242/jeb.146.1.255. [DOI] [PubMed] [Google Scholar]
- Heiligenberg W, Baker C, Matsubara J. Jamming avoidance-response in Eigenmannia revisited - structure of a neuronal democracy. Journal of Comparative Physiology. 1978;127:267–286. [Google Scholar]
- Higham JP, Hebets EA. An introduction to multimodal communication. Behavioral Ecology and Sociobiology. 2013;67:1381–1388. [Google Scholar]
- Ho WW, Fernandes CC, Alves-Gomes JA, Smith GT. Sex Differences in the Electrocommunication Signals of the Electric Fish Apteronotus bonapartii. Ethology. 2010;116:1050–1064. doi: 10.1111/j.1439-0310.2010.01823.x. [DOI] [PMC free article] [PubMed] [Google Scholar]
- Ho WW, Turner CR, Formby KJ, Smith GT. Sex differences in the electrocommunication signals of Sternarchogiton nattereri (Gymnotiformes: Apteronotidae) Journal of Ethology. 2013;31:335–340. [Google Scholar]
- Hopkins CD. Stimulus filtering and electroreception: Tuberous electroreceptors in three species of Gymnotid fish. Journal of Comparative Physiology. 1976;111:171–207. [Google Scholar]
- Hopkins CD. Neuroethology of electric communication. Annual Review of Neuroscience. 1988;11:497–535. doi: 10.1146/annurev.ne.11.030188.002433. [DOI] [PubMed] [Google Scholar]
- Hupé GJ, Lewis JE, Benda J. The effect of difference frequency on electrocommunication: Chirp production and encoding in a species of weakly electric fish, Apteronotus leptorhynchus. Journal of Physiology-Paris. 2008;102:164–172. doi: 10.1016/j.jphysparis.2008.10.013. [DOI] [PubMed] [Google Scholar]
- Kennedy HL, IEEE A new statistical measure of signal similarity. Information Decision and Control. 2007:112–117. [Google Scholar]
- Kolodziejski JA, Nelson BS, Smith GT. Sex and species differences in neuromodulatory input to a premotor nucleus: A comparative study of substance P and communication behavior in weakly electric fish. Journal of Neurobiology. 2005;62:299–315. doi: 10.1002/neu.20095. [DOI] [PubMed] [Google Scholar]
- Kramer B. Waveform discrimination, phase sensitivity and jamming avoidance in a wave-type electric fish. Journal of Experimental Biology. 1999;202:1387–98. doi: 10.1242/jeb.202.10.1387. [DOI] [PubMed] [Google Scholar]
- Kramer B, Kirschbaum F, Markl H. Species specificity of electric organ discharges in a sympatric group of gymnotoid fish from Manaus (Amazonas) Advances in Physiological Sciences. 1981;31:195–217. [Google Scholar]
- Kramer B, Otto B. Female discharges are more electrifying - spontaneous preference in the electric fish, Eigenmannia (Gymnotiformes, Teleostei) Behavioral Ecology and Sociobiology. 1988;23:55–60. [Google Scholar]
- Kramer B, Otto B. Wave-form discrimination in the electric fish Eigenmannia - Sensitivity for the phase differences between spectral components of a stimulus wave. Journal of Experimental Biology. 1991;159:1–22. [Google Scholar]
- Larimer JL, Macdonald JA. Sensory feedback from electroreceptors to electromotor pacemaker centers in gymnotids. American Journal of Physiology. 1968;214:1253–1261. doi: 10.1152/ajplegacy.1968.214.6.1253. [DOI] [PubMed] [Google Scholar]
- Marsat G, Longtin A, Maler L. Cellular and circuit properties supporting different sensory coding strategies in electric fish and other systems. Current Opinion in Neurobiology. 2012;22:686–692. doi: 10.1016/j.conb.2012.01.009. [DOI] [PubMed] [Google Scholar]
- McNeil ER, Skinner MA, Smith GT. Sociality, reproductive condition, and communication in a weakly electric fish. Integrative and Comparative Biology. 2014;54:E316. [Google Scholar]
- Metzen MG, Hofmann V, Chacron MJ. Neural correlations enable invariant coding and perception of natural stimuli in weakly electric fish. eLife. 2016;5:e12993. doi: 10.7554/eLife.12993. 2016. [DOI] [PMC free article] [PubMed] [Google Scholar]
- Meyer JH, Leong M, Keller CH. Hormone-induced and maturational changes in electric organ discharges and electroreceptor tuning in the weakly electric fish Apteronotus. Journal of Comparative Physiology A-Sensory Neural and Behavioral Physiology. 1987;160:385–394. doi: 10.1007/BF00613028. [DOI] [PubMed] [Google Scholar]
- Moore D, Liebig J. Mixed messages: fertility signaling interferes with nestmate recognition in the monogynous ant Camponotus floridanus. Behavioral Ecology and Sociobiology. 2010;64:1011–1018. [Google Scholar]
- Nelson ME, Xu Z, Payne JR. Characterization and modeling of P-type electrosensory afferent responses to amplitude modulations in a wave-type electric fish. Journal of Comparative Physiology A-Sensory Neural and Behavioral Physiology. 1997;181:532–544. doi: 10.1007/s003590050137. [DOI] [PubMed] [Google Scholar]
- Partan SR, Marler P. Issues in the classification of multimodal communication signals. American Naturalist. 2005;166:231–245. doi: 10.1086/431246. [DOI] [PubMed] [Google Scholar]
- Petzold JM, Smith GT. Androgens regulate sex differences in signaling but are not associated with male variation in morphology in the weakly electric fish Parapteronotus hasemani. Hormones and Behavior. 2016;78:67–71. doi: 10.1016/j.yhbeh.2015.10.014. [DOI] [PMC free article] [PubMed] [Google Scholar]
- Rose GJ. Insights into neural mechanisms and evolution of behaviour from electric fish. Nature Reviews Neuroscience. 2004;5:943–951. doi: 10.1038/nrn1558. [DOI] [PubMed] [Google Scholar]
- Rowe C, Guilford T. The evolution of multimodal warning displays. Evolutionary Ecology. 1999;13:655–671. [Google Scholar]
- Scheich H. Neural basis of communication in high-frequency electric fish, Eigenmannia-virescens (jamming avoidance-response). 1. Open loop experiments and time domain concept of signal analysis. Journal of Comparative Physiology. 1977a;113:181–206. [Google Scholar]
- Scheich H. Neural basis of communication in high-frequency electric fish, Eigenmannia-virescens (jamming avoidance-response). 2. Jammed electroreceptor neurons in lateral line nerve. Journal of Comparative Physiology. 1977b;113:207–227. [Google Scholar]
- Scheich H, Bullock TH, Hamstra RH., Jr. Coding properties of two classes of afferent nerve fibers: High frequency electroreceptors in the electric fish, Eigenmannia. Journal of Neurophysiology. 1973;36:39–60. doi: 10.1152/jn.1973.36.1.39. [DOI] [PubMed] [Google Scholar]
- Smith AA, Millar JG, Hanks LM, Suarez AV. A conserved fertility signal despite population variation in the cuticular chemical profile of the trap-jaw ant Odontomachus brunneus. Journal of Experimental Biology. 2013;216:3917–3924. doi: 10.1242/jeb.089482. [DOI] [PubMed] [Google Scholar]
- Smith GT. Evolution and hormonal regulation of sex differences in the electrocommunication behavior of ghost knifefishes (Apteronotidae) Journal of Experimental Biology. 2013;216:2421–2433. doi: 10.1242/jeb.082933. [DOI] [PubMed] [Google Scholar]
- Stöckl A, Sinz F, Benda J, Grewe J. Encoding of social signals in all three electrosensory pathways of Eigenmannia virescens. Journal of Neurophysiology. 2014;112:2076–2091. doi: 10.1152/jn.00116.2014. [DOI] [PubMed] [Google Scholar]
- Turner CR, Derylo M, de Santana CD, Alves-Gomes JA, Smith GT. Phylogenetic comparative analysis of electric communication signals in ghost knifefishes (Gymnotiformes: Apteronotidae) Journal of Experimental Biology. 2007;210:4104–4122. doi: 10.1242/jeb.007930. [DOI] [PubMed] [Google Scholar]
- van Rossum MCW. A novel spike distance. Neural Computation. 2001;13:751–763. doi: 10.1162/089976601300014321. [DOI] [PubMed] [Google Scholar]
- Walz H, Grewe J, Benda J. Static frequency tuning accounts for changes in neural synchrony evoked by transient communication signals. Journal of Neurophysiology. 2014;112:752–765. doi: 10.1152/jn.00576.2013. [DOI] [PubMed] [Google Scholar]
- Walz H, Hupé GJ, Benda J, Lewis JE. The neuroethology of electrocommunication: How signal background influences sensory encoding and behaviour in Apteronotus leptorhynchus. Journal of Physiology-Paris. 2013;107:13–25. doi: 10.1016/j.jphysparis.2012.07.001. [DOI] [PubMed] [Google Scholar]
- Watanabe A, Takeda K. The change of discharge frequency by A.C. stimulus in a weak electric fish. Journal of Experimental Biology. 1963;40:57–66. [Google Scholar]
- Zakon HH. The electroreceptors: Diversity in structure and function. In: Atema J, Fay RR, Popper AN, Tavolga WN, editors. Sensory Biology of Aquatic Animals. 1st ed. Springer-Verlag; New York: 1988. pp. 813–850. [Google Scholar]
- Zakon HH, Dunlap KD. Sex steroids and communication signals in electric fish: A tale of two species. Brain Behavior and Evolution. 1999;54:61–69. doi: 10.1159/000006612. [DOI] [PubMed] [Google Scholar]
- Zhou M, Smith GT. Structure and sexual dimorphism of the electrocommunication signals of the weakly electric fish, Adontosternarchus devenanzii. Journal of Experimental Biology. 2006;209:4809–4818. doi: 10.1242/jeb.02579. [DOI] [PubMed] [Google Scholar]
- Zupanc GKH, Maler L. Evoked chirping in the weakly electric fish Apteronotus leptorhynchus—a quantitative biophysical analysis. Canadian Journal of Zoology. 1993;71:2301–2310. [Google Scholar]
Associated Data
This section collects any data citations, data availability statements, or supplementary materials included in this article.


