

Abstract
Inflammasomes are multi-protein complexes integrating pathogen-triggered signaling leading to the generation of pro-inflammatory cytokines, including interleukin-18 (IL-18). Hepatitis C virus (HCV) and human immunodeficiency virus-1 (HIV) infections are associated with elevated IL-18, suggesting inflammasome activation. However, there is marked person-to-person variation in the inflammasome response to HCV and HIV. We hypothesized that host genetics may explain this variation. To test this, we analyzed the associations of plasma IL-18 levels and polymorphisms in 10 genes in the inflammasome cascade. 1538 participants with active HIV and/or HCV infection in 3 ancestry groups are included. Samples were genotyped using the Illumina Omni 1-quad and Omni 2.5 arrays. Linear regression analyses were performed to test the association of variants with logIL-18 including HCV and HIV infection status and HIV-RNA, in each ancestry group and then meta-analyzed. Eleven highly correlated SNPs (r2=0.98-1) in the IL18-BCO2 region were significantly associated with logIL-18; Each T allele of rs80011693 confers a decrease of 0.06 log pg/mL of IL-18 after adjusting for covariates (rs80011693; rs111311302 β=-0.06, P-value=2.7×10⁻⁴). In conclusion, genetic variation in IL18 is associated with IL-18 production in response to HIV and HCV infection and may explain variability in the inflammatory outcomes of chronic viral infections.
Introduction
Inflammasomes are multi-protein cytosolic complexes that integrate several pathogen-triggered signaling cascades, ultimately leading to caspase-1 activation and the generation of pro-inflammatory cytokines including interleukin (IL)-18 and IL-1β (1,2). While there are inflammasome-dependent and -independent means to induce mature IL-1β production (3-5), to date, inflammasome activation has been the only mechanism described to convert pro-IL-18 to mature IL-18 (6). Thus, higher levels of IL-18 are indicative of inflammasome activation. Both hepatitis C virus (HCV) and human immunodeficiency virus-1 (HIV) are known to activate a specific inflammasome, the NOD-like receptor (NLR) family, pyrin domain containing 3 (NLRP3) inflammasome, as measured by increases in IL-18. For example, plasma IL-18 levels increase sharply during the acute phase of HCV infection, remain elevated in those with persistent infection, and return to the pre-infection level with spontaneous resolution of HCV (7). Similarly, levels are elevated in patients with chronic hepatitis and cirrhosis, and reduced after the infection is resolved either spontaneously (8) or after antiviral treatment (9). IL-18 levels are also elevated in HIV infection, an effect that is partially reversed by antiretroviral therapy (10,11).
Genetic determinants of IL-18 levels have been demonstrated in cohorts of individuals from different age groups without chronic viral infections (12-14). Several independent loci have been correlated with serum IL-18 levels in multiple genome-wide association studies including the interleukin 18 and beta-carotene oxygenase 2 (IL18-BCO2) gene region of chromosome 11 and, the NLR family, and caspase activation and recruitment domains (CARD) domain containing 4 (NLRC4) gene on chromosome 2 (12-14). Associations of serum IL-18 levels and SNPs in the IL18 gene were replicated in several populations of European ancestry with different demographic characteristics including women with no history of chronic illness (14), women with and without Type 2 diabetes (14), individuals with and without premature coronary heart disease (15) and older adults (12). Strong genetic effects in cis location have been suggested, however the biological mechanisms underlying the genetic associations are unknown.
Compared to what is observed in studies of persons without chronic viral infection, there is a wider range of IL-18 elevation observed in persons with chronic viral infection that cannot be explained by age, race, or gender (2,7,16,17). This suggests that host genetic differences may partially explain variation in IL-18 response to viral infection. To investigate this hypothesis, we measured IL-18 levels in individuals with well-characterized chronic and active HIV viremia and/or HCV viremia and evaluated the association of single nucleotide polymorphisms (SNPs) in 10 key genes in the viral-NLPR3 inflammasome activation pathway.
Results
Participants
Demographic characteristics of the analyzed individuals are presented in Table 1. HIV infected individuals were not under antiretroviral therapy. All individuals had their ancestry defined by principal component analysis using genetic variants. There were 386 individuals of European Ancestry (EA), 796 of African Ancestry (AA) and 356 of mixed or other Ancestry (MOA). Age (P value= 0.94), ancestry (P value = 0.09) and sex (P value= 0.13) were not associated with log IL-18.
Table 1.
Descriptive statistics of the analyzed individuals by genetically estimated ancestry group.
| Characteristic | Genetically estimated Ancestry groups | ||
|---|---|---|---|
| European (n=386) | African (n=796) | Mixed or other (n=356) | |
| Female (n, %) | 283 (73.3) | 703 (88.3) | 334 (93.8) |
| Age (years), mean (SD) | 41.37 (11.5) | 40.85 (8.5) | 37.51 (9.4) |
| IL-18 (pg/mL), mean (SD) | 584.5 (547.4) | 546.0 (441.3) | 560.3 (410.0) |
| HIV HCV infection status and HIV RNA | |||
| HCV Mono infected (n, %) | 191 (49.5) | 156 (19.6) | 73 (20.5) |
| HIV Mono infected, low HIV RNA1(n, %) | 28 (7.25) | 104 (13.1) | 58 (16.29) |
| HIV Mono infected, moderate HIV RNA1 (n, %) | 35 (9.06) | 102 (12.8) | 62 (17.4) |
| HIV Mono infected, high HIV RNA1 (n, %) | 56 (14.5) | 149 (18.7) | 74 (20.78) |
| HIV HCV Co-infected, low HIV RNA (n, %) | 19 (4.92) | 75 (9.42) | 35 (9.83) |
| HIV HCV Co-infected, moderate HIV RNA (n, %) | 21 (5.44) | 76 (9.54) | 20 (5.61) |
| HIV HCV Co-infected, high HIV RNA (n, %) | 36 (9.32) | 134 (16.8) | 34 (9.55) |
HIV low, medium and high RNA refers to 400-10K, 10K-50K and >50K HIV copies/mL, respectively.
Log plasma IL-18 by infection status
Log IL-18 was significantly higher in 450 persons with both HIV and HCV infections (Mean =2.76 log pg/mL, SD=0.27 log pg/mL) than in the 668 HIV-mono infected (Mean=2.61 log pg/mL, SD=0.30 log pg/mL) and the 420 HCV mono infected participants (Mean=2.50 log pg/mL, SD=0.30 log pg/mL), P = 2.2 × 10⁻¹⁶ for the three-group comparison, Figure 1. Similar results were observed for each ancestry group independently (Supplementary Figure 1). The multivariable analysis after adjusting for the principal components demonstrates that the level of HIV RNA in plasma is also determinant of IL-18 levels in all individuals (Table 2) as well as in each ancestry group (Supplementary Table 1). Specifically, there was a progressive increase in log IL-18 as HIV RNA increases from low, to moderate and high levels in both the HIV monoinfected and HIV-HCV co-infected groups compared to the HCV monoinfected individuals. However, HIV/HCV infection, HIV RNA and principal components, only accounted for 14% of the variance in IL-18 levels.
Figure 1.
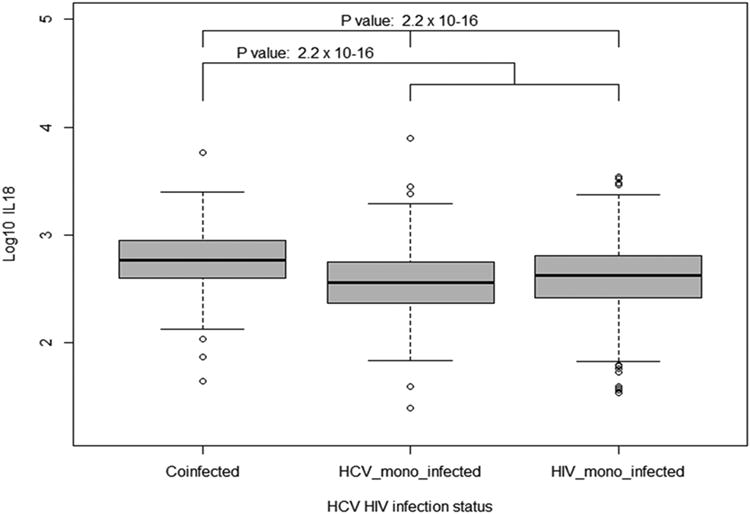
Log plasma IL-18 by HCV and HIV infection status in all the individuals analyzed in the study. The thick horizontal line in each box plot represent the median for each category, the whiskers extend to 1.5 times the interquartile range from the box.
Table 2.
Multivariate linear regression analysis of Log IL-18 in all individuals.
| Factor | β | SE | P value |
|---|---|---|---|
| PC1 | 0.12 | 0.16 | 0.46 |
| PC2 | 0.24 | 0.16 | 0.13 |
| PC3 | -0.01 | 0.16 | 0.94 |
| PC4 | 0.19 | 0.16 | 0.25 |
| PC5 | -0.12 | 0.16 | 0.43 |
| HIV Mono infected, low HIV RNA 1 | -0.05 | 0.02 | 0.03 |
| HIV Mono infected, moderate HIV RNA 1 | 0.02 | 0.02 | 0.28 |
| HIV Mono infected, high HIV RNA 1 | 0.19 | 0.02 | 2×10-16 |
| HIV HCV Co-infected, low HIV RNA | 0.15 | 0.02 | 7.0×10-08 |
| HIV HCV Co-infected, moderate HIV RNA | 0.18 | 0.02 | 4.2×10⁻¹⁰ |
| HIV HCV Co-infected, high HIV RNA | 0.27 | 0.02 | 2×10-16 |
Abbreviations: β: Beta regression coefficient; SE: Standard error; PC: principal component.
HIV low, medium and high RNA refers 400-10K, 10K-50K and >50K HIV copies/mL, respectively.
Genetic association analysis
From 10 genes spanning a total of ∼519 kb of DNA (Supplementary Table 2), we evaluated 721 genetic variants for EA, 1307 for AA, and 1170 for MOA. We found an association of IL-18 levels and variants in the IL18-BCO2 region in chromosome 11. The SNPs significantly associated with IL-18 levels after adjusting for the principal components and the HIV and HCV categories are shown in Figure 2. Table 3 displays their allelic frequency, effect size estimates and the annotation of the function and eQTL information described in public databases (https://genome.ucsc.edu/index.html and http://www.gtexportal.org/home/, respectively). The strongest signals in the IL18-BCO2 region were in the imputed SNPs rs80011693 (β=-0.06, SE=0.02, P value=1.9 × 10⁻⁴) and rs111311302 with β=-0.06, SE=0.02, P value=2.0 × 10⁻⁴. Thus, each T allele of rs80011693 confers a decrease of 0.06 log pg/mL of IL-18 after adjusting for HIV-HCV infection, HIV RNA levels and ancestry (Table 3 and Supplementary Table 3). The direction of the effect of the associated variants is the same across ancestry groups. They were in high linkage disequilibrium (LD) in the three ancestry groups (r2=0.98-1). After conditioning on each of the associated SNPs, the remaining SNPs in the IL18-BCO2 were not significant (Supplementary Figure 3), highlighting the strong LD across this region. Associations between log IL-18 and polymorphisms in IL-1β, ASCC1, NLRP3, NFKB1, NFKB2, CASP1, TLR7, TLR8 and MYD88 did not reach statistical significance after correcting for multiple tests.
Figure 2.

Association of variants in the IL18-BCO2 region. The variants included 14 genotyped (squares) and 177 imputed SNPs (circles) within the region from 112 Mb to 112.1 Mb on chromosome 11. The recombination in this region is plotted in the background in light blue. Pair wise LDs between rs80011693 and other variants in IL18-BCO2 were estimated using LD data in EUR population in the 1000 Genomes project (hg19/Nov 2014). The color from blue to red represents the r2 values.
Table 3.
Top significant SNPs in IL18 associated with LogIL-18 by genetically estimated ancestry groups and results of the meta-analysis.
| Chr | SNP | Position (GRCh37 /hg19) |
eQTL | Function | Allele Minor/ Major |
Meta Analysis | European Ancestry | African Ancestry | Mixed or Other Ancestry |
Minor Allele Frequency |
||||||||||
|---|---|---|---|---|---|---|---|---|---|---|---|---|---|---|---|---|---|---|---|---|
| B | SE | P Val | B | SE | P Val | B | SE | P Val | B | SE | P Val | EA | AA | MOA | ||||||
| 11 | rs80011693 | 112005483 | Yes | Intronic | T/C | -0.06 | 0.02 | 0.00020 | -0.06 | 0.02 | 0.012 | -0.08 | 0.04 | 0.037 | -0.06 | 0.03 | 0.066 | 0.25 | 0.04 | 0.11 |
| 11 | rs111311302 | 112007619 | No | Intronic | G/C | -0.06 | 0.02 | 0.00020 | -0.06 | 0.02 | 0.013 | -0.08 | 0.04 | 0.035 | -0.06 | 0.03 | 0.064 | 0.25 | 0.04 | 0.11 |
| 11 | rs3882892 | 112014986 | Yes | Intronic | T/C | -0.06 | 0.02 | 0.00027 | -0.06 | 0.02 | 0.013 | -0.08 | 0.04 | 0.052 | -0.06 | 0.03 | 0.064 | 0.25 | 0.04 | 0.11 |
| 11 | rs5744276 | 112016871 | Yes | Intronic | G/C | -0.06 | 0.02 | 0.00027 | -0.06 | 0.02 | 0.013 | -0.08 | 0.04 | 0.052 | -0.06 | 0.03 | 0.064 | 0.25 | 0.04 | 0.11 |
| 11 | rs5744258 | 112021767 | Yes | Intronic | G/C | -0.06 | 0.02 | 0.00025 | -0.06 | 0.02 | 0.013 | -0.08 | 0.04 | 0.055 | -0.06 | 0.03 | 0.055 | 0.25 | 0.04 | 0.11 |
| 11 | rs5744256 | 112022848 | Yes | Intronic | G/A | -0.06 | 0.02 | 0.00026 | -0.06 | 0.02 | 0.013 | -0.07 | 0.04 | 0.064 | -0.07 | 0.03 | 0.052 | 0.25 | 0.04 | 0.12 |
| 11 | rs1834481 | 112023827 | Yes | Intronic | G/C | -0.06 | 0.02 | 0.00028 | -0.06 | 0.02 | 0.013 | -0.07 | 0.04 | 0.066 | -0.06 | 0.03 | 0.055 | 0.25 | 0.04 | 0.11 |
| 11 | rs5744249 | 112025306 | Yes | Intronic | C/A | -0.06 | 0.02 | 0.00028 | -0.06 | 0.02 | 0.013 | -0.07 | 0.04 | 0.066 | -0.06 | 0.03 | 0.055 | 0.25 | 0.04 | 0.11 |
| 11 | rs34546088 | 112031798 | No | Intronic | C/CA | -0.06 | 0.02 | 0.00028 | -0.06 | 0.02 | 0.013 | -0.07 | 0.04 | 0.066 | -0.06 | 0.03 | 0.055 | 0.25 | 0.04 | 0.11 |
| 11 | rs11606049 | 112033129 | Yes | Intronic | T/C | -0.06 | 0.02 | 0.00028 | -0.06 | 0.02 | 0.013 | -0.07 | 0.04 | 0.066 | -0.06 | 0.03 | 0.054 | 0.25 | 0.04 | 0.11 |
| 11 | rs5744230 | 112034062 | No | Intronic | T/TA | -0.06 | 0.02 | 0.00027 | -0.06 | 0.02 | 0.013 | -0.07 | 0.04 | 0.063 | -0.06 | 0.03 | 0.054 | 0.25 | 0.04 | 0.11 |
Discussion
This investigation extends previous associations of genetic factors with IL-18 plasma levels by demonstrating that the variants in the IL18-BCO2 region are important determinants of plasma IL-18 levels in the presence of a chronic viral infection. Prior studies demonstrated the importance of this region in persons without an ongoing infection (12-14). Compared to the SNPs, the greater magnitude of the effects (β regression coefficient) associated with HIV mono infection and HIV-HCV co-infection confirm the dominant role of viral infections explaining person to person differences in IL-18 levels (7, 8). However, these dominant viral associations only accounted for a low percentage of the variance in IL-18 levels, suggesting that there are other unmeasured factors responsible for the person-to-person differences in IL-18 levels in each infection group. Our findings suggest that this genetic region has an important role in determining plasma IL-18 levels. It is also notable that in our multivariable model, no other non-genetic factor was as important, including ancestry.
The results of this and previous studies indicate a consistent locus effect in the IL18 region represented by a SNP to SNP replication across studies. The association of genetic variants in IL18 on plasma IL-18 levels was studied in older European adults included in the Cardiovascular Health Study (CHS) (12) and European individuals in the In-CHIANTI study (13). They detected an association of IL-18 levels with rs1834481 and rs5744256, two intronic SNPs that were also significantly associated with IL-18 levels in our study. Likewise, rs1834481 was associated with IL-18 levels in a genome wide association study of 1,523 women of European ancestry from the Nurses' Health Study (NHS) and 435 from the Women's Genome Health Study (WGHS) (14). Moreover, rs5744256 and rs2043055 were previously associated with IL-18 levels in candidate gene studies in healthy individuals and in individuals with premature cardiovascular disease, respectively (15,18,19).
We looked at the publicly available RNA expression data (20,21) to investigate the relationship of any of the associated SNPs or other SNPs with expression of IL-18 levels in diverse tissues. Of the 11 variants described in this study, 10 have been described as expression quantitative trait loci (eQTLs) in tissues such as lung, pancreas and skin (21). Other SNPs not included in the present analysis, such as rs7020926, rs7030024, rs13283237,rs7851038 and rs944363, are described as related to IL-18 expression levels in circulating monocytes analyzed in 1,490 unrelated European individuals (22), but no direct biological mechanism has yet been demonstrated.
BCO2 variants have also been reported as associated with serum IL-18 level. In the CHS and In-CHIANTI cohorts, rs2250417 was significantly associated with IL-18 protein levels (13) in each individual cohort as well as the meta-analysis (P value=1.9 × 10⁻³²). Similarly, He et al describes three different variants (rs2115763, rs12420140, and rs4935984) in this gene as associated with IL-18 levels in the NHS-WGHS (14). The associated variants in the BCO2 gene in the different studies (rs2250417, rs10891343, rs2115763, rs12420140, and rs4935984) are in high LD (D′=0.99-1) with the associated SNPs in our study in populations of African, European, Asian descent as well as admixed populations in The 1000 Genomes project (http://www.1000genomes.org/). However, since they were not genotyped or imputed in this study, we cannot rule out their role on IL-18 levels in this analysis.
Even though there is a clear effect of genetic determinants in plasma IL-18 levels, much of the inter-individual differences remain unexplained. Circulating levels and biological activity depends on the level of production of IL-18, its natural inhibitory protein IL-18BP (IL-18 binding protein) as well as the surface expression of IL-18 receptors (IL-18R) on responding cells (23). Thus, variation in the levels of IL-18 might be determined by polymorphisms regulating the expression of these genes or as yet unidentified genes that encode for the proteins that interact with IL-18. Environmental factors such as bacterial and other viral infections stimulating the innate and acquired immune responses concurrently with HCV and HIV may also affect IL-18 levels. However, IL-18 levels have been shown to be stable both before (low levels) and in the chronic phase of (high levels) HCV infection, suggesting that exposure to other infections may play a lesser role than HCV in regulating total levels. Additionally, chronic or acute conditions activating the inflammasome, and epigenetic mechanisms regulating the expression of the IL-18 protein are among other potential modulators of IL-18 variation.
On the other hand, pro-IL-18 is constitutively expressed (24,25), its expression increases from baseline levels after the signal 1 and inflammasome assembly results in maturation of IL-18, and its release into extracellular space (26,27). We hypothesize that baseline constitutive expression levels of pro-IL-18 are regulated by genetic determinants represented by the associated variants and, that caspase 1 activation converts pro-IL-18 to mature IL-18 with greater production of mature IL-18 when pro-IL-18 levels are higher. Thus, the higher baseline pro-IL-18 in the individuals with the risk alleles result in higher levels of mature IL-18 production upon inflammasome activation. This would be expected if caspase 1 enzymatic activity is not limiting upon activation and is consistent with the literature on IL-18 regulation (24,28). Our perspective is also influenced by the observation we make in humans infected with HIV or HCV in whom there is a marked increase in plasma total IL-18 that remains elevated for decades or until with HCV, the infection is eliminated, at which time it comes back to baseline (7). Those increases in total plasma IL-18 level following HCV or HIV infection vary markedly from person to person, persist for decades, and undoubtedly are multifactorial but yet poorly understood. Thus, we aimed to study the full range of genes that might contribute, even if the gene doesn't fit the current models of inflammasome activation. We established that there is a genetic basis for differences in plasma IL-18 levels in persons with chronic viral infection that warrants investigation of the molecular mechanisms underlying those observations.
Materials and Methods
Study participants
A total of 1538 individuals were selected from 5 different study cohorts: the AIDS Link to the Intravenous Experience (ALIVE) (29), Baltimore Before and After Acute Study of Hepatitis (BBAASH) (30), Boston Area HCV Study Transmission, Immunity, Outcomes Network (BAHSTION) (31), Correlates of Resolved Versus Low-Level Viremic Hepatitis C Infection in Blood Donors (REVELL Study) (32), and Women's Interagency HIV Study (WIHS) (33), as previously described (34). The inclusion criteria were the availability of genome-wide genotyping data and evidence of active HCV and/or HIV infection as determined by presence of both antibodies and detectable RNA levels for more than 6 months prior to the date of IL-18 testing, as described previously (33,34). HCV and/or HIV infected individuals were not included in any anti-HCV or antiretroviral therapy at the time of sample withdraw. Each individual study obtained consent for genetic testing as approved by their governing Institutional Review Board and the Johns Hopkins School of Medicine Institutional Review Board.
IL-18 plasma levels
Mature IL-18 was measured in plasma from reposited specimens using enzyme-linked immunosorbent assay (MBL International, Woburn, MA, USA) on a sample taken prior to antiretroviral therapy in the HIV-infected participants. The assay was performed per the manufacturer's recommendations using 50 μL of plasma. Data were acquired using a SpectraMax M5 (Molecular Devices). The sensitivity of this assay is 12.5 pg/mL and the average intra-assay coefficient of variation is 7.25%.
Statistical analysis
Plasma IL-18 levels, log-transformed for approximate normalization, were the primary outcome. HIV and HCV infection status, HIV RNA levels, genetic ancestry, gender, and age were each included in the statistical model of linear regression to determine their effect on logIL-18. HCV and HIV infection status and HIV RNA variables were modeled as a unique categorical variable that we refer to as “HIV-HCV infection, HIV RNA”. This variable groups the individuals into seven categories: HCV mono infected, HIV mono infected with low (400-10K copies/mL), moderate (10K-50K copies/mL) and high HIV RNA levels (>50K copies/mL) and, co-infected with low, moderate and high HIV RNA levels. ANOVA was used to compare log IL-18 levels between HCV mono infected, HIV mono infected, and HIV-HCV co-infected individuals with all individuals and by genetic ancestry.
Genetic ancestry analysis
Genetic ancestry was determined by principal components based on 10,340 unlinked SNPs across the genome using the smartpca program from the software package eigenstrat (35). Principal components analysis is used to summarize the background genetic variation of populations into a few variables that represent ancestral origin. Three distinct ancestry groups emerged including European Ancestry, African Ancestry and mixed or other ancestry, which likely includes Hispanic and Asian ancestry (Supplementary Figure 2).
Genotyping and Imputation
The SNP genotyping data were obtained from a larger genome wide association study (34) using the Illumina Human Omni-Quad array for samples from the ALIVE, BBAASH, BAHSTION and REVELL study groups and using the Illumina Omni2.5 array for the WIHS group. The selected SNPs are part of the NLRP3 inflammasome pathway and include the genes and 10 kilobases upstream and downstream of each gene. The pathway genes included were Interleukin 18 (IL18), Interleukin 1 beta (IL-1β), Activating Signal Cointegrator 1 Complex Subunit 1 (ASCC1), NLR family, pyrin domain containing 3 (NLRP3); Nuclear Factor Kappa B Subunit 1 (NF-κβ1), Nuclear Factor Kappa B Subunit 2 (NF-κβ2), Caspase (CASP1), Toll Like Receptor 7 (TLR7), Toll Like Receptor 8 (TLR8), Myeloid Differentiation Primary Response 88 (MYD88) and Beta-carotene oxygenase 2 (BCO2). Genomic coordinates were based on the Human GRCh37/hg19 assembly (Supplementary Table 2). Genomic imputation was performed for each chromosomal region using IMPUTE2 (36). The reference panel consisted of 2,504 individuals representing four continental populations (Africa, Americas, Asia and Europe) as part of the 1000 Genomes Project (37). Each genetic platform was individually imputed using all individuals and the imputed datasets were merged based on genetic ancestry groups using the software Plink version 1.90 beta (https://www.cog-genomics.org/plink2). Only variants with an information score > 0.3 and a genotyping probability greater than 90% were included in the analysis (38). Standard quality control measures were employed pre and post imputation (excluding variants with minor allele frequency (MAF) < 0.01, missing call rate ≥ 1%, Hardy Weinberg equilibrium test P value < 1×10⁻⁵). Genotyped and high quality imputed variants that were common to both platforms were included in the regression analysis.
Genetic association analysis
Plink was used to analyze linear regression models adjusting for five principal components and HIV-HCV infection, HIV RNA. SNPs were modeled under an additive model in which genotypes are represented as 0, 1, 2 copies of the minor allele. Ancestry groups were tested separately and the results were meta-analyzed by combining ancestry-specific β (regression coefficient) estimates using a fixed effects inverse variance model (39) implemented in META (40). Linkage disequilibrium (r2) was determined in each of the genetic regions by ancestral group. This informed a modified Bonferroni correction using the effective number of independent SNPs (n=103 SNPs for AA, n=38 for EA and n=57 for MOA, n= 197 total variants). Twenty-five of the 197 SNPs were common between at least two ancestry groups, and the remaining were unique. A modified Bonferroni corrected P value < 2.9 × 10⁻⁴ was considered statistically significant.
Supplementary Material
Acknowledgments
We acknowledge support from the National Institutes of Health (NIH) National Institute on Drug Abuse R01DA013324 (Thomas), R01DA12568 (Mehta) and U01DA036297 (Kirk); National Institute of Allergy and Infectious Diseases (NIAID) R01 AI108403 (Cox); NIH K23 AI124913 (Lahiri); NIH U19AI066345, U01AI131314, R01DA033541 and U19AI082630 (Kim). Data in this manuscript were partially collected by the Women's Interagency HIV Study (WIHS). The contents of this publication are solely the responsibility of the authors and do not represent the official views of the NIH. WIHS (Principal Investigators): UAB-MS WIHS (Saag, Kempf, and Konkle-Parker), U01-AI-103401; Atlanta WIHS (Ofotokun and Wingood), U01-AI-103408; Bronx WIHS (Anastos), U01-AI-035004; Brooklyn WIHS (Minkoff and Gustafson), U01-AI-031834; Chicago WIHS (Cohen and French), U01-AI-034993; Metropolitan Washington WIHS (Kassaye), U01-AI-034994; Miami WIHS (Fischl and Metsch), U01-AI-103397; UNC WIHS (Adimora), U01-AI-103390; Connie Wofsy Women's HIV Study, Northern California (Greenblatt, Aouizerat, and Tien), U01-AI-034989; WIHS Data Management and Analysis Center (Gange and Golub), U01-AI-042590; Southern California WIHS (Milam), U01-HD-032632 (WIHS I–WIHS IV). The WIHS is funded primarily by the National Institute of Allergy and Infectious Diseases (NIAID), with additional co-funding from the Eunice Kennedy Shriver National Institute of Child Health and Human Development (NICHD), the National Cancer Institute (NCI), the National Institute on Drug Abuse (NIDA), and the National Institute on Mental Health (NIMH). Targeted supplemental funding for specific projects is also provided by the National Institute of Dental and Craniofacial Research (NIDCR), the National Institute on Alcohol Abuse and Alcoholism (NIAAA), the National Institute on Deafness and other Communication Disorders (NIDCD), and the NIH Office of Research on Women's Health. WIHS data collection is also supported by UL1-TR000004 (UCSF CTSA) and UL1-TR000454 (Atlanta CTSA).
Footnotes
Conflict of Interest: The authors declare no conflict of interest.
References
- 1.Guo H, Callaway JB, Ting JP. Inflammasomes: mechanism of action, role in disease, and therapeutics. Nat Med. 2015 Jul;21(7):677–687. doi: 10.1038/nm.3893. [DOI] [PMC free article] [PubMed] [Google Scholar]
- 2.Chattergoon MA, Latanich R, Quinn J, Winter ME, Buckheit RW, 3rd, Blankson JN, et al. HIV and HCV activate the inflammasome in monocytes and macrophages via endosomal Toll-like receptors without induction of type 1 interferon. PLoS Pathog. 2014 May 1;10(5):e1004082. doi: 10.1371/journal.ppat.1004082. [DOI] [PMC free article] [PubMed] [Google Scholar]
- 3.Kanneganti TD. Central roles of NLRs and inflammasomes in viral infection. Nat Rev Immunol. 2010 Oct;10(10):688–698. doi: 10.1038/nri2851. [DOI] [PMC free article] [PubMed] [Google Scholar]
- 4.Netea MG, Simon A, van de Veerdonk F, Kullberg BJ, Van der Meer JW, Joosten LA. IL-1beta processing in host defense: beyond the inflammasomes. PLoS Pathog. 2010 Feb 26;6(2):e1000661. doi: 10.1371/journal.ppat.1000661. [DOI] [PMC free article] [PubMed] [Google Scholar]
- 5.Dinarello CA. Interleukin-1 in the pathogenesis and treatment of inflammatory diseases. Blood. 2011 Apr 7;117(14):3720–3732. doi: 10.1182/blood-2010-07-273417. [DOI] [PMC free article] [PubMed] [Google Scholar]
- 6.Strowig T, Henao-Mejia J, Elinav E, Flavell R. Inflammasomes in health and disease. Nature. 2012 Jan 18;481(7381):278–286. doi: 10.1038/nature10759. [DOI] [PubMed] [Google Scholar]
- 7.Chattergoon MA, Levine JS, Latanich R, Osburn WO, Thomas DL, Cox AL. High plasma interleukin-18 levels mark the acute phase of hepatitis C virus infection. J Infect Dis. 2011 Dec 1;204(11):1730–1740. doi: 10.1093/infdis/jir642. [DOI] [PMC free article] [PubMed] [Google Scholar]
- 8.Sharma A, Chakraborti A, Das A, Dhiman RK, Chawla Y. Elevation of interleukin-18 in chronic hepatitis C: implications for hepatitis C virus pathogenesis. Immunology. 2009 Sep;128(1 Suppl):e514–22. doi: 10.1111/j.1365-2567.2008.03021.x. [DOI] [PMC free article] [PubMed] [Google Scholar]
- 9.Jia H, Du J, Zhu S, Ma Y, Cai H. Clinical observation of serum IL-18, IL-10 and sIL-2R levels in patients with chronic hepatitis C pre- and post antiviral treatment. Chin Med J (Engl) 2003 Apr;116(4):605–608. [PubMed] [Google Scholar]
- 10.Iannello A, Boulassel MR, Samarani S, Tremblay C, Toma E, Routy JP, et al. HIV-1 causes an imbalance in the production of interleukin-18 and its natural antagonist in HIV-infected individuals: implications for enhanced viral replication. J Infect Dis. 2010 Feb 15;201(4):608–617. doi: 10.1086/650314. [DOI] [PubMed] [Google Scholar]
- 11.Samarani S, Allam O, Sagala P, Aldabah Z, Jenabian MA, Mehraj V, et al. Imbalanced production of IL-18 and its antagonist in human diseases, and its implications for HIV-1 infection. Cytokine. 2016 Jun;82:38–51. doi: 10.1016/j.cyto.2016.01.006. [DOI] [PubMed] [Google Scholar]
- 12.Matteini AM, Li J, Lange EM, Tanaka T, Lange LA, Tracy RP, et al. Novel gene variants predict serum levels of the cytokines IL-18 and IL-1ra in older adults. Cytokine. 2014 Jan;65(1):10–16. doi: 10.1016/j.cyto.2013.10.002. [DOI] [PMC free article] [PubMed] [Google Scholar]
- 13.Melzer D, Perry JR, Hernandez D, Corsi AM, Stevens K, Rafferty I, et al. A genome-wide association study identifies protein quantitative trait loci (pQTLs) PLoS Genet. 2008 May 9;4(5):e1000072. doi: 10.1371/journal.pgen.1000072. [DOI] [PMC free article] [PubMed] [Google Scholar]
- 14.He M, Cornelis MC, Kraft P, van Dam RM, Sun Q, Laurie CC, et al. Genome-wide association study identifies variants at the IL18-BCO2 locus associated with interleukin-18 levels. Arterioscler Thromb Vasc Biol. 2010 Apr;30(4):885–890. doi: 10.1161/ATVBAHA.109.199422. [DOI] [PMC free article] [PubMed] [Google Scholar]
- 15.Thompson SR, McCaskie PA, Beilby JP, Hung J, Jennens M, Chapman C, et al. IL18 haplotypes are associated with serum IL-18 concentrations in a population-based study and a cohort of individuals with premature coronary heart disease. Clin Chem. 2007 Dec;53(12):2078–2085. doi: 10.1373/clinchem.2007.092692. [DOI] [PubMed] [Google Scholar]
- 16.Niu ZL, Zhang PA, Tong YQ. Association of plasma interleukin-18 levels and polymorphisms in interleukin-18 gene with outcomes of hepatitis C virus infections: a meta-analysis. J Immunoassay Immunochem. 2015;36(3):221–232. doi: 10.1080/15321819.2014.924418. [DOI] [PubMed] [Google Scholar]
- 17.Bouzgarrou N, Hassen E, Schvoerer E, Stoll-Keller F, Bahri O, Gabbouj S, et al. Association of interleukin-18 polymorphisms and plasma level with the outcome of chronic HCV infection. J Med Virol. 2008 Apr;80(4):607–614. doi: 10.1002/jmv.21079. [DOI] [PubMed] [Google Scholar]
- 18.Frayling TM, Rafiq S, Murray A, Hurst AJ, Weedon MN, Henley W, et al. An interleukin-18 polymorphism is associated with reduced serum concentrations and better physical functioning in older people. J Gerontol A Biol Sci Med Sci. 2007 Jan;62(1):73–78. doi: 10.1093/gerona/62.1.73. [DOI] [PMC free article] [PubMed] [Google Scholar]
- 19.Tiret L, Godefroy T, Lubos E, Nicaud V, Tregouet DA, Barbaux S, et al. Genetic analysis of the interleukin-18 system highlights the role of the interleukin-18 gene in cardiovascular disease. Circulation. 2005 Aug 2;112(5):643–650. doi: 10.1161/CIRCULATIONAHA.104.519702. [DOI] [PubMed] [Google Scholar]
- 20.Xia K, Shabalin AA, Huang S, Madar V, Zhou YH, Wang W, et al. seeQTL: a searchable database for human eQTLs. Bioinformatics. 2012 Feb 1;28(3):451–452. doi: 10.1093/bioinformatics/btr678. [DOI] [PMC free article] [PubMed] [Google Scholar]
- 21.Carithers LJ, Ardlie K, Barcus M, Branton PA, Britton A, Buia SA, et al. A Novel Approach to High-Quality Postmortem Tissue Procurement: The GTEx Project. Biopreserv Biobank. 2015 Oct;13(5):311–319. doi: 10.1089/bio.2015.0032. [DOI] [PMC free article] [PubMed] [Google Scholar]
- 22.Zeller T, Wild P, Szymczak S, Rotival M, Schillert A, Castagne R, et al. Genetics and beyond--the transcriptome of human monocytes and disease susceptibility. PLoS One. 2010 May 18;5(5):e10693. doi: 10.1371/journal.pone.0010693. [DOI] [PMC free article] [PubMed] [Google Scholar]
- 23.Wawrocki S, Druszczynska M, Kowalewicz-Kulbat M, Rudnicka W. Interleukin 18 (IL-18) as a target for immune intervention. Acta Biochim Pol. 2016;63(1):59–63. doi: 10.18388/abp.2015_1153. [DOI] [PubMed] [Google Scholar]
- 24.Puren AJ, Fantuzzi G, Dinarello CA. Gene expression, synthesis, and secretion of interleukin 18 and interleukin 1beta are differentially regulated in human blood mononuclear cells and mouse spleen cells. Proc Natl Acad Sci U S A. 1999 Mar 2;96(5):2256–2261. doi: 10.1073/pnas.96.5.2256. [DOI] [PMC free article] [PubMed] [Google Scholar]
- 25.Tone M, Thompson SA, Tone Y, Fairchild PJ, Waldmann H. Regulation of IL-18 (IFN-gamma-inducing factor) gene expression. J Immunol. 1997 Dec 15;159(12):6156–6163. [PubMed] [Google Scholar]
- 26.Lamkanfi M, Dixit VM. Inflammasomes and their roles in health and disease. Annu Rev Cell Dev Biol. 2012;28:137–161. doi: 10.1146/annurev-cellbio-101011-155745. [DOI] [PubMed] [Google Scholar]
- 27.Franchi L, Eigenbrod T, Munoz-Planillo R, Nunez G. The inflammasome: a caspase-1-activation platform that regulates immune responses and disease pathogenesis. Nat Immunol. 2009 Mar;10(3):241–247. doi: 10.1038/ni.1703. [DOI] [PMC free article] [PubMed] [Google Scholar]
- 28.Gu Y, Kuida K, Tsutsui H, Ku G, Hsiao K, Fleming MA, et al. Activation of interferon-gamma inducing factor mediated by interleukin-1beta converting enzyme. Science. 1997 Jan 10;275(5297):206–209. doi: 10.1126/science.275.5297.206. [DOI] [PubMed] [Google Scholar]
- 29.Vlahov D, Munoz A, Anthony JC, Cohn S, Celentano DD, Nelson KE. Association of drug injection patterns with antibody to human immunodeficiency virus type 1 among intravenous drug users in Baltimore, Maryland. Am J Epidemiol. 1990 Nov;132(5):847–856. doi: 10.1093/oxfordjournals.aje.a115727. [DOI] [PubMed] [Google Scholar]
- 30.Cox AL, Netski DM, Mosbruger T, Sherman SG, Strathdee S, Ompad D, et al. Prospective evaluation of community-acquired acute-phase hepatitis C virus infection. Clin Infect Dis. 2005 Apr 1;40(7):951–958. doi: 10.1086/428578. [DOI] [PubMed] [Google Scholar]
- 31.Kim AY, Kuntzen T, Timm J, Nolan BE, Baca MA, Reyor LL, et al. Spontaneous control of HCV is associated with expression of HLA-B 57 and preservation of targeted epitopes. Gastroenterology. 2011 Feb;140(2):686–696.e1. doi: 10.1053/j.gastro.2010.09.042. [DOI] [PMC free article] [PubMed] [Google Scholar]
- 32.Tobler LH, Bahrami SH, Kaidarova Z, Pitina L, Winkelman VK, Vanderpool SK, et al. A case-control study of factors associated with resolution of hepatitis C viremia in former blood donors (CME) Transfusion. 2010 Jul;50(7):1513–1523. doi: 10.1111/j.1537-2995.2010.02634.x. [DOI] [PMC free article] [PubMed] [Google Scholar]
- 33.Kuniholm MH, Gao X, Xue X, Kovacs A, Marti D, Thio CL, et al. The relation of HLA genotype to hepatitis C viral load and markers of liver fibrosis in HIV-infected and HIV-uninfected women. J Infect Dis. 2011 Jun 15;203(12):1807–1814. doi: 10.1093/infdis/jir192. [DOI] [PMC free article] [PubMed] [Google Scholar]
- 34.Duggal P, Thio CL, Wojcik GL, Goedert JJ, Mangia A, Latanich R, et al. Genome-wide association study of spontaneous resolution of hepatitis C virus infection: data from multiple cohorts. Ann Intern Med. 2013 Feb 19;158(4):235–245. doi: 10.7326/0003-4819-158-4-201302190-00003. [DOI] [PMC free article] [PubMed] [Google Scholar]
- 35.Patterson N, Price AL, Reich D. Population structure and eigenanalysis. PLoS Genet. 2006 Dec;2(12):e190. doi: 10.1371/journal.pgen.0020190. [DOI] [PMC free article] [PubMed] [Google Scholar]
- 36.Howie BN, Donnelly P, Marchini J. A flexible and accurate genotype imputation method for the next generation of genome-wide association studies. PLoS Genet. 2009 Jun;5(6):e1000529. doi: 10.1371/journal.pgen.1000529. [DOI] [PMC free article] [PubMed] [Google Scholar]
- 37.1000 Genomes Project Consortium. Auton A, Brooks LD, Durbin RM, Garrison EP, Kang HM, et al. A global reference for human genetic variation. Nature. 2015 Oct 1;526(7571):68–74. doi: 10.1038/nature15393. [DOI] [PMC free article] [PubMed] [Google Scholar]
- 38.Roshyara NR, Scholz M. fcGENE: a versatile tool for processing and transforming SNP datasets. PLoS One. 2014 Jul 22;9(7):e97589. doi: 10.1371/journal.pone.0097589. [DOI] [PMC free article] [PubMed] [Google Scholar]
- 39.Normand SL. Meta-analysis: formulating, evaluating, combining, and reporting. Stat Med. 1999 Feb 15;18(3):321–359. doi: 10.1002/(sici)1097-0258(19990215)18:3<321::aid-sim28>3.0.co;2-p. [DOI] [PubMed] [Google Scholar]
- 40.Liu JZ, Tozzi F, Waterworth DM, Pillai SG, Muglia P, Middleton L, et al. Meta-analysis and imputation refines the association of 15q25 with smoking quantity. Nat Genet. 2010 May;42(5):436–440. doi: 10.1038/ng.572. [DOI] [PMC free article] [PubMed] [Google Scholar]
Associated Data
This section collects any data citations, data availability statements, or supplementary materials included in this article.