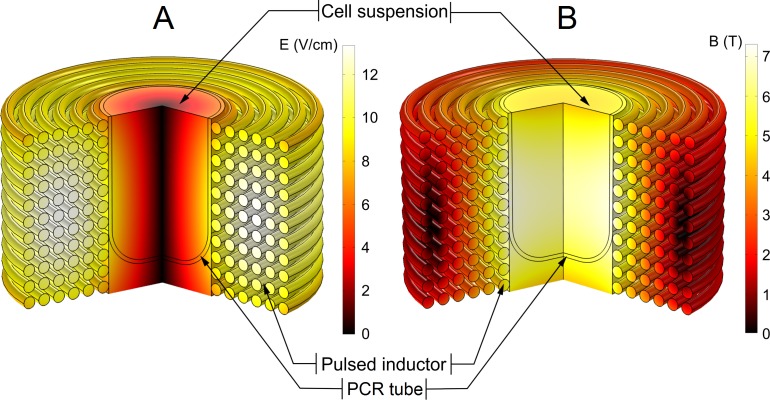
Figure 2. Finite-element method (FEM) model of the pulsed magnetic field inductor.
(A) Spatial distribution of the electric field at highest dB/dt of the magnetic pulse; (B) spatial distribution of the magnetic field. The electric field was the highest at the edges of the polymerase-chain-reaction (PCR) tube and decreased to the zero in the centre of the sample while the magnetic field was approximately homogeneous through the whole sample.

