

Abstract
Summary
Pathway Inspector is an easy-to-use web application helping researchers to find patterns of expression in complex RNAseq experiments. The tool combines two standard approaches for RNAseq analysis: the identification of differentially expressed genes and a topology-based analysis of enriched pathways. Pathway Inspector is equipped with ad hoc interactive graphical interfaces simplifying the discovery of modulated pathways and the integration of the differentially expressed genes in the corresponding pathway topology.
Availability and Implementation
Pathway Inspector is available at the website http://admiral.fmach.it/PI and has been developed in Python, making use of the Django Web Framework.
1 Introduction
Functional analysis of high-throughput data is a crucial step in systems biology studies. To fully exploit the information encoded in complex biological systems, data analysis tools should be able to combine omics experiments and background knowledge to describe the interactions among proteins and small molecules and to improve the limited knowledge available on gene functions.
The analysis of differentially expressed genes between diverse biological conditions is usually the starting point for finding relevant patterns for a given phenotype. Modeling the biological information as pathways of interacting elements can bring the analysis and interpretation of results one step further. Early enrichment approaches rely only on the number of genes or on their co-expression to identify significant pathways (Khatri et al., 2012). The most recent approaches, like SPIA (Khatri et al., 2012) or graphite (Sales et al., 2012), exploit also the pathway topology.
Pathway Inspector (PI) provides a fully automated enrichment analysis through the Differential Expression Analysis of Pathways (DEAP) algorithm (Haynes et al., 2013) run on pathway maps built with rules similar to graphite’s. Compared to other topology-based enrichment algorithms, DEAP also identifies the path within a pathway, which is differentially modulated in the tested conditions. The results are summarized through graphic interfaces highlighting the modulated genes and pathways in the different experimental conditions and the interactions among them.
The main novelty of PI is the possibility to analyze RNAseq data obtained by any species: in fact users can annotate the genes of interest against the KEGG orthologs (Kanehisa et al., 2016a) and then upload the annotations to perform the analysis.
To the best of our knowledge, only PaintOmics (García-Alcalde et al. 2011) is providing a similar pathway-based representation, but it is more focused on the integration of several omics sources through KEGG maps and does not support the upload of custom annotations nor topology-based enrichment algorithms. Finally, PI always runs on an updated knowledgebase: it exploits REST interfaces to retrieve on-the-fly pathway data from KEGG and identifiers’ mapping from bioDBnet (Mudunuri et al., 2009). This feature is particularly relevant given that popular tools often rely on old knowledgebases (http://dx.doi.org/10.1101/049288).
2 Design and implementation
PI is designed to perform several comparisons in one run, such as samples coming from different tissues in two conditions (e.g. roots, leaves and/or plant body in optimal conditions versus water stress). PI has two main modules, allowing users to easily perform differential expression analyses both at the gene level and at the pathway level with simple experimental designs. The tool handles only two-classes balanced comparisons (i.e. with the same number of biological replicates per class), but in principle both modules may be extended to handle more complex designs. Read counts are processed using the edgeR bioconductor package (Anders et al., 2013): weakly expressed genes are removed, read counts are normalized, dispersion values are estimated before fitting a generalized linear model to each feature, and finally a likelihood ratio test is performed to identify the differentially expressed genes (DEGs), according to the threshold set by the user (more details are available in the online documentation). At the pathway level, DEAP is used to identify enriched pathways (EPs) and their modulated components (modulated sub-pathway genes, MPGs) (Haynes et al., 2013). Pathway maps are dynamically downloaded from KEGG according to the user-selected organism, while the identifiers of the input gene list (extracted from the count data file) are converted using the web services of bioDBnet (Mudunuri et al., 2009). Several gene ID formats are accepted, such as Ensembl, Gene Symbol or GI Number, and they are then mapped onto the KEGG pathways. If the organism is not present in KEGG, users can perform the functional annotation using dedicated KEGG tools (Kanehisa et al., 2016b) and upload the resulting annotation file to PI. KEGG pathway maps are used for the reconstruction of gene networks. Since a node in the pathway map may correspond to more than one gene product, protein complexes are expanded in gene groups forming cliques as in (Sales et al., 2012). Finally, nodes interacting through a chemical compound are directly connected. The resulting graphs are passed to DEAP together with normalized count data. DEAP was originally developed for microarray data, thus read counts are transformed to log2-counts per million using the R package voom (Law et al., 2014). The list of EPs is built using few parameters, such as the p-value, set by the users (please refer to the online documentation).
For each comparison, the results of the differential analysis are reported in the form of a browsable network both at gene and pathway level, but the whole information is also available in several tables as outlined in Figure 1. Thanks to the information encoded in KEGG, the user can explore and follow links among pathways within the network of all EPs and, starting from a selected node, can browse the subnetwork of directly connected pathways. This pathway-centric view of the results is integrated with the gene-based differential analysis, which provides the list of involved genes together with the statistical information of the likelihood test. Moreover, users can easily switch to the gene-based network view corresponding to the MPGs subset, keeping track of the involved pathways. The PI interface allows users to explore their results, check the overlapping between the two analysis levels, and zoom in and out the more interesting parts of the analyzed biological system following the information flux. The global picture of the system is completed by a representation of the MPGs on KEGG maps (colors indicate the log fold change as computed by edgeR), providing also a link to the protein annotation in the public databases. PI provides a unique global view on multiple comparisons that are ‘simultaneously’ run: a unifying table of all the enriched pathways for each comparison, colored using the pathway enrichment significance level (DEAP P-value).
Fig. 1.
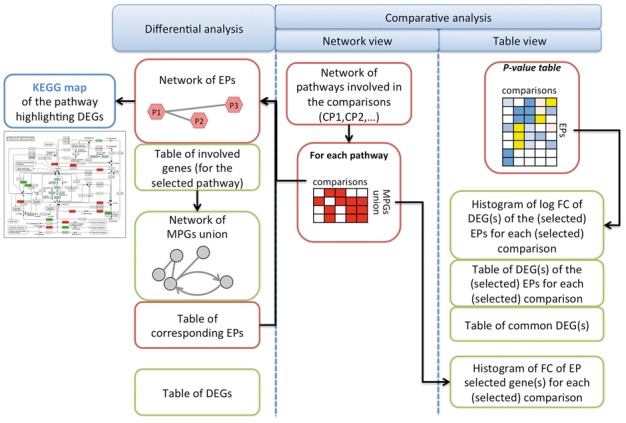
Schema of the performed analysis output (Color version of this figure is available at Bioinformatics online.)
PI is a scalable and parallelized web application, developed in Python exploiting the Django web framework and the d3 Javascript libraries, whereas CytoscapeJS is used for interactive result visualization (http://js.cytoscape.org). The backend is based on Celery, a task queue/job system distributing the computation on different servers (http://www.celeryproject.org/). The differential expression analysis is implemented in R, while DEAP is written in python. KEGG KGML files are downloaded and parsed automatically through the bioservices python libraries (https://pypi.python.org/pypi/bioservices/).
3 Conclusions
Expression studies are a common approach to investigate transcriptional activities in order to identify modulated genes organized in biological pathways. In case of non-model organisms this approach may be hampered by the difficulty of annotating genes into known pathways to identify EPs. To the best of our knowledge, tools accepting custom annotation to perform pathway enrichment are missing. The main novelty of PI is the possibility to easily discover modulated pathways for every sequenced organism, even if it is not present in the KEGG database. Users can annotate genes using the KEGG web services, eventually integrating the annotations with their knowledge. PI provides users with an easy to use one stop shop for their data analysis that requires limited user intervention (simple tabulated text files and analysis parameters) as input.
Funding
The Autonomous Province of Trento.
Conflict of Interest: none declared.
References
- Anders S. et al. (2013) Count-based differential expression analysis of RNA sequencing data using R and Bioconductor. Nat. Protoc., 8, 1765–1786. [DOI] [PubMed] [Google Scholar]
- García-Alcalde et al. (2011) Paintomics: a web based tool for the joint visualization of transcriptomics and metabolomics data. Bioinformatics., 27, 137–139. [DOI] [PMC free article] [PubMed] [Google Scholar]
- Haynes W.A. et al. (2013) Differential expression analysis for pathways. PLoS Comput. Biol., 9, e1002967.. [DOI] [PMC free article] [PubMed] [Google Scholar]
- Kanehisa M. et al. (2016a) KEGG as a reference resource for gene and protein annotation. Nucleic Acids Res., 44, D457–D462. [DOI] [PMC free article] [PubMed] [Google Scholar]
- Kanehisa M. et al. (2016b) BlastKOALA and GhostKOALA: KEGG tools for functional characterization of genome and metagenome sequences. J. Mol. Biol., 428, 726–731. [DOI] [PubMed] [Google Scholar]
- Khatri P. et al. (2012) Ten years of pathway analysis: current approaches and outstanding challenges. PLoS Comput. Biol., 8, e1002375.. [DOI] [PMC free article] [PubMed] [Google Scholar]
- Law C.W. et al. (2014) voom: Precision weights unlock linear model analysis tools for RNA-seq read counts. Genome Biol., 15, R29.. [DOI] [PMC free article] [PubMed] [Google Scholar]
- Mudunuri U. et al. (2009) bioDBnet: the biological database network. Bioinformatics, 25, 555–556. [DOI] [PMC free article] [PubMed] [Google Scholar]
- Sales G. et al. (2012) graphite – a Bioconductor package to convert pathway topology to gene network. BMC Bioinformatics, 13, 20.. [DOI] [PMC free article] [PubMed] [Google Scholar]