

Abstract
Motivation
In T-cell lymphoma, malignant T cells arising from a founding clone share an identical T cell receptor (TCR) and can be identified by the over-representation of this TCR relative to TCRs from the patient’s repertoire of normal T cells. Here, we demonstrate that TCR information extracted from RNA-seq data can provide a higher resolution view of peripheral T cell lymphomas (PTCLs) than that provided by conventional methods.
Results
For 60 subjects with PTCL, flow cytometry/FACS was used to identify and sort aberrant T cell populations from diagnostic lymph node cell suspensions. For samples that did not appear to contain aberrant T cell populations, T helper (TH), T follicular helper (TFH) and cytotoxic T lymphocyte (CTL) subsets were sorted. RNA-seq was performed on sorted T cell populations, and TCR alpha and beta chain sequences were extracted and quantified directly from the RNA-seq data. 96% of the immunophenotypically aberrant samples had a dominant T cell clone readily identifiable by RNA-seq. Of the samples where no aberrant population was found by flow cytometry, 80% had a dominant clone by RNA-seq. This demonstrates the increased sensitivity and diagnostic ability of RNA-seq over flow cytometry and shows that the presence of a normal immunophenotype does not exclude clonality.
Availability and Implementation
R scripts used in the processing of the data are available online at https://www.github.com/scottdbrown/RNAseq-TcellClonality
Supplementary information
Supplementary data are available at Bioinformatics online.
1 Introduction
Peripheral T cell lymphomas (PTCLs) represent 10-15% of non-Hodgkin lymphomas (Swerdlow et al., 2008). PTCL not otherwise specified (PTCL-NOS) and angioimmunoblastic T cell lymphoma (AITL) are the most common PTCL subtypes (Savage et al., 2004; Swerdlow et al., 2008). Both are aggressive lymphomas with cure rates of 20-30% by chemotherapy (Vose et al., 2008).
Lymphoid cancers are believed to arise from a single lymphocyte that acquires somatic mutations sufficient for malignant transformation. Progeny tumor cells obtain an increasingly diverse mutational landscape through tumor evolution, but all progeny share identical (clonal) rearrangements in T cell receptor (TCR) or, in the case of B cell lymphomas, immunoglobulin (Ig) genes. Clonal TCR and Ig rearrangements are useful for distinguishing malignant cells from the polyclonal background of normal lymphocytes. The use of flow cytometry to identify aberrance in cell surface markers is an important diagnostic tool in PTCLs (Chen et al., 2006); however, it is not directly informative regarding T cell clonality. Multiplex PCR methodologies are the current standard for inferring clonal TCR rearrangements in clinical practice. The PCR products of TCR genes can be analyzed for putative clonality using either heteroduplex analysis (Langerak et al., 1997) or GeneScanning (van Dongen et al., 2003), but only TCR sequence analysis can identify T cell clones unequivocally.
Deep sequencing of TCR amplicons (TCR-seq) is a powerful and sensitive method for characterizing the T cell repertoire (Freeman et al., 2009; Kirsch et al., 2015; Robins et al., 2009; Woodsworth et al., 2013; Wu et al., 2012). However, transcriptome sequencing (RNA-seq) is more informative, providing data from all transcribed genes present in the sample, and has proven utility in personalized oncology (Jones et al., 2010; Laskin et al., 2015). Obtaining TCR sequences directly from RNA-seq data can, in some settings, provide sufficient information on T cell clonal abundance to obviate the need for dedicated TCR-seq assays (Brown et al., 2015) which are associated with considerable added time and cost.
Here, we used flow cytometry/fluorescence-activated cell sorting (FACS) to identify and purify malignant T cell populations from non-malignant cells. We aimed to determine the utility of RNA-seq in establishing TCR clonality in samples with either an aberrant or normal (non-aberrant) T cell immunophenotype without the need for amplicon-based TCR-seq.
2 Methods
2.1 Clinical specimens and cell sorting
This study was approved by the University of British Columbia/British Columbia Cancer Agency (BCCA) Research Ethics Board (H14-01235). Sixty diagnostic lymph node cell suspensions were obtained from the BCCA Lymphoid Cancer Tumor Bank (32 PTCL-NOS, 28 AITL), collected from 1990 to 2014. Excess aliquots from each diagnostic specimen were placed in DMSO and stored at −80 °C. One additional lymph node cell suspension from a pre-diagnostic time point was included for one subject (PTCL-NOS), as were five tonsil biopsies from healthy subjects to be used as controls.
All specimens were stained with an 11 antibody panel to identify aberrant T and T follicular helper (TFH) cells. The panel (Supplemental Table S1) consisted of CD45 (common leukocyte marker), lineage-specific T cell antibodies (CD3, CD4, CD8), pan-T cell antibodies (CD2, CD5, CD7), TFH cell antibodies (CXCR5, PD1), CD10 (for the detection of aberrant T cells in AITL), and CD19 (for the detection of B cells). Data was acquired on a Becton Dickinson FACSAria3 instrument as part of a sorting experiment to isolate tumor cell subpopulations. Data was analyzed by conventional gating and bivariate plot display using FlowJo software (version 10.0.8).
FACS was used to identify and purify specimens with an aberrant immunophenotype (Fig. 1). T cell surface marker aberrance was defined as the loss of one or more lineage-specific (CD3, CD4 or CD8) or pan-T cell marker (CD2, CD5 or CD7) or the gain of CD10. Skewing of the CD4:CD8 ratio (e.g. >10 or <0.5) was not a criterion for aberrancy; however, we acknowledge that marked skewing is suggestive of clonal dominance. A population was defined as ≥ 1% of viable lymphocytes. For specimens without an aberrant immunophenotype, and for tonsil biopsies from healthy controls, TH, TFH and CTL populations were sorted (Fig. 1c).
Fig. 1.
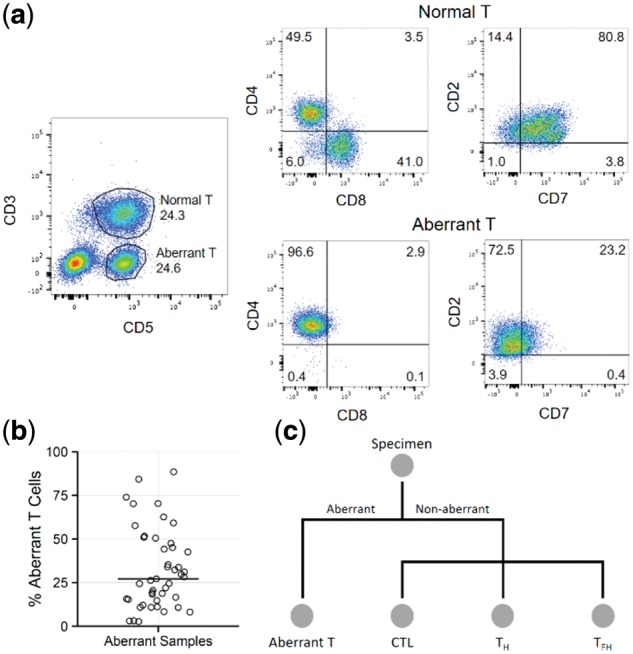
Specimen processing and cell sorting. (a) After gating on CD45+ cells, normal (CD3+, 24.3%) and aberrant (CD3-, 24.6%) T cell populations are identified. The normal population is composed of a mixture of CD4+ and CD8+ cells, and has no aberrant loss of CD7. The aberrant population is composed exclusively of CD4+ cells, and demonstrates aberrant loss of CD3 and CD7. (b) Aberrant T cell populations were present at a range of frequencies (2.7% - 88.5%) in lymph node cell suspensions (horizontal bar marks median). (c) Overview of the FACS sorting strategy. All specimens were stained identically as described in Methods. If an aberrant population was identified, it was sorted to purity. Non-aberrant and control cases were sorted into CTL, TH, and TFH subpopulations
2.2 Sequencing
RNA was extracted from FACS-sorted cells using Qiagen Allprep DNA/RNA column-based extraction kits as per the manufacturer’s instructions. RNA-seq was performed on DNase-treated samples using an RNA-seq lite plate-based protocol with SMART cDNA amplification. Non-aberrant cell subsets with the highest RNA quality for each subject were selected for RNA-seq library construction and sequencing (> 10 ng RNA and RNA quality score ≥ 6.4), as these were most likely to produce informative sequencing data to identify a dominant clone among immunophenotypically normal T cells. All samples were initially subjected to shallow sequencing (average 4.1 million total reads per sample, range 2.4–6.0 million) to facilitate the identification of the malignant T-cell clone in the sorted populations. To evaluate the importance of sequence depth for this application, all samples were re-sequenced deeply (average 92 million total reads per sample, range 63–156 million). All sequencing was performed using 125 nucleotide paired-end reads on an Illumina HiSeq 2500 instrument at the Genome Sciences Centre in Vancouver, Canada.
2.3 Analysis of clonality
MiTCR software (Bolotin et al., 2013) with modified settings (TRAV minAlignmentMatches: 12, TRAJ minAlignmentMatches: 19, TRBV minAlignmentMatches: 14, TRBJ minAlignmentMatches: 16) (Brown et al., 2015) was used to identify TCR alpha and beta CDR3-containing reads present in the sequencing data, generating a list of CDR3s (clonotypes) and their relative abundances. Non-productive CDR3 sequences (containing a frame-shift or stop codon) were removed from the analysis as they are most likely the result of incomplete allelic exclusion (Li and Wilkinson, 1998). CDR3 sequences initially classified, inappropriately, as both alpha and beta were subsequently resolved by assigning the chain which had greater read support. Low-abundance CDR3s which had equal numbers of supporting reads for both chains were marked as ambiguous. TCR gamma or delta chain sequences were not interrogated because extensive optimization and validation of TCR extraction from transcriptome data is required (Brown et al., 2015) and this has only been done for alpha-beta TCR analysis. A dominance metric D for each recovered clonotype c in sample s was calculated as shown in equation 1,
| (1) |
where Rsc denotes the number of reads in sample s supporting clonotype c, RsHc denotes the number of reads in sample s supporting clonotypes of chain H which matches the chain of clonotype c, and Rs denotes the total number of reads in sample s. This metric is the product of two proportions: the proportion of chain-specific TCR reads and the proportion of total sequence reads. Together, these provide a measure of the clonotype abundance relative to all clonotypes identified, as well as relative to the size of the sequence dataset.
To determine which CDR3 sequences were dominant (above background), chain-specific thresholds were set as the maximum Dcs derived from control samples for each chain; clonotypes above the threshold are dominant (5.38 × 10⁻⁷ for shallow alpha, 2.28 × 10⁻⁷ for shallow beta, 2.27 × 10⁻⁸ for deep alpha, 9.85 × 10⁻⁸ for deep beta). These thresholds are experiment-specific, and controls containing the expected normal polyclonal background of T cells for each future experiment would be required.
Due to allelic exclusion, each T cell clone should only express one beta chain (Khor and Sleckman, 2002), therefore the most abundant beta clonotype (if present, otherwise alpha) was used to define the relative abundance of the clonal T cell in each subject. TCR gamma gene rearrangements are observed in most alpha-beta T cells, and thus is used as the target for heteroduplex TCR analysis (Langerak et al., 1997). This assay was performed on 54 of the 60 PTCL samples at the time of diagnosis (from 1990 to 2014). GeneScanning was not available at our cancer centre during the period of sample collection. The results from the heteroduplex analysis were compared to the MiTCR analysis to determine if there was improved sensitivity from the sequence-based approach.
2.4 Estimating tumor content
As all samples are comprised of sorted T cell populations, the tumor content of a sample can be estimated using the relative abundance of the dominant T cell. This approach is valid assuming all cells sequenced are alpha-beta T cells, all cells are expressing the TCR at a roughly equal level, and all TCR transcripts have an equal probability of being captured and sequenced. Due to allelic exclusion, each T cell clone should only express one beta chain, therefore the most abundant beta clonotype (if present, otherwise alpha) was used to define each clonal T cell and estimate tumor content. As an additional metric for assessing tumor content, the Shannon Entropy (Shannon, 1948) was calculated for each sample using the entropy package for R (v3.1.1). The Shannon Entropy quantifies the information content of a set of entities with associated abundances by measuring the uncertainty associated with predicting the identity of a randomly chosen entity. A high value corresponds to high uncertainty, and thus high diversity, whereas a low value corresponds to a set with low diversity.
2.5 Gene expression
RNA-seq files were aligned to the hg38 reference transcriptome using Bowtie2 (Langmead and Salzberg, 2012) (v2.0.2) and gene expression was quantified using RSEM (Li and Dewey, 2011) (v1.2.29). TPM (transcripts per million) values for TCR constant genes were centered and scaled, and used to determine if samples showed evidence of alpha-beta or gamma-delta TCR expression.
3 Results and discussion
3.1 Identification of dominant TCRs
In 45 of the 60 total cases, at least one aberrant population (Fig. 1a) of varying abundance (median 27.1% of lymphocytes; Fig. 1b) was isolated by FACS. The remaining 15 cases, plus 5 controls, were sorted into at least one of CTL, TH and TFH populations (Fig. 1c). Two cases had two distinct aberrant populations each, which were sorted. In total, 82 sorted cell populations (samples) were isolated from the 65 specimens. These were subjected to RNA-seq (Supplementary Table S2) and bioinformatic extraction of TCR alpha- and beta-chain sequences.
The threshold for determining the dominance of a TCR clonotype was computed by setting the 15 control samples as background (Supplementary Fig. S1). Using this threshold, evidence of a dominant TCR clonotype was obtained in 96% of samples (45/47) that were aberrant by flow cytometry (Supplementary Figure S2), but also in 80% of samples (16/20) that had appeared non-aberrant by flow cytometry (Supplementary Figure S3). The samples that were aberrant by flow cytometry and also appeared aberrant by TCR sequence analysis typically showed a highly abundant dominant clonotype with a minimal background of low-abundance clonotypes (Fig. 2). Samples that were non-aberrant by flow cytometry, but aberrant by TCR sequence analysis, generally had a dominant clone, but also a larger background repertoire, similar to the diverse repertoire of normal T cells seen in healthy controls (Fig. 2). Thus, although the specimens that were non-aberrant by flow cytometry appeared to be immunophenotypically normal, they clearly contained a malignant clone. This suggests that malignant lymphocytes can retain a normal immunophenotype despite underlying clonality, and demonstrates the increased sensitivity and diagnostic ability of RNA-seq over FACS. In general, deeper sequencing results did not provide additional utility, as results were consistent with those obtained by shallow sequencing (Supplementary Fig S4).
Fig. 2.
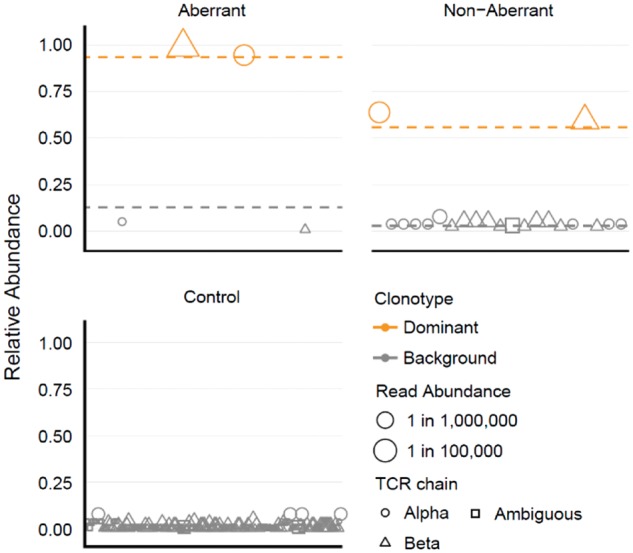
Identification of dominant clonotypes. Clonotypes from one representative sample for each category are displayed. The relative abundance of each clonotype is shown on the y-axis, calculated as the abundance of each clonotype relative to the total abundance of all clonotypes of the same chain in that sample. Clonotypes are plotted along the x-axis in lexicographical order. Clonotypes determined to be dominant are colored orange. The read abundance of each clonotype is represented by its size. Mean relative abundance of dominant or background clonotypes for all samples of each category are shown as dashed horizontal lines
3.2 Comparison to existing clinical assay
Of the 45 diagnostic specimens which were immunophenotypically aberrant, 39 had clinical heteroduplex testing performed (Langerak et al., 1997). Of these, 31 tested positive, and all 31 were also positive by RNA-seq analysis. Of the 8 which tested negative, 7 were positive by RNA-seq analysis. Of the 20 diagnostic specimens which were immunophenotypically normal, 15 had clinical heteroduplex testing performed. Of these, 13 tested positive, and 11 of these were also positive by RNA-seq analysis. The 2 heteroduplex-positive and RNA-seq-negative specimens likely reflect missing sequence data; these specimens had unsequenced samples, due to RNA quality, which may contain the malignant clone. Of the 2 which tested negative by clinical heteroduplex testing, 1 was positive by RNA-seq analysis.
3.3 Using diversity to identify malignant clones without alpha-beta TCR
Shannon entropy (Shannon, 1948) was calculated as a measure of TCR diversity for each sample. The relative abundance of the dominant T cell clone was used as a surrogate for tumor content, and showed an expected negative correlation with Shannon entropy (Pearson r = -0.90; Fig. 3). There were two aberrant outliers with low entropy and no dominant clonotype identified, suggesting these aberrant cells do not express TCR alpha or beta. These samples had low expression of TCR alpha and beta constant genes (TRAC, TRBC1/2) and high expression of TCR gamma and delta constant genes (TRGC1/2, TRDC; P ≤ 0.032, Mann-Whitney U tests), suggesting these may be gamma-delta PTCLs.
Fig. 3.
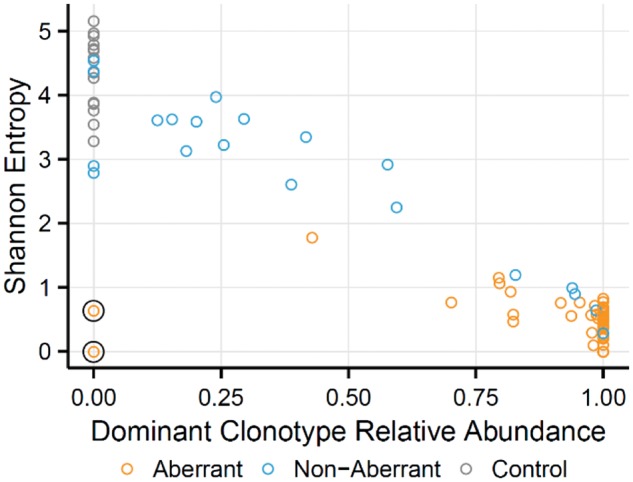
Characterization of sample diversity. Relationship between dominant clone relative abundance and Shannon entropy. Increasing dominant clone abundance shows decreasing Shannon entropies. The two aberrant samples with low Shannon entropy and absence of a dominant clone (circled) may represent cases where the malignant clone did not express an alpha-beta TCR
3.4 Recurrent TCR sequences
There was no dominant TCR shared across subjects. There were four examples of dominant TCR sharing between different samples from the same subject: two of these occurred in subjects with two immunophenotypically distinct aberrant populations, possibly due to cell surface marker diversification post-malignant transformation; and two occurred in separate non-aberrant subsets, likely reflecting impurity from FACS as they showed unequal abundance between samples. Supplementary Table 3 summarizes all TCRs identified.
4 Conclusion
These data demonstrate the utility of mining TCR sequences from RNA-seq data obtained from diagnostic lymph nodes to define malignant T cells. This is feasible using only light-coverage RNA-seq data. Deeper sequencing, while producing more robust data, was largely unnecessary as it did not improve the ability to detect dominant clonotypes in almost all cases, highlighting the usefulness and cost-effectiveness of shallow RNA-seq to detect clonality in PTCLs. For the current analysis, data was generated using sorted cell populations from lymphoma tissues, but we expect that for many lymphomas and leukemias, malignant clones would be similarly recognizable from blood. Thus, in the future, analysis of TCR profiles extracted from RNA-seq data from unsorted PTCL populations should be feasible and could serve as a useful assay in the diagnosis of T cell lymphoproliferative disorders. Further, this method yields a unique sequence identifier in clinical samples that could find utility as a personalized marker to monitor response to treatment, assess minimal residual disease, identify the onset of recurrence, and track tumor evolution.
Supplementary Material
Acknowledgements
Contribution: S.D.B. and G.H. contributed equally to this work. G.H. performed sample preparation and FACS analysis, and S.D.B. performed bioinformatic analysis. All authors contributed towards the conception and design, data analysis and interpretation, and contributed to and approved the final manuscript.
Funding
This work was supported by funds from The Canadian Networks of Centres of Excellence BioCanRx (Biotherapeutics for Cancer Treatment) Network, Genome British Columbia, the British Columbia Cancer Foundation, Genome Canada (212SEQ) and Canadian Institutes of Health Research (CIHR; MOP-102679). S.D.B. is supported by a CIHR Frederick Banting and Charles Best Canadian Graduate Scholarship.
Conflict of Interest: none declared.
References
- Bolotin D.A. et al. (2013) MiTCR: software for T-cell receptor sequencing data analysis. Nat. Methods, 10, 813–814. [DOI] [PubMed] [Google Scholar]
- Brown S.D. et al. (2015) Profiling tissue-resident T cell repertoires by RNA sequencing. Genome Med., 7, 125.. [DOI] [PMC free article] [PubMed] [Google Scholar]
- Chen W. et al. (2006) Flow cytometric features of angioimmunoblastic T-cell lymphoma. Cytometry B. Clin. Cytom., 70, 142–148. [DOI] [PubMed] [Google Scholar]
- van Dongen J.J.M. et al. (2003) Design and standardization of PCR primers and protocols for detection of clonal immunoglobulin and T-cell receptor gene recombinations in suspect lymphoproliferations: report of the BIOMED-2 Concerted Action BMH4-CT98-3936. Leukemia, 17, 2257–2317. [DOI] [PubMed] [Google Scholar]
- Freeman J.D. et al. (2009) Profiling the T-cell receptor beta-chain repertoire by massively parallel sequencing. Genome Res., 19, 1817–1824. [DOI] [PMC free article] [PubMed] [Google Scholar]
- Jones S.J.M. et al. (2010) Evolution of an adenocarcinoma in response to selection by targeted kinase inhibitors. Genome Biol., 11, R82. [DOI] [PMC free article] [PubMed] [Google Scholar]
- Khor B., Sleckman B.P. (2002) Allelic exclusion at the TCRβ locus. Curr. Opin. Immunol., 14, 230–234. [DOI] [PubMed] [Google Scholar]
- Kirsch I.R. et al. (2015) TCR sequencing facilitates diagnosis and identifies mature T cells as the cell of origin in CTCL. Sci. Transl. Med., 7, 308ra158–308ra158. [DOI] [PMC free article] [PubMed] [Google Scholar]
- Langerak A.W. et al. (1997) Heteroduplex PCR analysis of rearranged T cell receptor genes for clonality assessment in suspect T cell proliferations. Leukemia, 11, 2192–2199. [DOI] [PubMed] [Google Scholar]
- Langmead B., Salzberg S.L. (2012) Fast gapped-read alignment with Bowtie 2. Nat. Methods, 9, 357–359. [DOI] [PMC free article] [PubMed] [Google Scholar]
- Laskin J. et al. (2015) Lessons learned from the application of whole-genome analysis to the treatment of patients with advanced cancers. Mol. Case Stud., 1, a000570. [DOI] [PMC free article] [PubMed] [Google Scholar]
- Li B., Dewey C.N. (2011) RSEM: accurate transcript quantification from RNA-Seq data with or without a reference genome. BMC Bioinformatics, 12, 323.. [DOI] [PMC free article] [PubMed] [Google Scholar]
- Li S., Wilkinson M.F. (1998) Nonsense Surveillance in Lymphocytes? Immunity, 8, 135–141. [DOI] [PubMed] [Google Scholar]
- Robins H.S. et al. (2009) Comprehensive assessment of T-cell receptor β-chain diversity in αβ T cells. Blood, 114, 4099–4107. [DOI] [PMC free article] [PubMed] [Google Scholar]
- Savage K.J. et al. (2004) Characterization of peripheral T-cell lymphomas in a single North American institution by the WHO classification. Ann. Oncol., 15, 1467–1475. [DOI] [PubMed] [Google Scholar]
- Shannon C.E. (1948) A Mathematical Theory of Communication. Bell Syst. Tech. J., 5, 3. [Google Scholar]
- Swerdlow S. et al. (2008) WHO Classification of Tumours of Haematopoietic and Lymphoid Tissues. 4th ed.IARC, Lyon, France. [Google Scholar]
- Vose J. et al. (2008) International peripheral T-cell and natural killer/T-cell lymphoma study: pathology findings and clinical outcomes. J. Clin. Oncol., 26, 4124–4130. [DOI] [PubMed] [Google Scholar]
- Woodsworth D.J. et al. (2013) Sequence analysis of T-cell repertoires in health and disease. Genome Med., 5, 98.. [DOI] [PMC free article] [PubMed] [Google Scholar]
- Wu D. et al. (2012) High-throughput sequencing detects minimal residual disease in acute T lymphoblastic leukemia. Sci. Transl. Med., 4, 134ra63. [DOI] [PubMed] [Google Scholar]
Associated Data
This section collects any data citations, data availability statements, or supplementary materials included in this article.