Abstract
Larval zebrafish react to changes in ambient illumination with a series of stereotyped motor responses, called the visual motor response (VMR). The VMR has been used widely in zebrafish models to analyze how genetic or environmental manipulations alter neurological function. Prior studies elicited the VMR using white light. In order to elucidate the underlying afferent pathways and to identify light wavelengths that elicit the VMR without also activating optogenetic reagents, we employed calibrated narrow-waveband light sources to analyze the spectral properties of the response. Narrow light wavebands with peaks between 399nm and 632nm triggered the characteristic phases of the VMR, but there were quantitative differences between responses to different light wavelengths at the same irradiant flux density. The O-bend component of the VMR was elicited readily at dark onset following illumination in 399nm or 458nm light, but was less prominent at the transition from 632nm light to dark. Conversely, stable motor activity in light was observed at 458nm, 514nm, and 632nm, but not at 399nm. The differential effect of discrete light wavebands on components of the VMR suggests they are driven by distinct photoreceptor populations. Furthermore, these data enable the selection of light wavebands to drive the VMR in a separate channel to the activation of optogenetic reagents and photosensitizers.
Keywords: zebrafish, visual motor response, Reflex, optogenetics, Retina, non-visual opsins
Introduction
Zebrafish are increasingly used as a model to understand the neurobiological basis of vertebrate behavior and the pathogenesis of human neurological diseases. An extensive array of genetic tools can be combined with intravital imaging, electrophysiology and quantitative neurobehavioral assays to determine the structural and functional consequences of molecular manipulations. The visual motor response (VMR) [3, 12], a stereotypical series of larval motor responses provoked by changes in ambient illumination, has been used extensively to evaluate sensorimotor function of zebrafish mutants [8] and transgenic lines [16], and to characterize neurobehavioral responses to chemical toxins [10] and drugs [15]. In stable lighting conditions, zebrafish larvae make frequent low-amplitude propulsive and turning movements [3]. These occur stochastically with an approximately constant probability over time, such that averaging the displacements of a group of larvae reveals a steady level of population motor activity. At an abrupt transition from light to dark, zebrafish larvae make a high-angle turn with latency of 150 – 500 ms, called an O-bend, followed by a propulsive movement [3]. After this immediate response, the frequency with which larvae make small propulsive and turning movements remains elevated for 10 – 15 minutes, following which motor activity slowly falls below the baseline activity in light. The O-bend is dependent on retinal function [12]. Zebrafish retinal photoreceptors include rods and four different types of cone with distinct spectral sensitivities (UV, short-, medium- and long-wavelength), attributable to expression of 8 different opsins whose absorption maxima span the range 354nm – 557nm [5]. Action spectra for individual cones are broad [9] and the zebrafish retina can sense light across a wide range of wavelengths from <350nm to >600nm. Long term changes in motor activity occurring after the O-bend persist in animals lacking eyes; it is thought that photoreceptors in the zebrafish brain mediate the afferent limb of this component of the VMR [12], but little is known about their properties.
Studies to date have elicited the VMR using white light. Consequently, there is no information on the spectral sensitivity of the VMR. In addition to helping identify the receptors mediating the response, this information will be important for exploiting approaches that are currently being developed for light-dependent ablation of genetically-targeted neuronal groups [14, 18]. In order to employ the VMR as a functional endpoint in neuro-ablation studies using these reagents, it will be critical to elicit the response using light wavelengths that do not overlap with the excitation spectra of photosensitizers.
We characterized the VMR in larval zebrafish using calibrated LED light sources of defined wavelength. We conclude that the VMR can be elicited by narrow-waveband light over a wide range of wavelengths, but quantitative differences in the responses to specific wavelengths suggest that discrete photoreceptor populations underlie the component parts of the response.
Materials and methods
Zebrafish and motor assays
Experiments were carried out in in accordance with all local and federal regulations and with approval from the University of Pittsburgh Institutional Animal Care and Use Committee. Zebrafish were raised in E3 buffer (5mM NaCl, 0.17mM KCl, 0.33mM CaCl2, 0.33mM MgSO4) at 28.5°C in an incubator with white light illumination (color temperature 4900K; brightness 200 Lux) on a light-dark cycle (14 light:10 dark hours, light starts at 08:00). At 5 days post-fertilization (dpf), zebrafish larvae were transferred to 96-well plates in fresh E3 buffer and allowed to acclimatize inside a recording incubator for 30 minutes before experiments started. Video recordings of larvae swimming in the wells of the 96-well plate were captured at 4 frames/s under infrared illumination and analyzed as described in our previous work [4, 19].
Illumination
A light box was constructed using LED modules (cat # LBM-UV3SMD, LBM-B3SMD, LBM-G3SMD, LBM-R3SMD, LBM-CW3SMD, SuperBright LEDs, St. Louis MO, USA) mounted on a white board behind a diffuser screen, in a mosaic pattern such that each light channel illuminated the screen evenly. LED power circuits were controlled using N-channel MOSFETs (International Rectifier #IRLB8721PbF, Adafruit Industries, NY) with the gate voltage driven by digital output signals from an ATmega328P microcontroller board (Arduino Uno, Mouser Electronics, Mansfield, TX), allowing use of pulse width modulation for calibrating each channel to deliver equal irradiant flux density. Light spectra were captured and analyzed using a 280 – 900nm BLK-CXR spectrometer with a 0.25 inch UV-NIR cosine receptor/diffuser and SpectraWiz software (StellarNet, Tampa, FL).
Data analysis
All experiments were replicated a minimum of three times. Quantitative comparisons were derived from groups of 192 larvae from two independent experiments, each averaged over three complete cycles of stimuli. Data were analyzed using 1-way ANOVA with Tukey’s post hoc test for pairwise comparisons.
Results
Calibrated fixed-wavelength light stimuli
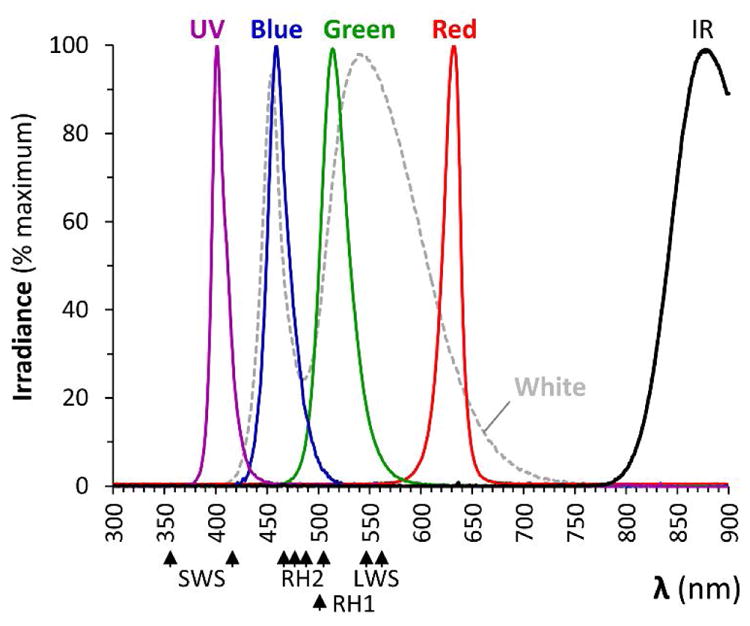
We first constructed a light-emitting diode (LED) array, allowing zebrafish to be exposed to light of equal irradiant flux density at pre-defined wavelengths. The spectrum emitted from each channel of the array (figure 1 and table 1) was measured under identical conditions to those employed during subsequent experiments. The UV, blue, green and red LEDs each produced a narrow spectrum with a single peak and limited overlap between channels. Light from the ‘white’ LEDs consisted of two peaks at blue and amber wavelengths, the latter with a broad range (color temperature 6545K). We employed a microcontroller board to control the LED array, using pulse-width modulation (PWM) to calibrate each channel to yield equal irradiant flux density. The PWM frequency was 490Hz, well above the maximum flicker fusion frequency of the zebrafish electroretinogram (30Hz at 5dpf) [17].
Figure 1. Spectral properties of lights used in the study.

Irradiance spectra are shown for the LED light sources used in this study, measured at the position occupied by the zebrafish within the behavioral apparatus. Spectra from the four single-color LED sources are shown as solid colored lines; the white LED source is shown by a dotted line; the infrared light source used for video recording is labeled ‘IR’. For comparison, absorption maxima are shown for opsins expressed in short (SWS1) and long (SWS2) single cones, principal (LWS1 and 2) and accessory (RH2 1 – 4) double cones and rods (RH1).
Table 1.
Properties of light sources
| UV | Blue | Green | Red | IR | White | ||
|---|---|---|---|---|---|---|---|
| Peak (nm) | 399.0 | 458.5 | 514.0 | 632.5 | 876.9 | 453.5 | 555.5 |
| Centroid (nm) | 404.0 | 460.2 | 517.2 | 630.5 | - | 455.3 | 546.8 |
| Full width at half height (nm) | 15.7 | 20.7 | 31.8 | 16.1 | 50.8 | 22.0 | 121.0 |
| Range (nm) | 375.0–443.5 | 431.0–536.0 | 469.5–600.5 | 565.5–674.0 | 793.8– | 409.0 – 694.5 | |
Visual motor response elicited by red, blue or green light
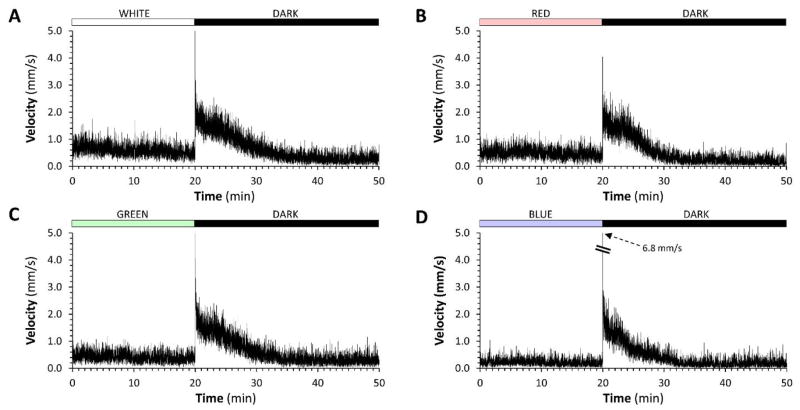
We next elicited the VMR using white or single-color light stimuli. Following acclimatization to the recording chamber, zebrafish were adapted to stable lighting conditions (450mW/m2) for 40 minutes, after which illumination was abruptly discontinued. The response to white light was identical to that previously reported (figure 2A). Red (figure 2B), green (figure 2C) and blue (figure 2D) light each elicited a similar response to white light. Zebrafish showed stable activity under illumination, regardless of light wavelength. At the light-dark transition, a synchronous and abrupt increase in motor activity was observed, corresponding to the O-bend response. Following this, larval motor activity remained elevated for several minutes and then slowly declined over 10 – 15 minutes, until activity fell below the baseline level in light. These data show that narrow waveband light is sufficient to evoke the VMR over a wide range of visible wavelengths. However, the time course of the full VMR (> 1 hour for each response) prevented quantitative comparison of responses to different colored lights in the same sample of larvae, because motor activity in 96 well plates declines significantly over a prolonged recording period [11].
Figure 2. The zebrafish visual motor response elicited with red, green or blue light is similar to the white light response.
In each panel, 96 zebrafish larvae at 5dpf were recorded swimming in the wells of a 96-well plate at 4 frames/sec using infrared macrovideography. The y-axis shows mean displacement of the 96 larvae at each frame-to-frame transition, scaled to show instantaneous mean velocity in mm/s as a measure of group motor activity. The traces show the final 20 minutes of a 40 minute acclimatization period to light (A: white; B: red; C: green; D: blue; all lights were calibrated to 450mW/cm2), followed by the first 30 minutes of the response to an abrupt light-dark transition.
Quantitative differences in the VMR elicited by different light wavelengths
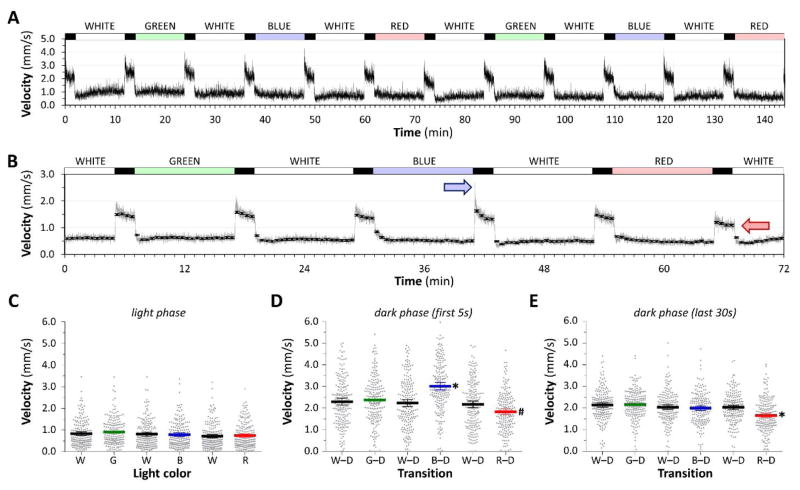
In order to compare responses to different light wavelengths quantitatively, we employed an abbreviated VMR paradigm consisting of alternating cycles of white and colored light each lasting 10 minutes, separated by 2 minutes of dark. This allowed analysis of multiple stimulus cycles in a single group of zebrafish. Zebrafish showed highly stereotyped responses to this stimulus pattern, reflecting key components of the full VMR (figure 3A), including stable motor activity under illumination and a burst of synchronous activity at the light-dark transition, followed by prolonged elevated activity that declined slowly over time. In addition, an abrupt reduction in activity occurred at the dark-light transition, followed by a rapid return to stable activity in light. By averaging the responses to multiple stimulus cycles, quantitative comparisons between responses to different wavelengths could be made within the same population of larvae (figure 3B).
Figure 3. Quantitative differences in the visual motor response elicited with light of different wavelengths.
A: Group motor activity of 96 zebrafish in response to changes in illumination indicated above the trace. All light channels were calibrated to 450mW/m2.
B: Responses were averaged over two experiments of three complete stimulus cycles (white – green – white – blue – white – red). The gray line shows mean frame-by-frame activity; the black markers show mean ± 2SE values for 30-second time bins. Colored arrows indicate the prominent O-bend response after blue light and the attenuated dark response following red light.
C, D, E: Scatter plots showing 192 individual zebrafish responses, each averaged over three stimulus cycles. Large colored bars show population mean ± 2SE. C: motor activity during minutes 2 – 8 of illumination in each light segment of the cycle; D: motor activity in the first 5 seconds after each light-dark transition of the cycle; E: motor activity in the final 30 seconds of each dark segment of the cycle. *p<0.0001, #p<0.01 compared with all other groups, 1-way ANOVA with Tukey post hoc test.
Under stable illumination, motor activity was not dependent on light wavelength and there were no significant differences between mean velocities in red, green, blue or white light (figure 3C). The synchronous burst of activity representing the O-bend response at the light-dark transition was more prominent following blue light illumination (figure 3D): mean velocity in the first 5 seconds after blue light (3.01 ± 0.09 mm/s) was substantially higher than after green light (2.34 ± 0.08 mm/s; p<0.0001) or any of the white light segments (2.30 ± 0.08, 2.23 ± 0.08, 2.17 ± 0.08 mm/s; p<0.0001). Conversely, group mean velocity in the first 5 seconds after red light was significantly lower than after other colors (1.83 ± 0.07 mm/s; p<0.01). Group mean velocity in the final 30 seconds of the dark phase following red light (1.66 ± 0.05 mm/s) was also lower than for other colors (range 2.00 ± 0.05 to 2.17 ± 0.05 mm/s; p<0.0001; figure 3E). These data show that, between 450nm and 650nm, motor activity under stable illumination was similar in light of identical irritant flux density, regardless of whether the light was composed of a broad or narrow spectral band, and regardless of its wavelength. However, the O-bend response was differentially augmented after acclimatization to blue light and decreased after exposure to red light. Furthermore, long-term changes in motor activity in the dark were less prominent after red light. These findings suggest that the component parts of the VMR can be partially dissociated by different sensory stimuli.
VMR evoked by ultraviolet light
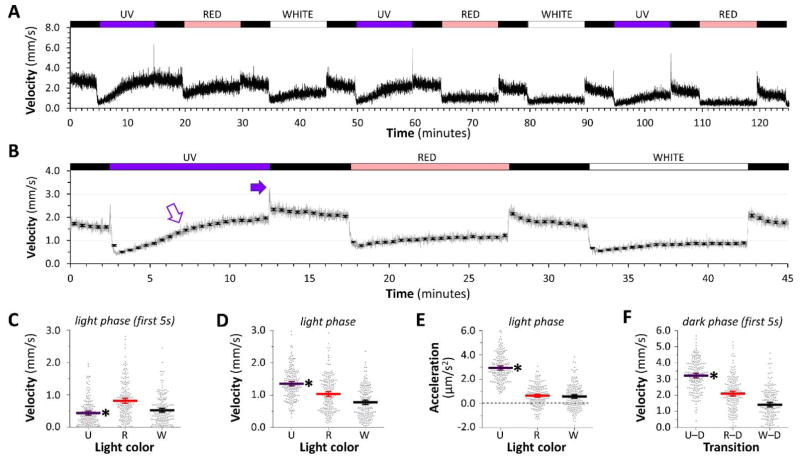
Changes in motor activity provoked by UV light differed slightly from responses to longer wavelengths (figure 4A, B). The initial level of motor activity at the dark-light transition (figure 4C) was lower for UV illumination (0.44 ± 0.03 mm/s) than for red (0.82 ± 0.04 mm/s) or half-intensity white light (0.52 ± 0.03 mm/s; p<0.0001). Motor activity during UV illumination was not stable, however, but steadily increased over time; consequently, mean velocity in UV light (1.36 ± 0.03 mm/s) was higher overall than in red light (1.037 ± 0.04 mm/s; p<0.0001) or white light (0.78 ± 0.03 mm/s; p<0.0001; figure 4D). Furthermore, mean acceleration of larval zebrafish over the same time period (figure 4E) was significantly higher in UV light (2.92 ± 0.08 μm/s2) than both red (0.63 ± 0.06 μm/s2; p<0.0001) and white light (0.57 ± 0.06 μm/s2; p<0.0001; figure 4E). Despite the attenuated suppression of motor activity during light, UV light provoked a robust O-bend response at the light-dark transition. Mean (± SE) velocity in the first 5 seconds after UV light was significantly higher (3.22 ± 0.07 mm/s) than red (2.07 ± 0.07 mm/s; p<0.0001) or half-intensity white light (1.4 ± 0.07 mm/s; p<0.0001; figure 4F). Together these data show that UV light evoked a robust O-bend response, but did not suppress motor activity to the same stable level as white light at half of the irradiant flux density. These data provide further evidence that component parts of the VMR can be dissociated by different stimuli.
Figure 4. Visual motor response elicited by UV light.
A: Group motor activity of 96 zebrafish in response to changes in illumination indicated above the trace. UV and red channels were calibrated to 300mW/m2; for comparison the white channel was calibrated to 150mW/m2.
B: Responses were averaged as shown in figure 3B. Closed arrow indicates the prominent O-bend response after UV light; open arrow shows increasing motor activity during UV illumination.
C, D, E, F: Scatter plots showing 192 individual zebrafish responses, each averaged over three cycles of light stimuli. The large bars show the population mean ± 2SE. C: motor activity in the first 5 seconds after each dark-light transition; D: motor activity during minutes 2 – 8 of illumination in each light segment of the cycle; E: mean acceleration during each light segment of the cycle; F: motor activity in the first 5 seconds after each light-dark transition. *p<0.0001 compared with both other groups, 1-way ANOVA with Tukey post hoc test.
Discussion
We employed carefully-calibrated narrow waveband light sources with defined characteristics to analyze the spectral properties of the VMR quantitatively. Our data indicate that narrow light wavebands between 399nm and 632nm can provoke motor responses that are similar to the previously described white light VMR. However, components of the VMR were elicited differentially by discrete wavebands, suggesting they are driven by distinct photoreceptor populations. It was recently shown that the O-bend component of the VMR is dependent on ocular function [12]. Given our finding that the O-bend response was elicited most readily after illumination with 399nm or 458nm light, we predict that this component of the VMR is predominantly driven by retinal short- or medium-wavelength sensitive cones [9]. The regulation of baseline motor activity by ambient illumination is thought to have both ocular and non-ocular components [12]. Our data suggest that a broad range of light wavelengths contributes to this (although the response was attenuated at 399nm and also somewhat at 632nm). This broad range may reflect a composite response from multiple receptors, including retinal photoreceptors and non-retinal cells expressing members of the extensive zebrafish non-visual opsin family [6, 12]. The combination of narrow waveband stimuli with zebrafish genetics and chemogenetic ablation should enable identification of the afferent VMR pathways in future studies. A similar approach has recently been deployed to study the role of blue and UV cones in the zebrafish optomotor response [13].
Our findings have practical implications. Emerging technologies for the analysis of neural circuits in the zebrafish CNS, and the elucidation of pathogenic mechanisms in zebrafish disease models, rely on reagents that are activated at specific light wavelengths. It would be desirable in many instances to elicit stereotypical motor responses to evaluate neural function, without unintentionally activating optogenetic ablation. Our data indicate that this should be straightforward. For example, the excitation spectrum of dL5/MG2I [14] is almost entirely non-overlapping with the green light spectrum used in the present study. This suggests that visual motor responses could be elicited using the 514nm green channel, both before and after chemoptogenetic ablation driven by far red light at 660nm. Likewise, the excitation spectrum of KillerRed [2] shows almost no overlap with the blue channel used in the present study, suggesting that the VMR could be controlled with blue light at 458nm, while optogenic ablation was driven by amber light at 575nm. Other applications might include eliciting the VMR at wavelengths that simultaneously either activate, or have no effect on, light-gated channels [7] or transporters [1]. However, the wide spectral sensitivity of the zebrafish VMR suggests that manipulations or measurements that rely on whole embryo illumination, even with narrow waveband light, will also elicit a motor response.
Highlights.
Zebrafish show stereotypical motor responses to changes in illumination
We characterized the spectral properties of the visual motor response (VMR)
Light at 399nm, 458nm, 514nm or 632nm elicited the characteristic phases of the VMR
Components of the VMR were differentially elicited by discrete light wavebands
Distinct photoreceptor populations likely mediate different components of the VMR
Acknowledgments
This work was supported in part by a grant from the National Institutes of Health (ES025606).
Footnotes
Contributions:
CEB conceived the idea for the study, built equipment, designed and carried out experiments and contributed to writing the paper; YZ designed and developed analysis methods; QB designed and carried out experiments; EAB built equipment, designed experiments, analyzed data and wrote the paper.
Publisher's Disclaimer: This is a PDF file of an unedited manuscript that has been accepted for publication. As a service to our customers we are providing this early version of the manuscript. The manuscript will undergo copyediting, typesetting, and review of the resulting proof before it is published in its final citable form. Please note that during the production process errors may be discovered which could affect the content, and all legal disclaimers that apply to the journal pertain.
References
- 1.Arrenberg AB, Del Bene F, Baier H. Optical control of zebrafish behavior with halorhodopsin. Proc Natl Acad Sci U S A. 2009;106:17968–17973. doi: 10.1073/pnas.0906252106. [DOI] [PMC free article] [PubMed] [Google Scholar]
- 2.Bulina ME, Chudakov DM, Britanova OV, Yanushevich YG, Staroverov DB, Chepurnykh TV, Merzlyak EM, Shkrob MA, Lukyanov S, Lukyanov KA. A genetically encoded photosensitizer. Nat Biotechnol. 2006;24:95–99. doi: 10.1038/nbt1175. [DOI] [PubMed] [Google Scholar]
- 3.Burgess HA, Granato M. Modulation of locomotor activity in larval zebrafish during light adaptation. J Exp Biol. 2007;210:2526–2539. doi: 10.1242/jeb.003939. [DOI] [PubMed] [Google Scholar]
- 4.Cario CL, Farrell TC, Milanese C, Burton EA. Automated measurement of zebrafish larval movement. J Physiol. 2011;589:3703–3708. doi: 10.1113/jphysiol.2011.207308. [DOI] [PMC free article] [PubMed] [Google Scholar]
- 5.Chinen A, Hamaoka T, Yamada Y, Kawamura S. Gene duplication and spectral diversification of cone visual pigments of zebrafish. Genetics. 2003;163:663–675. doi: 10.1093/genetics/163.2.663. [DOI] [PMC free article] [PubMed] [Google Scholar]
- 6.Davies WI, Tamai TK, Zheng L, Fu JK, Rihel J, Foster RG, Whitmore D, Hankins MW. An extended family of novel vertebrate photopigments is widely expressed and displays a diversity of function. Genome Res. 2015;25:1666–1679. doi: 10.1101/gr.189886.115. [DOI] [PMC free article] [PubMed] [Google Scholar]
- 7.Douglass AD, Kraves S, Deisseroth K, Schier AF, Engert F. Escape behavior elicited by single, channelrhodopsin-2-evoked spikes in zebrafish somatosensory neurons. Curr Biol. 2008;18:1133–1137. doi: 10.1016/j.cub.2008.06.077. [DOI] [PMC free article] [PubMed] [Google Scholar]
- 8.Emran F, Rihel J, Dowling JE. A behavioral assay to measure responsiveness of zebrafish to changes in light intensities. J Vis Exp. 2008 doi: 10.3791/923. [DOI] [PMC free article] [PubMed] [Google Scholar]
- 9.Endeman D, Klaassen LJ, Kamermans M. Action spectra of zebrafish cone photoreceptors. PLoS One. 2013;8:e68540. doi: 10.1371/journal.pone.0068540. [DOI] [PMC free article] [PubMed] [Google Scholar]
- 10.Faria M, Garcia-Reyero N, Padros F, Babin PJ, Sebastian D, Cachot J, Prats E, Arick M, II, Rial E, Knoll-Gellida A, Mathieu G, Le Bihanic F, Escalon BL, Zorzano A, Soares AM, Raldua D. Zebrafish Models for Human Acute Organophosphorus Poisoning. Scientific reports. 2015;5:15591. doi: 10.1038/srep15591. [DOI] [PMC free article] [PubMed] [Google Scholar]
- 11.Farrell TC, Cario CL, Milanese C, Vogt A, Jeong JH, Burton EA. Evaluation of spontaneous propulsive movement as a screening tool to detect rescue of Parkinsonism phenotypes in zebrafish models. Neurobiol Dis. 2011;44:9–18. doi: 10.1016/j.nbd.2011.05.016. [DOI] [PMC free article] [PubMed] [Google Scholar]
- 12.Fernandes AM, Fero K, Arrenberg AB, Bergeron SA, Driever W, Burgess HA. Deep brain photoreceptors control light-seeking behavior in zebrafish larvae. Curr Biol. 2012;22:2042–2047. doi: 10.1016/j.cub.2012.08.016. [DOI] [PMC free article] [PubMed] [Google Scholar]
- 13.Hagerman GF, Noel NC, Cao SY, DuVal MG, Oel AP, Allison WT. Rapid Recovery of Visual Function Associated with Blue Cone Ablation in Zebrafish. PLoS One. 2016;11:e0166932. doi: 10.1371/journal.pone.0166932. [DOI] [PMC free article] [PubMed] [Google Scholar]
- 14.He J, Wang Y, Missinato MA, Onuoha E, Perkins LA, Watkins SC, St Croix CM, Tsang M, Bruchez MP. A genetically targetable near-infrared photosensitizer. Nat Methods. 2016;13:263–268. doi: 10.1038/nmeth.3735. [DOI] [PMC free article] [PubMed] [Google Scholar]
- 15.Irons TD, Kelly PE, Hunter DL, Macphail RC, Padilla S. Acute administration of dopaminergic drugs has differential effects on locomotion in larval zebrafish. Pharmacol Biochem Behav. 2013;103:792–813. doi: 10.1016/j.pbb.2012.12.010. [DOI] [PMC free article] [PubMed] [Google Scholar]
- 16.Prober DA, Rihel J, Onah AA, Sung RJ, Schier AF. Hypocretin/orexin overexpression induces an insomnia-like phenotype in zebrafish. J Neurosci. 2006;26:13400–13410. doi: 10.1523/JNEUROSCI.4332-06.2006. [DOI] [PMC free article] [PubMed] [Google Scholar]
- 17.Seeliger MW, Rilk A, Neuhauss SC. Ganzfeld ERG in zebrafish larvae. Doc Ophthalmol. 2002;104:57–68. doi: 10.1023/a:1014454927931. [DOI] [PubMed] [Google Scholar]
- 18.Teh C, Chudakov DM, Poon KL, Mamedov IZ, Sek JY, Shidlovsky K, Lukyanov S, Korzh V. Optogenetic in vivo cell manipulation in KillerRed-expressing zebrafish transgenics. BMC Dev Biol. 2010;10:110. doi: 10.1186/1471-213X-10-110. [DOI] [PMC free article] [PubMed] [Google Scholar]
- 19.Zhou Y, Cattley RT, Cario CL, Bai Q, Burton EA. Quantification of larval zebrafish motor function in multiwell plates using open-source MATLAB applications. Nat Protoc. 2014;9:1533–1548. doi: 10.1038/nprot.2014.094. [DOI] [PMC free article] [PubMed] [Google Scholar]


