Abstract
Mitochondria are involved in cellular energy metabolism and use oxygen to produce energy in the form of adenosine triphosphate (ATP). Differential centrifugation at low- and high-speed is commonly used to isolate mitochondria from tissues and cultured cells. Crude mitochondrial fractions obtained by differential centrifugation are used for respirometry measurements. The differential centrifugation technique is based on the separation of organelles according to their size and sedimentation velocity. The isolation of mitochondria is performed immediately after tissue harvesting. The tissue is immersed in an ice-cold homogenization medium, minced using scissors and homogenized in a glass homogenizer with a loose-fitting pestle. The differential centrifugation technique is efficient, fast and inexpensive and the mitochondria obtained by differential centrifugation are pure enough for respirometry assays. Some of the limitations and disadvantages of isolated mitochondria, based on differential centrifugation, are that the mitochondria can be damaged during the homogenization and isolation procedure and that large amounts of the tissue biopsy or cultured cells are required for the mitochondrial isolation.
Keywords: Cellular Biology, Issue 121, Mitochondria, mitochondrial isolation, differential centrifugation, oxidative phosphorylation, oxygen consumption, high-resolution respirometry, skeletal muscle
Introduction
Mitochondrial bioenergetics and respiratory capacities can be studied not only in permeabilized cells or fibers but also in isolated mitochondria. In the present study, we describe a protocol to isolate intact skeletal muscle mitochondria using differential centrifugation for high-resolution respirometry measurements.
To isolate intact mitochondria for respirometry, the tissue is homogenized and mitochondria are isolated by a conventional differential centrifugation method. The differential centrifugation method is based on sequential centrifugations (in a series of increasing speed) of tissue homogenates was first introduced by Pallade and co-workers almost 70 years ago 1. The tissue is first minced using scissors and homogenized mechanically in a glass homogenizer with a loose-fitting pestle. Afterwards the homogenate is centrifuged at low speed and the resulting pellet that contains unbroken tissue, cellular debris and nuclei is discarded. Then, the supernatant is centrifuged several times at high speed and the mitochondrial enriched fraction is collected. The advantages of the differential centrifugation method to isolate mitochondria are that: i) the method is fast and mitochondria can be isolated within 1-1.5 h (respiratory experiments should be performed as quick as possible); ii) it is inexpensive; and iii) it is very efficient and the mitochondria obtained by differential centrifugation are pure enough for respirometry assays. The disadvantages of differential centrifugation method to isolate mitochondria are that i) mitochondria might get damaged and uncoupled during homogenization; ii) the contamination of mitochondria with other cellular components (could be solved by further washing the mitochondrial pellet with additional centrifugation steps); iii) the possibility of selecting different mitochondrial subpopulations, e.g., during differential centrifugations steps, mitochondria with lower dense can be excluded 7; and iv) the mitochondrial cellular surrounding is missing and only the theoretical maximal respiration can be measured. Another method to isolate mitochondria for respirometry assays is the density gradient centrifugation 2. In this technique, the tissue extract is layered over a solution of sucrose or a Percoll gradient (with higher density at the bottom of the centrifugation tube) and centrifuged at a certain speed, causing the mitochondria to be isolated from other cellular components according to their densities. This method is often used to isolate brain mitochondria with very low contamination from synaptosomes. However, the rat liver mitochondria isolated by density gradient centrifugation are highly contaminated with other cellular organelles 3. One of the limitations of this method is that the sucrose gradient present in the centrifugation tube might rupture some mitochondria (osmotic shock).
Depending on the type of tissue; there are some important factors to consider for the isolation of intact mitochondria by differential centrifugation. The first necessity is to homogenize tissues in a gentle manner. Soft tissues such as kidney, brain and liver require gentle mechanical forces applied during homogenization. This contrasts with hard tissues such as cardiac and skeletal muscle that require much stronger mechanical forces. The minced tissue is usually treated with proteinase prior to the homogenization to soften the tissue. All buffers used during homogenization and centrifugation should be ice cold and have a physiological relevant pH with an ionic and osmotic strength compatible with cytosol 4,5.
One of the advantages of studying isolated mitochondrial bioenergetics is that cellular plasma membranes do not need to be permeabilized with detergents such as digitonin or saponin 4,6, which might compromise the mitochondrial outer membrane integrity. Another advantage of the isolated mitochondria is the absence of other cytosolic factors, which may interfere with the analysis of the mitochondrial functions such as oxygen consumption. The disadvantages of using the isolated mitochondria are the possible selection of certain mitochondrial populations during the centrifugation steps, damage to the mitochondria during homogenization, and the requirement for high quantities of biological samples in order to obtain a good yield of isolated mitochondria 7,8.
After the isolation procedure, the respiratory rates of mitochondrial complexes I-, II- and IV-dependent (states 2, 3 and 4) are determined using high-resolution respirometry. For complex I-driven respiration, glutamate and malate are added followed by adenosine diphosphate (ADP). For complex II-driven respiration, succinate is added followed by ADP. For complex IV-driven respiration, ascorbate and tetramethylphenylendiamine (TMPD) are added followed by ADP 9,10,11,12. State 2 refers to oxygen consumption in the presence of substrates alone. State 3 refers to oxygen consumption in the presence of substrates and ADP. State 4 refers to oxygen consumption after ADP depletion. The respiratory control ratio (RCR) is an index of coupling of oxygen consumption ATP production and is calculated as the ratio between state 3 and state 4 13,15.
In summary, we describe a protocol to isolate functional and intact skeletal muscle mitochondria by differential centrifugation and use these isolated mitochondria for functional and bioenergetic studies such as high-resolution respirometry.
Protocol
The quadriceps muscle biopsy is taken from an anaesthetized pig, from which mitochondria are isolated by differential centrifugation. The pig is used afterwards for another experiment. The study is performed in accordance with the National Institutes of Health guidelines for the care and use of experimental animals and with the approval of the Animal Care Committee of the Canton Bern, Switzerland.
1. Skeletal Muscle Homogenization and Mitochondrial Isolation
- Excise 5-10 g quadriceps muscle specimen from an anaesthetized pig. In the present assay, use porcine skeletal muscle. This protocol can also be used to isolate mitochondria from other species (e.g., rat, mice, human, etc.). NOTE: This step is performed by a medical specialist with expertise in surgery.
- Sedate pigs with intramuscular ketamine (20 mg/kg) and xylazine (2 mg/kg), before anesthesia is induced with intravenous midazolam (0.5 mg/kg, plus atropine 0.02 mg/kg). Maintain anesthesia with continuous intravenous infusions of propofol (4-8 mg/kg per h) and fentanyl (30 µg/kg per h) during surgery.
Immediately immerse the tissue sample in a beaker containing 20 mL of ice-cold mitochondrial isolation buffer (Table 1). NOTE: Buffers used during homogenization and centrifugations should be ice cold and have a physiological relevant pH with an ionic and osmotic strength compatible with cytosol.
Weigh the tissue sample in the beaker on an analytical tared balance. Tare the balance with the beaker containing 20 mL of isolation buffer.
Place the beaker on an ice bucket. NOTE: Perform all of the next steps for the homogenization procedure at the ice bucket temperature and keep all buffers on the ice bucket.
Mince the skeletal muscle in the beaker (keep on ice) into 1-2 mm small pieces for 3-4 min using fine scissors.
Rinse the minced tissue in the beaker twice with ice cold isolation buffer (20 mL each washing step).
Suspend the tissue in 10 volumes of the isolation buffer per tissue weight (g) containing 5 mg protease/g tissue.
Place the beaker in an ice bath on the magnetic stirrer and stir for 10 min.
Dilute the suspension in the beaker with additional 10 volumes of the isolation buffer per tissue weight (g) supplemented with 0.2% (weight/volume) defatted bovine serum albumin (BSA).
Decant all of the isolation buffer supplemented with 0.2% BSA and rinse the tissue in the beaker twice with ice cold isolation buffer supplemented with 0.2% BSA (20 mL each washing step).
Resuspend the tissue in 10 volumes of isolation buffer per tissue weight (g) supplemented with 0.2% with defatted BSA.
Homogenize the tissue with a semi-automatic glass homogenizer (kept on ice) with a loose-fitting pestle (10 strokes). NOTE: Homogenize the tissue always in the same manner (the same number of strokes, e.g., 10 strokes). A higher number of strokes may damage and uncouple the mitochondria. Preferably, homogenize the tissue using an automated homogenizer. Manually (and subjectively) homogenized tissue samples in glass homogenizers may produce different qualities of isolated mitochondria.
Centrifuge the homogenized tissue at 4 °C for 10 min at 10,000 x g. NOTE: All centrifugation steps are performed in centrifuges with fixed angle rotors.
Discard the supernatant using a serological pipet and resuspend the pellet in BSA-supplemented ice-cold isolation medium (10 mL/g tissue).
Centrifuge the suspension at 4 °C for 10 min at 350 x g.
Reserve the supernatant using a serological pipet and discard the pellet (cellular debris).
Filter the supernatant into a beaker (kept on ice) through two layers of gauze (17 threads/cm2) to remove cell debris.
Centrifuge the filtered suspension at 4 °C for 10 min at 7,000 x g.
Discard the supernatant and resuspend the crude mitochondrial pellet in the isolation buffer (5 mL/g tissue) supplemented with 0.2% (weight/volume) BSA and centrifuge the suspension at 4 °C for 10 min at 7,000 x g.
Discard the supernatant and resuspend the crude mitochondrial pellet in wash buffer (Table 1). Centrifuge the suspension again at 4 °C for 10 min at 7,000 x g.
Discard the supernatant and resuspend the crude mitochondrial pellet in wash buffer and centrifuge the suspension again at 4 °C for 10 min at 7,000 x g.
Discard the supernatant and resuspend the crude mitochondrial pellet in 1.0 mL of wash buffer.
Determine the protein concentration of the mitochondrial suspension and keep the concentrated mitochondrial suspension on ice. NOTE: Protein concentration can be measured using any standard method.
Just prior to respirometry assays, resuspend the mitochondrial suspension in the respiration buffer to a final concentration of 0.4 mg/mL mitochondrial protein.
2. High-resolution Respirometry
Pipette 2.1 mL of respiration buffer (Table 1) 16 into a high-resolution oxygraph chamber and stir the buffer continuously using a magnetic stirring bar present in the chamber (700 rpm) at 37 °C for 1 h until a stable oxygen flux signal of the polarographic oxygen sensor is obtained. NOTE: Polarographic oxygen electrodes within each oxygraph chamber measure the oxygen concentration and calculate oxygen consumption (flux) within each chamber. The oxygen concentration and oxygen consumption rates (flux) are displayed real-time online in a computer using software for data acquisition and analysis. In addition, in order to ensure accurate and reliable results, instrumental oxygen background correction should be performed according to the manufacturer's instructions. NOTE: Accurately 2.1 mL of respiration buffer is added into the chamber for calibration of a final chamber volume of 2.0 mL after closing the stoppers.
Perform an air calibration of the polarographic oxygen sensor according to the manufacturer's protocols 17. NOTE: During air calibration, with a gas phase present, the media oxygen concentration will equilibrate on the order of 15-20 min. Depending on the temperature, barometric pressure, and solubility of media -oxygen concentration can be calculated.
After air calibration, aspirate the respiration medium from the oxygraph chamber and add 2.1 mL of isolated mitochondrial suspension (0.4 mg/mL mitochondrial protein) from step 1.24 to a chamber of the oxygraph. NOTE: The volume of respiration buffer depends on the instrument set up and manufacturer. For high resolution respirometry, the 2.1 mL of respiration buffer is added into the chamber for calibration of a final chamber volume of 2.0 mL after closing the stoppers.
Close the oxygraph chamber by insertion of the stopper.
Stir the mitochondrial suspension continuously using a magnetic stirring bar present in the chamber (700 rpm) at 37 °C and record cellular respiration at baseline for 3-5 min until a stable oxygen flux signal is achieved. NOTE: The oxygen concentration and oxygen flux signal are displayed real-time online in a computer using software for data acquisition and analysis 17.
Afterwards, inject substrates and inhibitors for mitochondrial respiration through the titanium injection ports of the stoppers using the following standard protocols.
3. Complex I-dependent Respiration
Prepare an oxygraph chamber containing the isolated mitochondrial suspension (0.4 mg/mL) following the procedure described in steps 2.1-2.5 and wait for a stable signal.
Inject 12.5 µL of 0.8 M malate (5 mM final concentration) and 10 µL of 2 M glutamate (10 mM final concentration) into the oxygraph chamber containing isolated mitochondrial suspension (0.4 mg/mL) through the titanium injection port of the chamber stopper and record cellular respiration for 3-5 min until a stable oxygen flux signal is achieved. NOTE: All the injections in the following steps are performed through the titanium injection ports of stoppers using syringes.
Inject 10 µL of 0.05 M ADP (0.25 mM) into the oxygraph chamber through the titanium injection port of the chamber stopper and record mitochondrial respiration until the oxygen flux signal increases, then decreases and stabilizes (3-5 min). NOTE: The plateau of respiration after ADP addition indicates that ADP concentration was high and saturating. Depending on the amount of mitochondria used during respiration, ADP concentration should be titrated for a stable state 3 oxygen consumption (maximal respiration). Addition of ADP to the mitochondrial suspension will induce an increase in oxygen consumption and the oxygen flux signal will increase (state 3 respiration). After the ADP is consumed, the oxygen flux signal will decrease (state 4 respiration).
4. Complex II-dependent Respiration
Prepare an oxygraph chamber containing isolated mitochondrial suspension (0.4 mg/mL) following the procedure described in steps 2.1-2.5 and wait for a stable signal.
Inject 2 µL of 0.2 mM rotenone (0.2 µM) 'CAUTION' into the oxygraph chamber through the titanium injection port of the chamber stopper using a syringe and record the cellular respiration for 3-5 min until a stable oxygen flux signal is achieved. NOTE: Rotenone is a dangerous poison and may have a significant impact on human health.
Inject 20 µL of 1 M succinate (10 mM) into the oxygraph chamber and record mitochondrial respiration for 3-5 min until a stable oxygen flux signal is achieved.
Inject 10 µL of 0.05 M ADP (0.25 mM) into the oxygraph chamber through the titanium injection port of the chamber stopper and record cellular respiration until the oxygen flux signal increases, stabilizes, then decreases and stabilizes (3-5 min). NOTE: Addition of ADP to the mitochondrial suspension will induce an increase in oxygen consumption and the oxygen flux signal will increase (state 3 respiration). After the ADP is consumed, the oxygen flux signal will decrease (state 4 respiration).
5. Complex IV-dependent Respiration
Prepare an oxygraph chamber containing isolated mitochondrial suspension (0.4 mg/mL) following the procedure described in steps 2.1 to 2.5 of the protocol and wait for a stable signal.
Then inject 2.5 µL of 0.8 mM ascorbate (1 mM). Immediately thereafter inject 2.5 µL of 0.2 M TMPD (0.25 mM) and 10 µL of 0.05 M ADP (0.25 mM) into the oxygraph chamber and record cellular respiration until the oxygen flux signal increases and stabilizes (3-5 min).
Finally inject 10 µL of 1 M sodium azide (5 mM) 'CAUTION' into the oxygraph chamber and record cellular respiration until the oxygen flux signal decreases and stabilizes. NOTE: Sodium azide is a dangerous poison and may have a significant impact on human health.
6. Cytochrome C Test
Prepare an oxygraph chamber containing isolated mitochondrial suspension (0.4 mg/mL) following the procedure described in steps 2.1 to 2.5 of the protocol and wait for a stable signal.
Inject 12.5 µL of 0.8 M malate (5 mM final concentration) and 10 µL of 2 M glutamate (10 mM final concentration) into the oxygraph chamber containing isolated mitochondrial suspension (0.4 mg/mL) through the titanium injection port of the chamber stopper and record cellular respiration for 3-5 min until a stable oxygen flux signal is achieved.
Inject 10 µL of 0.5 M ADP (2.5 mM) into the oxygraph chamber through the titanium injection port of the chamber stopper and record mitochondrial respiration until the oxygen flux signal increases, then decreases and stabilizes (3-5 min).
Finally, inject 5 µL of 4 mM cytochrome c (10 µM) into the oxygraph chamber and record cellular respiration for 5 min until a stable oxygen flux signal is achieved.
Representative Results
Complex I-dependent respiration
Isolated mitochondrial complex I-dependent respiratory rates (states 2, 3 and 4) are determined using high-resolution respirometry (Figure 1, a representative diagram). Mitochondrial complex I substrates, glutamate and malate, are added followed by the addition of ADP. State 2 refers to oxygen consumption in the presence of the substrates alone. State 3 refers to oxygen consumption in the presence of the substrates and ADP. State 4 refers to oxygen consumption after ADP depletion. RCR is an index of the coupling of oxygen consumption to ATP production and is calculated as the ratio between state 3 and state 4. As shown in Figure 1, upon addition of ADP, the mitochondrial respiration rate increases immediately (state 3 respiration), and then decreases (state 4 respiration) to levels very similar to that of state 2. This indicates a high RCR and that mitochondrial integrity is well preserved during isolation procedure. Figure 2 is a representative diagram of measurement of a low state 3 respiration rate and RCR, with a high state 4 respiration rate, indicating inappropriate and unsuccessful mitochondrial isolation. A high respiration rate at state 4 is an indicator of mitochondrial proton leakiness 15.
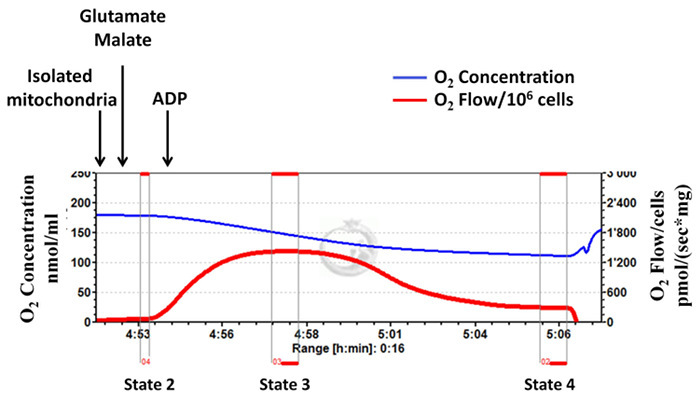 Figure 1:Successful mitochondrial isolation: mitochondrial integrity is well preserved during the isolation procedure. Tracings from the high-resolution respirometry using glutamate and malate as substrates (complex I-dependent respiration). The blue line represents oxygen concentration. The red line represents the oxygen flow (slope of oxygen concentration). The oxygen concentration decreases over time as isolated mitochondria use the available oxygen. Oxygen consumption is expressed as pmol/(s x mg mitochondrial protein). Please click here to view a larger version of this figure.
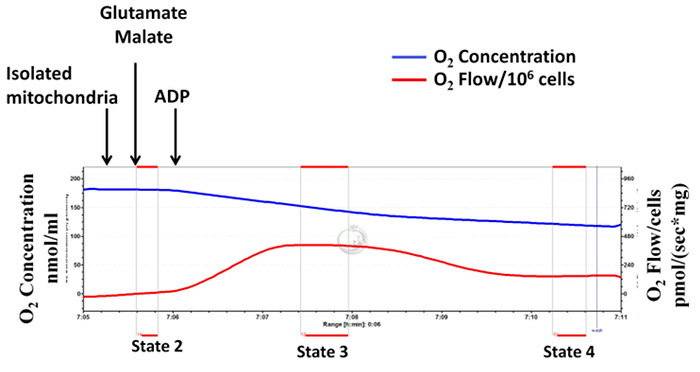 Figure 2: Unsuccessful mitochondrial isolation: mitochondrial integrity is not well preserved during the isolation procedure indicating inappropriate mitochondrial isolation. Tracings from the high-resolution respirometry using glutamate and malate as substrates (complex I-dependent respiration). The blue line represents oxygen concentration. The red line represents the oxygen flow (slope of oxygen concentration). The oxygen concentration decreases over time as isolated mitochondria use the available oxygen. Oxygen consumption is expressed as pmol/(s x mg mitochondrial protein). Please click here to view a larger version of this figure.
Complex II-dependent respiration
Isolated mitochondrial complex II-dependent respiratory rates (states 2, 3 and 4) are determined using high-resolution respirometry (Figure 3, a representative diagram). For this assay, the mitochondrial complex I is inhibited by the addition of rotenone, and then succinate (complex II substrate) is added followed by ADP. Figure 3 shows that upon addition of ADP, the mitochondrial respiration increases immediately, and then decreases to levels very similar to that of state 2, indicating well-coupled mitochondria and that mitochondrial integrity is well preserved during the isolation procedure. The calculated RCR value for this typical experiment is 4.23, which is in close agreement with the values shown in the available literature10,11,23). Figure 4 is a representative diagram of measurement of a low state 3 respiration rate and RCR, with a high state 4 respiration rate indicating inappropriate isolation.
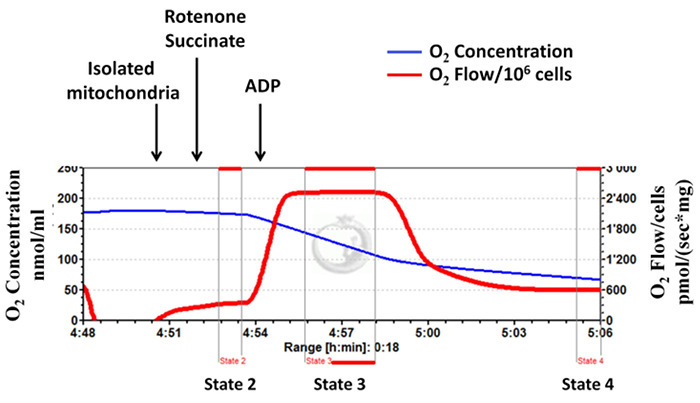 Figure 3: Successful mitochondrial isolation: mitochondrial integrity is well preserved during the isolation procedure. Tracings from the high-resolution respirometry using succinate as substrate (complex II-dependent respiration). The blue line represents oxygen concentration. The red line represents the oxygen flow (slope of oxygen concentration). The oxygen concentration decreases over time as isolated mitochondria use the available oxygen. Oxygen consumption is expressed as pmol/(s x mg mitochondrial protein). Please click here to view a larger version of this figure.
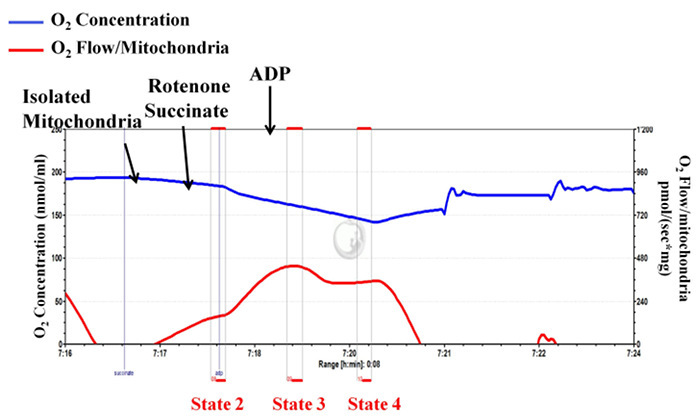 Figure 4: Unsuccessful mitochondrial isolation: mitochondrial integrity is not well preserved during the isolation procedure indicating inappropriate isolation. Tracings from the high-resolution respirometry using succinate as substrate (complex II-dependent respiration). The blue line represents oxygen concentration. The red line represents the oxygen flow (slope of oxygen concentration). The oxygen concentration decreases over time as isolated mitochondria use the available oxygen. Oxygen consumption is expressed as pmol/(s x mg mitochondrial protein). Please click here to view a larger version of this figure.
Complex IV-dependent respiration
Isolated mitochondrial complex IV-dependent respiratory rates (states 2, 3) are determined using high-resolution respirometry (Figure 5, a representative diagram). For this assay ascorbate/TMPD and ADP are added, followed by sodium azide to inhibit complex IV.
The difference between oxygen consumption before and after addition of sodium azide is interpreted as the real complex IV respiration. Figure 5 is a representative diagram of measurement of a high complex IV-dependent state 3 respiration rate indicating that mitochondrial integrity is well preserved during isolation procedure. In contrast, Figure 6 is a representative diagram of measurement of a low state 3 indicating inappropriate isolation.
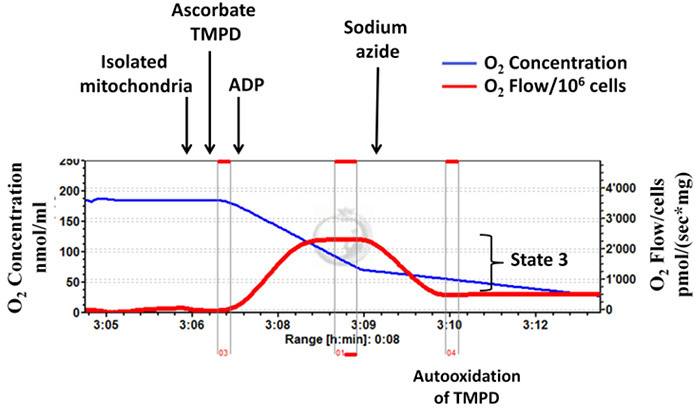 Figure 5: Successful mitochondrial isolation:mitochondrial integrity is well preserved during the isolation procedure. Tracings from the high-resolution respirometry using ascorbate/TMPD as substrate (complex IV-dependent respiration). Complex IV respiration (state 3) is interpreted by subtracting the oxygen consumption before and after addition of sodium azide. The blue line represents oxygen concentration. The red line represents the oxygen flow (slope of oxygen concentration). The oxygen concentration decreases over time as isolated mitochondria use the available oxygen. Oxygen consumption is expressed as pmol/(s x mg mitochondrial protein). Please click here to view a larger version of this figure.
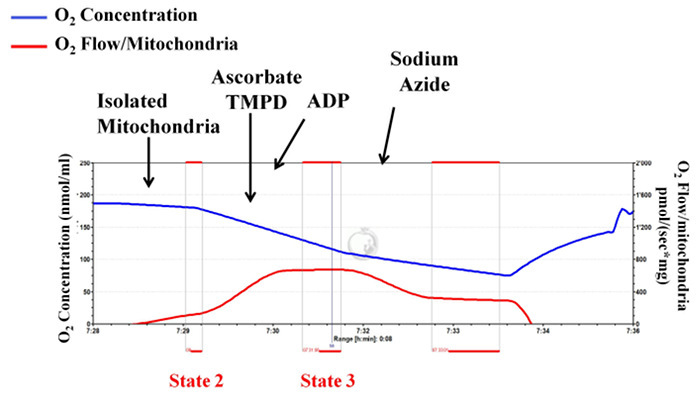 Figure 6: Unsuccessful mitochondrial isolation: mitochondrial integrity is not well preserved during the isolation procedure indicating inappropriate isolation. Tracings from the high-resolution respirometry using ascorbate/TMPD as substrate (complex IV-dependent respiration). Complex IV respiration (state 3) is interpreted by subtracting the oxygen consumption before and after addition of sodium azide. The blue line represents oxygen concentration. The red line represents the oxygen flow (slope of oxygen concentration). The oxygen concentration decreases over time as isolated mitochondria use the available oxygen. Oxygen consumption is expressed as pmol/(s x mg mitochondrial protein). Please click here to view a larger version of this figure.
Evaluation of the mitochondrial outer membrane integrity using cytochrome c
To evaluate the quality of mitochondrial preparation, cytochrome c test is performed to determine mitochondrial outer membrane integrity, by measurement of mitochondrial respiration after the subsequent addition of glutamate and malate, ADP and cytochrome c (ADP stimulated complex II-dependent state 3 respiration in the presence of cytochrome c). As shown in Figure 7, cytochrome c does not enhance complex I-dependent state 3 respiration of the isolated mitochondria, indicating that there was no loss of cytochrome c from the mitochondrial outer membrane and mitochondrial integrity is preserved.
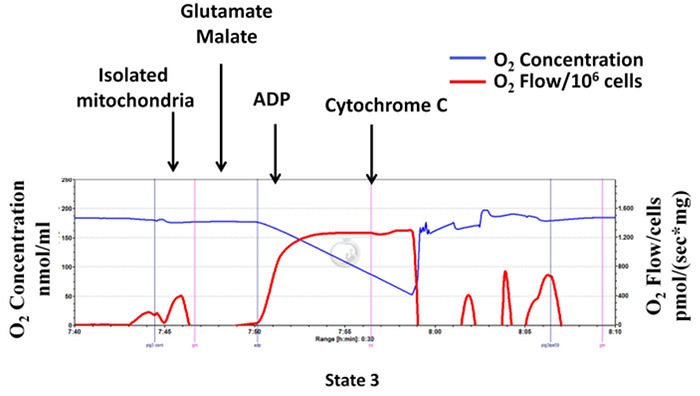 Figure 7:Cytochrome c does not enhance respiration of the isolated mitochondrial:mitochondrial integrity is well preserved during the isolation procedure. Tracings from the high-resolution respirometry using glutamate/malate as substrate (complex I-dependent respiration). The blue line represents oxygen concentration. The red line represents the oxygen flow (slope of oxygen concentration). The oxygen concentration decreases over time as isolated mitochondria use the available oxygen. Oxygen consumption is expressed as pmol/(s x mg mitochondrial protein). Please click here to view a larger version of this figure.
| Mitochondrial isolation buffer | |
| Chemical | Concentration |
| KCl | 100 mM |
| MgSO4 | 10 mM |
| morpholinopropane sulphonic acid (MOPS) | 50 mM |
| ethylenedinitrilotetraacetic acid (EGTA) | 1.0 mM |
| ATP | 1.1 mM |
| pH 7.4 | |
| Mitochondrial washing buffer | |
| Chemical | Concentration |
| KCl | 100 mM |
| MOPS | 50 mM |
| EGTA | 0.5 mM |
| pH 7.4 | |
| Mitochondrial respiration buffer 16 | |
| Chemical | Concentration |
| Sucrose | 110 mM |
| EGTA | 0.5 mM |
| MgCl2 | 3.0 mM |
| KCl | 80 mM |
| K-lactobionate | 60 mM |
| KH2PO4 | 10 mM |
| Taurine | 20 mM |
| Hepes | 20 mM |
| BSA | 1.0 g/L |
| pH 7.1 |
Table 1: The composition of buffers.
Discussion
In the present study we describe a protocol to isolate high-quality, intact and tightly coupled skeletal muscle mitochondria by differential centrifugation which can be used for functional studies such as high-resolution respirometry.
In order to isolate intact and tightly coupled mitochondria, there are some critical points to be considered within the present protocol. After harvesting the skeletal tissue, it should be immediately immersed in ice-cold mitochondrial isolation buffer. All centrifugation steps should be done at 4 °C and mitochondrial suspension should be kept always on ice during isolation. The isolation procedure should be done as quickly as possible. The homogenate should be centrifuged in clean detergent-free centrifuge tubes. At the end of the procedure, the mitochondrial suspension should be kept concentrated and be diluted just prior to respirometry. Since respirometry data are expressed as pmol per second per milligram of mitochondrial protein, it is important to use a good technique to accurately measure the mitochondrial protein concentration after the isolation.
In some mitochondrial isolation procedures, it may happen that the mitochondria are uncoupled or do not consume oxygen properly using high-resolution respirometry. To overcome these problems, the tissue should always be homogenized in the same manner (the same number of strokes) using the homogenizer with the loose-fitting pestle (step 1.12). Here, we always homogenize the skeletal muscle tissue using an automated homogenizer with 10 strokes. A higher number of strokes may damage and uncouple the mitochondria. Manually (and subjectively) homogenized tissue samples in glass homogenizers may produce different qualities of isolated mitochondria. Freezing of the mitochondria also may result in uncoupled mitochondria and one should make sure that centrifugations are done at 4 °C and not below this temperature. The mitochondrial integrity may be compromised as well if the pH of the buffer solutions is incorrect or the centrifugation tubes are not clean. One should make sure that the centrifugation tubes are detergent-free and properly washed.
One of the first important factors to be considered during isolation is to homogenize tissues in a gentle manner. Soft tissues require gentle mechanical forces applied during homogenization, whereas hard tissues require much stronger mechanical forces. Buffers used during homogenization and centrifugations should be ice cold and have a physiological relevant pH with an ionic and osmotic strength compatible with cytosol. For hard tissues such as skeletal muscle, after mechanical homogenization, proteases such as trypsin can be added to further disaggregate the tissue 4,5.
Some of the limitations of isolated mitochondria, based on differential centrifugation are i) the possibly damaged mitochondria during the homogenization and isolation procedure 19, ii) the large amounts of the tissue specimens required for the mitochondrial isolation, iii) the possible loss and alterations in certain mitochondrial electron transport chain complexes subunits during homogenization and centrifugation steps 18, and iv) the increased production of the reactive oxygen species during homogenization and centrifugation steps, which may interfere with mitochondrial function 18. The advantages of the dounce homogenization and the differential centrifugation method to isolate crude mitochondria for respiratory experiments with respect to existing methods such as density gradient centrifugation 20 are that the method is quick and mitochondria are isolated within a short period of time. Therefore respiratory experiments can be performed within 1 h. In addition, the procedure is inexpensive, very efficient and the mitochondria obtained by differential centrifugation can be used for respirometry assays. The investigation of the mitochondrial oxygen consumption using isolated mitochondria offers several advantages over permeabilized fibers or cells: no significant interference with cytosolic proteins that may interfere with mitochondrial function and bioenergetics; no need for cellular permeabilization; and substrates of the mitochondrial respiratory chain complexes can be added directly to the isolated mitochondria.
One of the alternative methods to measure skeletal muscle mitochondrial respiration is the use permeabilized muscle fibers 9. Some of the advantages of the permeabilized muscle fibers over isolated mitochondria are i) no mechanical homogenization step is needed and, ii) very small amounts of tissue (few mg) are required for respirometry assays. The disadvantage of permeabilized muscle fiber is the lower oxygen diffusion to the mitochondria in the fiber bundle. This diffusion restriction requires larger amounts of ADP during respirometry assays. Another alternative method is the use of whole tissue homogenates 22, which is a very quick method and does not require differential centrifugation steps to isolate mitochondria. Use of whole tissue homogenate may prevent the loss of some mitochondria during their isolation, but there may be other cytosolic factors present, which may interfere with the analysis of the mitochondrial functions such as oxygen consumption.
After mastering the differential centrifugation to isolate crude mitochondria for respiratory assays, a future application is to investigate the respiratory capacities of mitochondria isolated via emerging techniques such as using mitochondrial outer membrane anti-TOM22 (translocase of outer mitochondrial membrane 22 homolog) antibody-coupled magnetic beads 21.
Disclosures
The authors have nothing to disclose.
Acknowledgments
This study was supported by the Swiss National Science Foundation (Grant 32003B_127619).
References
- Hogeboom GH, Schneider WC, Pallade GE. Cytochemical studies of mammalian tissues. I. Isolation of intact mitochondria from rat liver; some biochemical properties of mitochondria and submicroscopic particulate material. J. Biol. Chem. 1948;172:619–635. [PubMed] [Google Scholar]
- Sims NR. Rapid isolation of metabolically active mitochondria from rat brain and subregions using Percoll density gradient centrifugation. J. Neurochem. 1990;55(2):698–707. doi: 10.1111/j.1471-4159.1990.tb04189.x. [DOI] [PubMed] [Google Scholar]
- Hartwig S, et al. A critical comparison between two classical and a kit-based method for mitochondria isolation. Proteomics. 2009;9(11):3209–3214. doi: 10.1002/pmic.200800344. [DOI] [PubMed] [Google Scholar]
- Pallotti F, Lenaz G. Isolation and subfractionation of mitochondria from animal cells and tissue culture lines. Methods Cell Biol. 2001;65:1–35. doi: 10.1016/s0091-679x(01)65002-7. [DOI] [PubMed] [Google Scholar]
- Pallotti F, Lenaz G. Isolation and subfractionation of mitochondria from animal cells and tissue culture lines. Methods Cell Biol. 2007;80:3–44. doi: 10.1016/S0091-679X(06)80001-4. [DOI] [PubMed] [Google Scholar]
- Niklas J, Melnyk A, Yuan Y, Heinzle E. Selective permeabilization for the high-throughput measurement of compartmented enzyme activities in mammalian cells. Anal. Biochem. 2011;416(2):218–227. doi: 10.1016/j.ab.2011.05.039. [DOI] [PubMed] [Google Scholar]
- Kuznetsov AV, et al. Analysis of mitochondrial function in situ in permeabilized muscle fibers, tissues and cells. Nat. Protoc. 2008;3(6):965–976. doi: 10.1038/nprot.2008.61. [DOI] [PubMed] [Google Scholar]
- Perry CG, Kane DA, Lanza IR, Neufer PD. Methods for assessing mitochondrial function in diabetes. Diabetes. 2013;62(4):1041–1053. doi: 10.2337/db12-1219. [DOI] [PMC free article] [PubMed] [Google Scholar]
- Gnaiger E. Capacity of oxidative phosphorylation in human skeletal muscle: new perspectives of mitochondrial physiology. Int. J. Biochem. Cell Biol. 2009;41(10):1837–1845. doi: 10.1016/j.biocel.2009.03.013. [DOI] [PubMed] [Google Scholar]
- Vuda M, et al. Effects of catecholamines on hepatic and skeletal muscle mitochondrial respiration after prolonged exposure to faecal peritonitis in pigs. Innate Immun. 2012;18(2):217–230. doi: 10.1177/1753425911398279. [DOI] [PubMed] [Google Scholar]
- Corrêa TD, et al. Angiotensin II in septic shock: effects on tissue perfusion, organ function, and mitochondrial respiration in a porcine model of fecal peritonitis. Crit. Care Med. 2014;42(8):e550–e559. doi: 10.1097/CCM.0000000000000397. [DOI] [PubMed] [Google Scholar]
- Jeger V, et al. Dose response of endotoxin on hepatocyte and muscle mitochondrial respiration in vitro. Biomed Res Int. 2015;2015:353074. doi: 10.1155/2015/353074. [DOI] [PMC free article] [PubMed] [Google Scholar]
- Nicholls DG, Ferguson SJ. Bioenergetics. Vol. 3. San Diego: Academic Press; 2002. [Google Scholar]
- Chance B, Williams GR. The respiratory chain and oxidative phosphorylation. Adv. Enzymol. Relat. Subj. Biochem. 1956;17:65–134. doi: 10.1002/9780470122624.ch2. [DOI] [PubMed] [Google Scholar]
- Brand MD, Nicholls DG. Assessing mitochondrial dysfunction in cells. Biochem. J. 2011;435(2):297–312. doi: 10.1042/BJ20110162. [DOI] [PMC free article] [PubMed] [Google Scholar]
- Gnaiger E, Méndez G, Hand SC. High phosphorylation efficiency and depression of uncoupled respiration in mitochondria under hypoxia. Proc. Natl. Acad. Sci. USA. 2000;97(20):11080–11085. doi: 10.1073/pnas.97.20.11080. [DOI] [PMC free article] [PubMed] [Google Scholar]
- Pesta D, Gnaiger E. High-resolution respirometry: OXPHOS protocols for human cells and permeabilized fibers from small biopsies of human muscle. Methods Mol. Biol. 2012;810:25–58. doi: 10.1007/978-1-61779-382-0_3. [DOI] [PubMed] [Google Scholar]
- Picard M, et al. Mitochondrial structure and function are disrupted by standard isolation methods. PLoS One. 2011;6(3):e18317. doi: 10.1371/journal.pone.0018317. [DOI] [PMC free article] [PubMed] [Google Scholar]
- Picard M, et al. Mitochondrial functional impairment with aging is exaggerated in isolated mitochondria compared to permeabilized myofibers. Aging Cell. 2010;9(6):1032–1046. doi: 10.1111/j.1474-9726.2010.00628.x. [DOI] [PubMed] [Google Scholar]
- Graham JM. Purification of a crude mitochondrial fraction by density-gradient centrifugation. Curr. Protoc. Cell. Biol. Chapter 3. 2001;3 doi: 10.1002/0471143030.cb0304s04. [DOI] [PubMed] [Google Scholar]
- Franko A, et al. Efficient isolation of pure and functional mitochondria from mouse tissues using automated tissue disruption and enrichment with anti-TOM22 magnetic beads. PLoS One. 2013;8(12):382392. doi: 10.1371/journal.pone.0082392. [DOI] [PMC free article] [PubMed] [Google Scholar]
- Pecinová A, Drahota Z, Nůsková H, Pecina P, Houštěk J. Evaluation of basic mitochondrial functions using rat tissue homogenates. Mitochondrion. 2011;11(5):722–728. doi: 10.1016/j.mito.2011.05.006. [DOI] [PubMed] [Google Scholar]
- Lombardi A, et al. Characterisation of oxidative phosphorylation in skeletal muscle mitochondria subpopulations in pig: a study using top-down elasticity analysis. FEBS Lett. 2000;475(2):84–88. doi: 10.1016/s0014-5793(00)01633-1. [DOI] [PubMed] [Google Scholar]


