Abstract
A simple and selective assay for detecting methylglyoxal (MGO), a metabolite associated with diabetes, was developed by combining a bio-inspired chemical reaction with the anti-aggregation of gold nanoparticles. This assay could detect MGO at as low as 1 μM by the naked eye and 0.05 μM by UV-vis spectrometry, within the clinical range marking oxidative stress in diabetes, and demonstrated high selectivity over other physiologically relevant ketones and aldehydes.
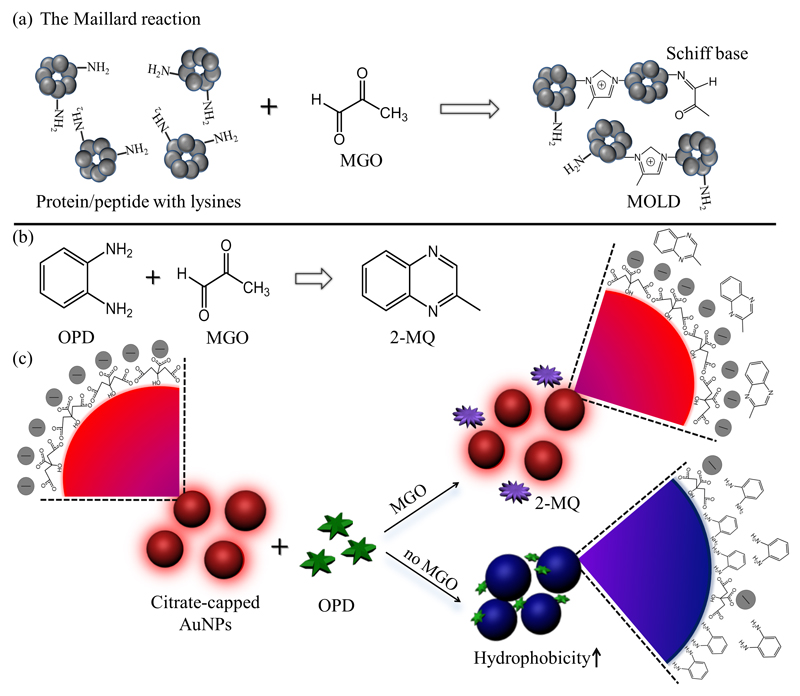
Chronic hyperglycemia has been implicated in several diabetes-specific microvascular and macrovascular pathologies. One of the major pathways through which this occurs is the formation of advanced glycation end products (AGEs), which accumulate on long-lived proteins and cause tissue damage.1 Glucose-derived dicarbonyls, including methylglyoxal (MGO), glyoxal, and 3-deoxyglucosone have been shown to generate AGEs at orders of magnitude higher than glucose owing to their high reactivity towards amino acids (dominantly cysteine, lysine and arginine).2 As such, reactive dicarbonyls are considered important markers for monitoring diabetes complications. Among these, MGO has been found to be particularly reactive towards lysine through the formation of reversible Schiff base structures or stable imidazolium products (Scheme 1a) known as MGO-lysine dimers (MOLD).3 MGO is generated during the metabolism of glucose by the fragmentation of glyceraldehyde-3-phosphate and dihydroxyacetone phosphate. Its level increases in the urine and plasma of diabetic individuals with clinical relevance.4 MGO also exists in beverages and fermented food.5 Development of reliable, sensitive and selective methods for determining MGO concentration are therefore important to not only monitor diabetes-associated pathologies but also investigate its reactivity and hypothetical toxicity during food processing, cooking and prolonged storage.
Scheme 1.
(a) The Maillard reaction between methylglyoxal (MGO) and protein lysine residues generates Schiff bases and MGO-lysine dimers (MOLD). (b) The reaction of o-phenylenediamine (OPD) and MGO to form 2-methylquinoxaline (2-MQ). (c) Schematic view of the anti-aggregation mechanism applied for MGO detection. In the absence of MGO, OPD triggers the aggregation of citrate-capped AuNPs via bidentate binding to gold. The presence of MGO consumes OPD in solution which ultimately inhibits AuNP aggregation.
Traditional methods for MGO detection usually rely on high performance liquid chromatography (HPLC),6 liquid chromatography-mass spectrometry (LC-MS),7 and gas chromatography (GC).8 These methods require tedious sample preparation, time-consuming testing cycles, expensive equipment, and highly-trained personnel. There is therefore a clear need for simple, quick, and low-cost assays to sensitively and selectively detect MGO at clinically relevant levels. Great progress in the development of nanotechnology has offered new opportunities for diagnostics and sensing.9 In particular, gold nanoparticles (AuNPs) possess unique physical and chemical properties through the variation of shape, size and chemical environment.10 The interparticle surface plasmonic coupling induced by AuNP aggregation results in a colour change from red to blue, providing a simple and practical platform for the colorimetric sensing of various target analytes such as small molecules, enzymes, and oligonucleotides.9, 11 While colorimetric assays have been developed for the detection of glucose in diabetic patients, to date no such assay has been developed for the detection of reactive dicarbonyls.
Here we present a novel colorimetric assay for MGO detection based on controllable AuNP aggregation modulated by an MGO dependant chemical reaction (Scheme 1). In a similar manner to the Maillard reaction (Scheme 1a) in biological systems, MGO reacts quickly with o-phenylenediamine (OPD) and leads to the cyclic product 2-methylquinoxaline (2-MQ) in high yield (Scheme 1b). As shown in Scheme 1c, the bidentate binding of OPD to Au surfaces effectively triggers AuNP aggregation and causes a peak shift in the UV-visible spectrum which changes the solution colour from red to blue. The presence of MGO consumes OPD through chemical conjugation, reducing the concentration of OPD in solution and inhibiting AuNP aggregation. This results in a colorimetric response that can be exploited to detect and quantify MGO.
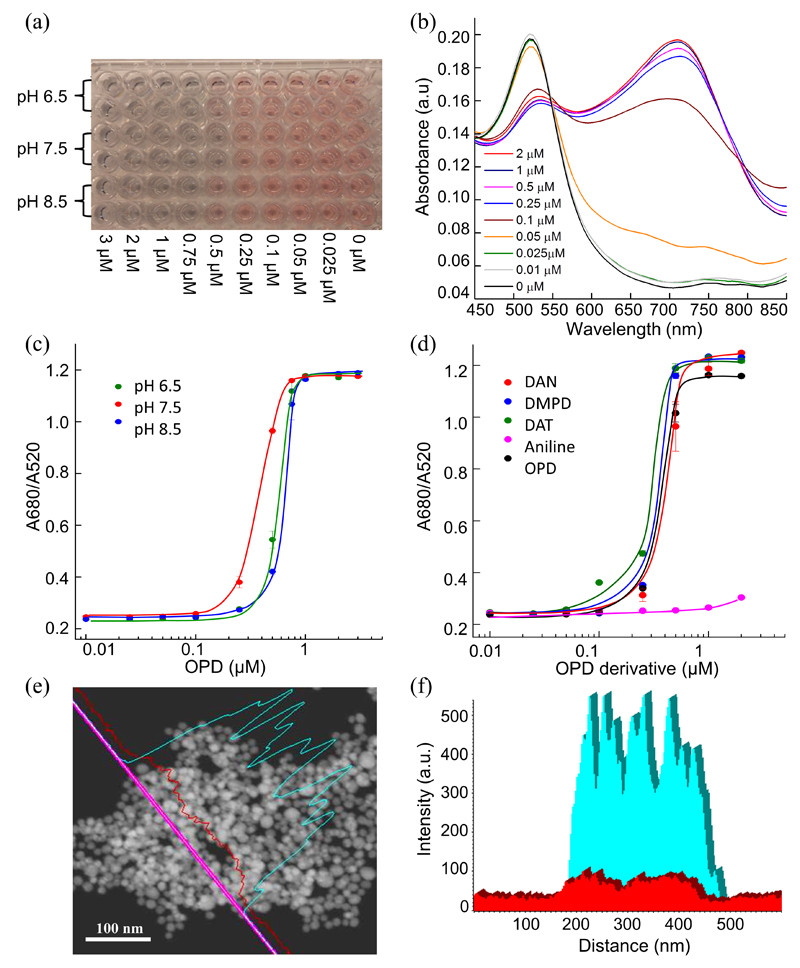
As shown in Fig. 1a, the addition of OPD to 13 nm citrate-capped AuNPs (OD520 = 0.2, Fig. S1, ESI) immediately generates a colour change in the solution dependent on OPD concentration. A visible red-to-blue colour change was noted at as low as 0.5 μM OPD. The UV-visible spectra showed a decreased absorbance at 520 nm and the simultaneous appearance of an absorbance peak at 680 nm which increased in intensity with OPD concentration (Fig. 1b). By plotting the A680/A520 value against OPD concentration, the detection limit of OPD was determined to be 0.25 μM (Fig. 1c). A similar phenomenon of OPD-induced AuNP aggregation was observed at different pH values (Fig. 1a and 1c). This solution colour change was shown to be due to the modulation of surface plasmonic resonance (SPR) originating from the aggregation of AuNPs through dynamic light scattering (DLS, Fig. S2, ESI) and transmission electron microscopy (TEM, Fig. S3a, ESI). We also investigated a series of OPD analogues (aniline, 2,3-diaminonapthalene, 3,4-diaminotoluene and 4,5-dimethyl-2-phenylenediamine) to better understand the mechanism of AuNP aggregation. Interestingly, the analogues bearing two amino groups at ortho- positions exhibited similar abilites to induce AuNP aggregation (Fig. 1d), while aniline with only a single amino group caused AuNP aggregation at only much higher concentrations (> 10 μM).
Fig. 1.
(a) Photograph of AuNP aggregation with varying OPD concentration (from left to right): 3, 2, 1, 0.75, 0.5, 0.25, 0.1, 0.05, and 0.025 μM at different pH values. (b) UV-visible spectra of citrate-capped AuNPs incubated with OPD at various concentrations ranging from 0.025 μM to 2 μM. (c) Absorbance ratio of 680 nm and 520 nm (A680/A520) of AuNP solutions incubated with OPD in 30 mM phosphate buffer at pH 6.5, 7.5 and 8.5. (d) A680/A520 of AuNP solutions incubated with various OPD analogues including aniline, 2,3-diaminonapthalene (DAN), 3,4-diaminotoluene (DAT) and 4,5-dimethyl-2-phenylenediamine (DMPD). (e) Dark field-scanning transmission electron microscopy (DF-STEM) imaging of aggregated AuNPs induced by 0.5 μM OPD, and the element mapping (f) performed by line scanning across the aggregates (pink line in (e)), confirming the presence of nitrogen correlating with the Au bands, indicating the attachment of OPD to the AuNPs.
According to the DLVO theory, colloidal particles in aqueous solution are stabilised by a combination of electrostatic repulsion and steric effects.12 However, the AuNP aggregation induced by OPD seen here is not ascribed to the screening of electrostatic repulsion or the decrease of sterics. Since the pKbs of OPD are 9.43 and 13.2, only 1 % of amine groups of OPD are protonated at pH 6.5. This implies that OPD induced Au aggregation is not due to the screening of surface charges. It is hence reasonable that solution pH does not affect the sensitivity of AuNP aggregation (Fig. 1c). The ζ-potential of aggregated AuNPs in the presence of OPD (-25.7 mV) is also close to that in its absence (-29.4 mV) which suggests that aggregation is not due to the decrease of charge density at the Au surface. Instead, we propose that AuNP aggregation is due to an increase in surface hydrophobicity originating from OPD binding to AuNPs via amine-gold affinity as proposed in previous works.13, 14 The binding of OPD to the Au surface was characterised by energy-dispersive X-ray spectroscopy (EDX) (Fig S3b, ESI) and imaged through dark field-scanning transmission electron microscopy (DF-STEM). Nitrogen originating from OPD could be detected in the large AuNP aggregates and correlated with the Au bands (Fig. 1e, f). This superior binding over citrate was due to the bidentate structure of OPD that coordinates to the metal. This also explains why diamine analogues exhibit a much higher efficiency to induce AuNP aggregation than aniline (Fig. 1d). By contrast, AuNP aggregation was not observed even at higher concentrations (1 mM) of OPD when the AuNP surface was capped with 3-mercatopropionic acid (MPA), which prevented the coordination of diamine groups to the AuNPs (Fig. S4, ESI). We conclude that the binding of OPD to Au surface through nitrogen-gold coordination increases the surface hydrophobicity and hence induces AuNP aggregation.
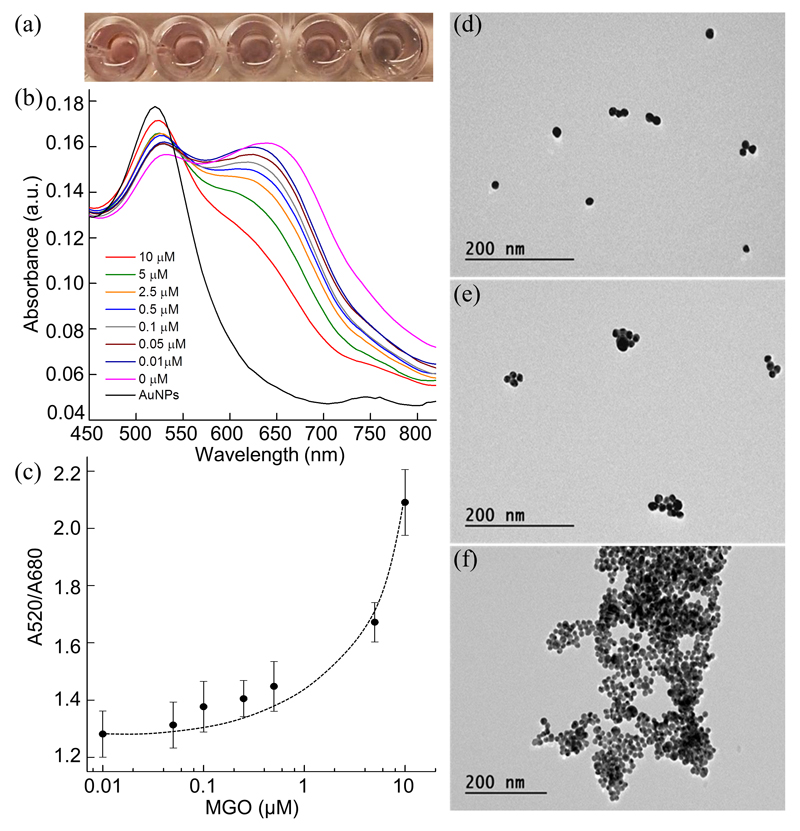
In a similar manner to the Maillard reaction, MGO can react with the ortho-amine group of OPD to form the stable adduct 2-MQ. This reaction has been used previously to develop assays for the chromatographic sensing of MGO. Nuclear magnetic resonance (NMR) spectroscopy was performed to confirm the formation of 2-MQ in a solution of OPD and MGO (Fig. S5, ESI). Subsequently, this reaction was used to develop a colorimetric assay for MGO detection. Briefly, MGO at different concentrations was incubated with 0.5 μM OPD for 30 minutes before the addition of citrate-capped AuNPs. Depending on the concentration of MGO and thereby the remaining OPD in solution, the AuNP solution displays varied aggregation states, leading to different surface plasmonic properties and solution colours. In principle, higher concentrations of MGO result in less OPD in solution and hence inhibit the aggregation of AuNPs. As shown in Fig. 2a, the OPD-Au solution gives a blue-to-red transition above an MGO concentration of 1 μM. The absorption spectra also showed a decrease in absorption peak at 680 nm and simultaneous increase at 520 nm with increasing MGO concentration (Fig. 2b). By plotting the A520/A680 against MGO concentration in Fig. 2c, it was observed that MGO could be detected by UV-visible spectroscopy at a concentration as low as 0.05 μM. The effect of particle size and concentration on this assay was studied (Fig. S6, ESI), with a reduction in AuNP concentration lowering the resultant signal as expected. Interestingly, larger AuNPs (20 nm) showed enhanced target signal likely due to stronger localised SPR15. Importantly, MGO detection was also possible in pre-treated human serum. Due to the coating of proteins on the Au surface, the aggregation of AuNPs is less in serum and therefore the MGO sensing was determined by plotting A520/A598 which allowed detection of as low as 1 μM MGO in 30 v/v % serum (Fig. S7, ESI). Thus, this method could prove to be a reliable means by which to discriminate the concentration of MGO in hyperalgesia in diabetic neuropathy, which is in general around 2-4 folds higher in the plasma samples from diabetic individuals.4 The anti-aggregation of AuNPs mediated by MGO was also confirmed by DLS (Fig. S8, ESI) and TEM (Fig. 2d-f), with AuNP aggregation significantly inhibited by MGO, while large particle aggregates were found in its absence. Importantly, the assay could be completed within 40 min. This compares favourably with currently used techniques for MGO detection which typically take up to 5 hrs to obtain accurate quantification7.
Fig. 2.
(a) Photograph of OPD-AuNP solution in the presence of 10, 5, 1, and 0.5 μM MGO (from left to right). (b) UV-visible spectra and (c) absorbance ratio (A520/A680) of the detection system with different concentrations of MGO at a fixed OPD concentration of 0.5 μM. (d-f) TEM images showing AuNPs in the presence of 0.5 μM OPD and (d) 5 μM, (e) 0.5 μM and (f) 0 μM MGO.
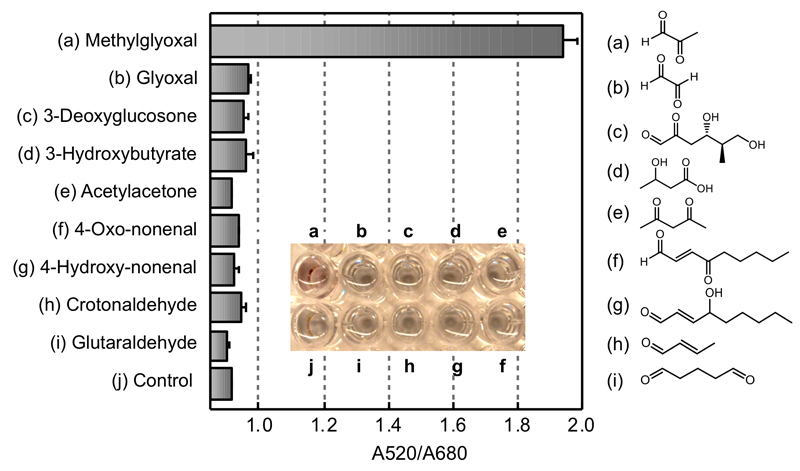
The selectivity of this assay was examined by comparing the detection of MGO with other physiologically relevant ketones and aldehydes, including glyoxal, 3-deoxyglucosone, 3-hydroxybutyrate, acetylacetone, 4-oxo-nonenal, 4-hydroxynonenal, crotonaldehyde, and glutaraldehyde (Fig. 3). High selectivity towards MGO was observed among the carbonyls tested, including other glycation-related dicarbonyls, such as glyoxal, and 3-deoxyglucosone. The successful discrimination of MGO from the other reactive dicarbonyls is due to the high reactivity of MGO with OPD in which a 78 % conversion to 2-MQ is accomplished in 30 minutes (Fig. S9, ESI). By contrast, only 18 % of the corresponding product is formed by the reaction of 3-deoxyglucosone and OPD in the same time, while the reaction of glyoxal shows an even lower reaction rate. Therefore, the assay provides a selective strategy for detecting MGO, and a potential system for monitoring long-term diabetes development and the onset of AGE formation.
Fig. 3.
Plot illustrating the selectivity of the MGO anti-aggregation assay. A520/A680 was plotted against different ketones and aldehydes at a concentration of 10 μM.
Conclusions
A new colorimetric assay was designed for the detection of MGO, a diabetic marker, by employing a bio-inspired MGO-OPD reaction to mediate AuNP aggregation. Bidentate-amino ligands such as OPD were found to cause AuNP aggregation by increasing the surface hydrophobicity of the particles. Depending on the concentration of target MGO and the remaining concentration of OPD, the AuNP solution displays different aggregation states, plasmonic spectra and solution colours. This assay has been demonstrated to be able to detect 1 μM MGO by the naked eye and 0.05 μM by UV-visible spectroscopy, which is in the clinical range for diabetes diagnosis and monitoring. Discrimination of MGO from other biologically relevant ketones and aldehydes was observed to benefit from the different reaction rates of these compounds with OPD. This detection system offers the advantages of simplicity, specificity, and selectivity against other physiological-related ketones and aldehydes. In addition, it offers a significantly improved detection times over previously reported methods. Such transduction of a chemical reaction into plasmonic signals is also expected to be useful for the monitoring of organic reactions or designing plasmon-based logic gates.16
Supplementary Material
† Electronic Supplementary Information (ESI) available: [TEM, DLS, DF-STEM, NMR and UV-visible spectra of AuNPs with or without OPD, the reaction kinetics between OPD and MGO]. See DOI: 10.1039/c000000x/
Acknowledgement
S.-T. Wang thanks the support of the Top University Strategic Alliance PhD scholarship from Taiwan. We thank Dr. B. F. Pierce for critical reading of the manuscript. M. M. Stevens thanks the support from the Engineering and Physical Sciences Research Council (EPSRC) (EP/K020641/1) and the ERC Consolidator grant “Naturale-CG”.
Notes and references
- 1.Brownlee M. Nature. 2001;414:813–820. doi: 10.1038/414813a. [DOI] [PubMed] [Google Scholar]
- 2.Degenhardt TP, Thorpe SR, Baynes JW. Cell Mol Biol. 1998;44:1139–1145. [PubMed] [Google Scholar]
- 3.Ahmed N, Argirov OK, Minhas HS, Cordeiro CAA, Thornalley PJ. Biochem J. 2002;364:1–14. doi: 10.1042/bj3640001. [DOI] [PMC free article] [PubMed] [Google Scholar]
- 4.Kalapos MP. Diabetes Res Clin Pr. 2013;99:260–271. doi: 10.1016/j.diabres.2012.11.003. [DOI] [PubMed] [Google Scholar]
- 5.Chan W-h, Wu H-j. Acta Pharmacol Sin. 2006;27:1192–1198. doi: 10.1111/j.1745-7254.2006.00374.x. [DOI] [PubMed] [Google Scholar]
- 6.Dhar A, Desai K, Liu J, Wu L. J Chromatogr B. 2009;877:1093–1100. doi: 10.1016/j.jchromb.2009.02.055. [DOI] [PubMed] [Google Scholar]
- 7.Rabbani N, Thornalley PJ. Nat Protoc. 2014;9:1969–1979. doi: 10.1038/nprot.2014.129. [DOI] [PubMed] [Google Scholar]
- 8.Wu M-Y, Chen B-G, Chang CD, Huang M-H, Wu T-G, Chang D-M, Lee Y-J, Wang HC, Lee C-I, Chern C-L, Liu RH. J Chromatogr A. 2008;1204:81–86. doi: 10.1016/j.chroma.2008.07.040. [DOI] [PubMed] [Google Scholar]
- 9.Howes PD, Rana S, Stevens MM. Chem Soc Rev. 2014;43:3835–3853. doi: 10.1039/c3cs60346f. [DOI] [PMC free article] [PubMed] [Google Scholar]
- 10.Burda C, Chen XB, Narayanan R, El-Sayed MA. Chem Rev. 2005;105:1025–1102. doi: 10.1021/cr030063a. [DOI] [PubMed] [Google Scholar]
- 11.Rosi NL, Mirkin CA. Chem Rev. 2005;105:1547–1562. doi: 10.1021/cr030067f. [DOI] [PubMed] [Google Scholar]
- 12.Verwey EJWO, JTG . Theory of the Stability of Lyophobic Colloids. Elsevier; Amsterdam, The Netherlands: 1948. [Google Scholar]
- 13.Laromaine A, Koh L, Murugesan M, Ulijn RV, Stevens MM. J Am Chem Soc. 2007;129:4156–4157. doi: 10.1021/ja0706504. [DOI] [PubMed] [Google Scholar]
- 14.Hodgdon TK, Kaler EW. Curr Opin Colloid Interface Sci. 2007;12:121–128. [Google Scholar]
- 15.Link S, El-Sayed MA. J Phys Chem B. 1999;103:4212–4217. [Google Scholar]
- 16.Liu D, Chen W, Sun K, Deng K, Zhang W, Wang Z, Jiang X. Angew ChemInt Ed. 2011;50:4103–4107. doi: 10.1002/anie.201008198. [DOI] [PubMed] [Google Scholar]
Associated Data
This section collects any data citations, data availability statements, or supplementary materials included in this article.


