

Abstract
Peptidic Natural Products (PNPs) are widely used compounds that include many antibiotics and a variety of other bioactive peptides. While recent breakthroughs in PNP discovery raised the challenge of developing new algorithms for their analysis, identification of PNPs via database search of tandem mass spectra remains an open problem. To address this problem, natural product researchers utilize dereplication strategies that identify known PNPs and lead to the discovery of new ones even in cases when the reference spectra are not present in existing spectral libraries. DEREPLICATOR is a new dereplication algorithm that enabled high-throughput PNP identification and that is compatible with large-scale mass spectrometry-based screening platforms for natural product discovery. After searching nearly one hundred million tandem mass spectra in the Global Natural Products Social (GNPS) molecular networking infrastructure, DEREPLICATOR identified an order of magnitude more PNPs (and their new variants) than any previous dereplication efforts.
INTRODUCTION
After a long decline in the pace of antibiotics discovery in the 1990s, natural products are again in the center of attention as exemplified by the recent discoveries of novel classes of natural product drugs.1–4 The key condition for enabling the renaissance of the natural product research is a turn from the current one-off process of analyzing natural products to high-throughput discovery pipelines. Thus, in addition to development of new experimental technologies, future studies of natural products will also require new computational approaches.5–7 The recent launch of the Global Natural Products Social (GNPS) molecular networking infrastructure8 brought together over a hundred laboratories that have already generated an unprecedented amount of publicly available mass spectra of natural products. However, to transform natural product discovery into a high-throughput technology and to fully realize the promise of the GNPS project, new algorithms for natural product discovery are needed.6, 9, 10 Indeed, while spectra in the GNPS molecular network represent a gold mine for future discoveries, their interpretation remains a bottleneck.
This paper focuses on Peptidic Natural Products (PNPs), which are produced by two types of biosynthetic machineries: Non-Ribosomal Peptide Synthetases (NRPS)11 and Ribosomally synthesized and Posttranslationally modified Peptide Synthetases (RiPPS).12 NRPS and RiPPS synthesize Non-Ribosomal Peptides (NRPs) and Ribosomally synthesized and Posttranslationally modified Peptides (RiPPs), respectively. NRPs are not directly inscribed in genomes but are made by large multi-modular NRP synthetases using non-ribosomal code. While RiPPs are encoded in the genome, the RiPP-encoding genes are often short making it difficult to annotate them.13
Development of reference spectral libraries of tandem mass spectra (MS/MS) has enabled identification of metabolites by searching spectra against these libraries as an alternative to the searches of candidate molecules in chemical databases.14 However, in the case of PNPs, such libraries are small since, until recently, there was no centralized effort to annotate spectra of various PNPs. While this situation had changed with the release of GNPS,8 the utility of data in this network needs to be enhanced with additional tools that can be applied to large extract collections in therapeutic discovery programs for identification of the previously described natural products and their variants. Such dereplication tools should be fast so that they can be applied to all GNPS spectra.
Natural product researchers face the challenge of maximizing the discovery of new compounds while minimizing the re-evaluation of known compounds. The process of using the information about the chemical structure of a previously characterized compound to identify this compound in an experimental sample (without having to repeat the entire isolation and structure-determination process) is called dereplication.15 Another challenge is finding variants of known compounds since these variants are sometimes more effective in clinical applications. For example, caspofungin is one of many examples of a variant PNP that proved to be effective in clinical applications.16 While many low abundance variants of PNPs have been reported in the last two decades, it is difficult to identify all variants without dedicated computational tools. In this paper, we presented a dereplication algorithm that identified 100s of previously unknown variant PNPs.
In the case of PNPs, MS-based dereplication refers to matching tandem mass spectra against PNPs in a chemical library such as AntiMarin.17 Similarly to database search tools in proteomics (e.g., Sequest18), dereplication algorithms search for Peptide-Spectrum Matches (PSMs) and score them based on similarities between theoretical spectra derived from peptides in the chemical library and experimental tandem spectra. The matched peptide that forms a statistically significant PSM with the highest score (against a given spectrum) is reported as a putative annotation. In many cases, a PNP in the new sample is absent in the database of known PNPs, but its variant is present in this database (e.g., with a mutation, a modification, or an adduct). Identification of an unknown PNP from its known variants is called the variable dereplication (as opposed to the standard dereplication when a PNP is present in the chemical database).
This description hides many details that make PNP identification difficult. First, in difference from peptides analyzed in traditional proteomics (that are assembled from 20 proteinogenic amino acids), PNPs are assembled from hundreds of amino acids. Second, PNP architectures are not limited to linear peptides but include cyclic, branched-cyclic, and even more complex configurations. Third, while there was large effort invested in analyzing statistical significance of PSMs in traditional proteomics, methods for evaluating statistical significance of PNPs are still in infancy. Fourth, search for mutated and modified variants of known PNPs requires complex blind database searches19 since the set of possible mutations and modifications is not known in advance.
Previously developed dereplication approaches include NRP-Dereplication20 algorithm for cyclic peptides and iSNAP21 algorithm for both cyclic and branch-cyclic peptides. However, in difference from NRP-Dereplication, iSNAP does not perform variable dereplication. DEREPLICATOR overcame the limitations of both NRP-Dereplication (cyclic peptides only) and iSNAP (standard dereplication only) and further addressed the problem of evaluating the statistical significance (p-values) of PSMs formed by PNPs. By applying spectral networks22,23 to perform variable dereplication, it enabled the first high-throughput PNP identification effort in the field of natural products that resulted in the discovery of many new variant PNPs.
RESULTS
Outline of the DEREPLICATOR algorithm
Figure 1 and Supplementary Figure 1 show the DEREPLICATOR pipeline that includes the following steps described in the Methods section: (i) generating decoy database of PNPs, (ii) constructing theoretical spectra for all PNPs in the database, (iii) generating and scoring PSMs, (vi) computing p-values of PSMs and generating the set of statistically significant PSMs, (v) computing false discovery rate (FDR), (vi) enlarging the set of found PSMs through variable dereplication via spectral networks.
Figure 1.

DEREPLICATOR pipeline. DEREPLICATOR pipeline includes the following steps: (i) generating decoy database of PNPs (ii) constructing theoretical spectra for all PNPs in the database, (iii) generating and scoring PSMs, (vi) computing p-values of PSMs and generating the set of statistically significant PSMs, (v) computing false discovery rate, (vi) enlarging the set of found PSMs through variable dereplication via spectral networks. Various steps related to target and decoy databases are shown in green and red boxes, respectively. Six peptides identified in target database and two peptides identified in decoy database are shown in green and red, respectively.
The concept of spectral networks22 (also known as molecular networks24 when applied to metabolites and natural products) was introduced to reveal spectra of related peptides within a proteomic dataset without knowing what these peptides are. Nodes in a spectral network correspond to spectra while edges connect spectra that are generated from related peptides, e.g., peptides differing by a single mutations, modification (such as oxidation, acetylation, methylation, etc.), or adduct (such as proton, sodium, potassium, etc.). Spectral networks enable variable dereplication of novel variants of known PNPs via propagation of PSMs through a spectral network25 and allow one to generate a hypothesis regarding the nature of the structural relatedness of peptides represented by the spectra within the network. Spectral networks are well suited for analyzing PNPs since most PNPs form families of related peptides through biosynthetic promiscuity, incomplete biosynthetic processing, non-enzymatic reactions, or mutations between different species (Supplementary Results, Supplementary Fig. 2).
Benchmarking DEREPLICATOR
To benchmark DEREPLICATOR, we used the AntiMarin database17 to dereplicate all spectra from the following GNPS datasets: SpectraGNPS (all spectra in GNPS), Spectra4 (four low-resolution GNPS datasets from S. roseosporus, Bacillus and Pseudomonas cultures, and two wild-type isolates), SpectraHigh (high-resolution GNPS datasets SpectraFungi, SpectraActi, SpectraPseu, and SpectraCyan containing spectra from Fungi, Actinomycetales, Pseudomonas and Cyanobacteria, respectively), and SpectraActi36 (36 subsets of the SpectraActi dataset that contain bacterial extracts from 36 strains with known genome). See Supplementary Tables 1 and 2 as well as Supplementary Fig. 3 for the details about these datasets and for the number of PNPs in various chemical databases.
Analyzing statistical significance of identified PNPs
The crucial element of any MS/MS database search is analysis of statistical significance by computing p-values (for individual PSMs) and FDRs (for the entire set of identified PSMs). To compute p-values, DEREPLICATOR uses MS-DPR algorithm motivated by a similar approach in particle physics. To compute the FDR, DEREPLICATOR uses the concept of decoy database and extends it to non-linear peptides (see Methods). We note that FDR in proteomics is estimated as the ratio of the numbers of identified PSMs (rather than peptides) in the decoy database and the target database. In this paper, we took a more conservative approach by reporting the ratio of the number of identified unique peptides in the decoy and the target database.
We analyzed the distribution of p-values of PSMs and peptides identified by DEREPLICATOR in the search of Spectra4 and SpectraGNPS against the target AntiMarin database and decoy database of the same size (Fig. 2). For SpectraGNPS dataset and p-value threshold of 10−10, DEREPLICATOR identified 8622 PSMs (150 unique peptides) in the target database, and 22 PSMs (11 unique peptides) in the decoy database. This translates into 0.2% FDR at the PSM level and 7.3% FDR at the peptide level. The p-value cutoff 10−10 are two orders of magnitude more stringent than the median p-value of the manually curated PNP spectra in the GNPS spectral library8, the reference library of all annotated tandem mass spectra in GNPS. We thus project that 100s of PNPs reported below represent a fraction of PNPs whose reference spectra have been already deposited to GNPS.
Figure 2.
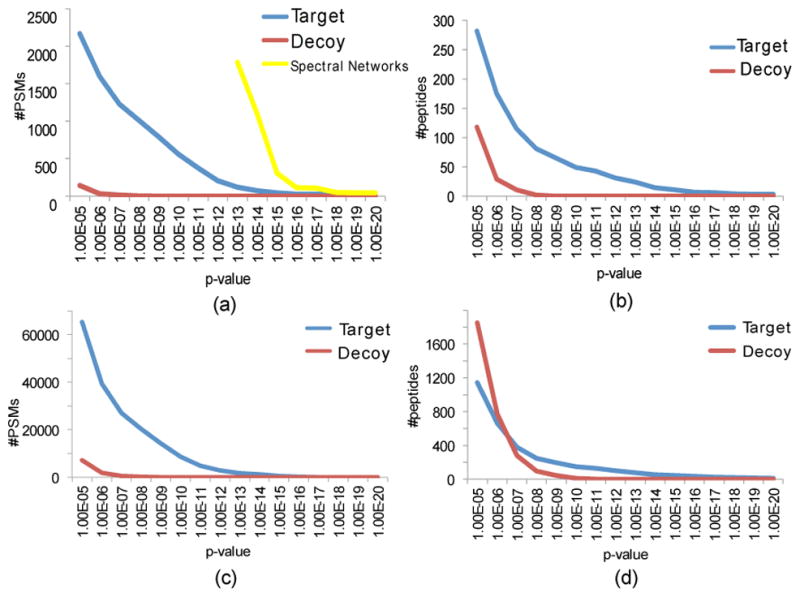
Number of PSMs and peptides identified by DEREPLICATOR. For each x (shown as p-value along the x-axis), the plots show the number of identified PSMs or peptides with p-values below x. (Top) Number of PSMs (a) and peptides (b) for the target AntiMarin and decoy databases in the search of Spectra4. 1787 PSMs and 180 unique PNPs with p-value below 10−13 were dereplicated via spectral networks. (Bottom) Number of PSMs (c) and peptides (d) for the target AntiMarin and decoy databases in the search of SpectraGNPS. All searches were performed with the precursor mass tolerance 0.05 Da.
While none of the decoy PSMs in the Spectra4 dataset have a p-value below 10−11 (estimated FDR is zero), there are 374 PSMs in the target database with p-values varying from 10−11 to 10−27. These PSMs corresponds to 37 unique PNPs (Table 1). Only 2 PSMs were found in the decoy database with p-value below 10−8 as compared to 904 PSM (and 78 peptides) in the target database with p-values below 10−8. While 78 identified PNPs are also represented by reliable PSMs with low FDR 0.2%, we have decided to limit analysis to even more statistically significant 37 dereplicated peptides in Table 1 and to conduct the literature search for all these peptides.
Table 1.
The list of 37 PNPs (in the increasing order of p-values) identified by DEREPLICATOR in the search of Spectra4 against AntiMarin database for p-value threshold 10−11. The precursor mass tolerance was set to 0.05Da. The “organism” column refers to the species present in one of four GNPS datasets contributing to Spectra4 (if known). GNPS datasets MSV000078552 (Bacillus and Pseudomonas cultures), MSV000078557 (Chinese marine strains), MSV000078577 (S. roseosporus), and MSV000078607 (Cubist strains) are referred to as datasets 78552, 78557, 78577, and 78607, respectively. The genomes of the producer organisms are known for the first two datasets but are not available for the last two datasets. B., P., and S. stand for Bacillus, Pseudomonas, and Streptomyces, respectively. The remaining columns specify the PNP from AntiMarin, structure (cyclic or branch cyclic), category (peptide or lipopeptide), p-value, SPCscore, the number of peaks in the spectrum, the number of generalized peptide bonds, the number of PNP variants identified through analysis of the spectral network, and information about the GNPS spectral library search that includes the cosine value and the instrument type (if PNP is present in the spectral library). The final column provides a reference to a paper that contains an image of a spectrum from the PNP (if available) and information from this paper about the species producing this PNP (if available). Since for tolaasins and massetolide (rows 2, 3, and 26), spectra in Spectra4 dataset and GNPS spectral library were collected with different instruments (LTQ-FTICR and qTof, respectively), we did not report their cosines. LTQ-FTICR and hybrid FT are abbreviated as LTQ and hFT, respectively. All spectra in Spectra4 were collected on ThermoFinnigan LTQ instrument with ESI ionization, linear ion trap analyzer, CID activation, and electron multiplier detector.
| # | organism | GNPS | PNP | str | category | p-value | SPC score | # peaks | # bonds | # var | library-search (instrument) | producer/reference |
|---|---|---|---|---|---|---|---|---|---|---|---|---|
| 1 | B. clausii | 78552 | Bacitracin A | bcyc | peptide | 2.0E-26 | 25 | 100 | 11 | 1 | n/a | Bacillus26 |
| 2 | P. tolaasii CH36 | 78552 | Tolaasin I | bcyc | lipo | 3.4E-22 | 21 | 76 | 18 | 1 | qTof | P. tolaasii27/28 |
| 3 | P. tolaasii CH36 | 78552 | Tolaasin B | bcyc | lipo | 2.5E-21 | 22 | 149 | 18 | 1 | qTof | P. tolaasii28/28 |
| 4 | S. roseosporus | 78577 | Daptomycin | bcyc | lipo | 6.3E-19 | 25 | 125 | 13 | 1 | 0.55 (LTQ) | S. roseosporus29 |
| 5 | B. subtilis NCIB 3610 | 78552 | Surfactin B | cyc | lipo | 1.8E-18 | 18 | 70 | 7 | 3 | 0.77 (LTQ) | B. subtilis30 |
| 6 | Streptomyces | 78557 | Surfactin variant | cyc | lipo | 5.6E-18 | 18 | 149 | 7 | 1 | 0.75 (LTQ) | -/30 |
| 7 | P. tolaasii CH36 | 78552 | Tolaasin C | bcyc | lipo | 1.9E-17 | 15 | 155 | 19 | 1 | n/a | P. tolaasii28/28 |
| 8 | B. subtilis subsp. spizizenii | 78552 | Mycosubtilin III | cyc | lipo | 1.4E-16 | 14 | 75 | 8 | 1 | n/a | B. subtilis31/- |
| 9 | S. roseosporus | 78577 | Stenothricin IV | bcyc | lipo | 1.7E-16 | 24 | 90 | 9 | 4 | 0.53 (LTQ) | Streptomyces32/29 |
| 10 | B. subtilis NCIB 3610 | 78552 | Surfactin variant_ | cyc | lipo | 3.4E-16 | 19 | 70 | 9 | 3 | 0.77 (LTQ) | B. subtilis30 |
| 11 | B. subtilis NCIB 3610 | 78552 | Plipastatin variant | bcyc | lipo | 3.9E-16 | 24 | 115 | 10 | 1 | n/a | B. subtilis/33 |
| 12 | Streptomyces | 78557 | Glumamycin | bcyc | lipo | 1.2E-15 | 25 | 90 | 12 | 2 | n/a | -/- |
| 13 | B. subtilis NCIB 3610 | 78552 | Surfactin A1 | cyc | lipo | 4.5E-15 | 15 | 70 | 7 | 1 | 0.77 (LTQ) | B. subtilis30 |
| 14 | Streptomyces | 78557 | Valinomycin | cyc | peptide | 6.3E-15 | 6 | 75 | 6 | 12 | 0.71 (hFT) | -/34 |
| 15 | B. subtilis NCIB 3610 | 78552 | Plipastatin variant | bcyc | lipo | 1.2E-14 | 26 | 115 | 10 | 1 | n/a | B. subtilis33/33 |
| 16 | B. subtilis NCIB 3610 | 78552 | Surfactin D | cyc | lipo | 2.3E-14 | 17 | 75 | 7 | 3 | n/a | B. subtilis30 |
| 17 | B. subtilis NCIB 3610 | 78552 | Surfactin variant | cyc | lipo | 2.7E-14 | 16 | 70 | 7 | 3 | 0.60 (LTQ) | B. subtilis30 |
| 18 | S. roseosporus | 78577 | A21978 C2 | bcyc | lipo | 2.8E-14 | 24 | 140 | 13 | 2 | 0.51 (LTQ) | S. roseosporus29 |
| 19 | S. roseosporus | 78577 | Stenothricin I | bcyc | lipo | 3.0E-14 | 21 | 90 | 9 | 4 | 0.43 (LTQ) | Streptomyces32/29 |
| 20 | unknown | 78607 | Kurstakin 2 | bcyc | lipo | 4.2E-14 | 7 | 60 | 7 | 7 | n/a | -/35 |
| 21 | S. roseosporus | 78577 | A21978 C3 | bcyc | lipo | 4.3E-14 | 18 | 120 | 13 | 2 | 0.51 (LTQ) | S. roseosporus29 |
| 22 | B. subtilis NCIB 3610 | 78552 | Surfactin variant | cyc | lipo | 5.2E-14 | 16 | 70 | 7 | 1 | 0.77 (LTQ) | B. subtilis30 |
| 23 | S. roseosporus | 78577 | Stenothricin III | bcyc | lipo | 5.2E-14 | 23 | 90 | 9 | 1 | 0.64 (LTQ) | Streptomyces32/29 |
| 24 | S. roseosporus | 78577 | A21978 C1 | cyc | lipo | 5.7E-14 | 30 | 135 | 13 | 2 | 0.54 (LTQ) | S. roseosporus29 |
| 25 | B. subtilis NCIB 3610 | 78552 | Surfactin variant | bcyc | lipo | 1.3E-13 | 14 | 65 | 7 | 1 | 0.77 (LTQ) | B. subtilis30 |
| 26 | P. fluorescens BW10S2 | 78552 | Massetolide F | bcyc | lipo | 1.8E-13 | 14 | 90 | 9 | 1 | qTof | P. fluorescens36/37 |
| 27 | B. licheniformis | 78552 | Bacitracin B3 | bcyc | peptide | 3.5E-13 | 21 | 115 | 11 | 1 | n/a | Bacillus26 |
| 28 | B. subtilis NCIB 3610 | 78552 | Surfactin variant | cyc | lipo | 3.9E-13 | 14 | 70 | 7 | 3 | n/a | B. subtilis30 |
| 29 | unknown | 78607 | Kurstakin 1 | bcyc | lipo | 8.7E-13 | 7 | 60 | 7 | 7 | n/a | -/35 |
| 30 | B. cereus | 78552 | Kurstakin 4 | bcyc | lipo | 1.6E-12 | 7 | 108 | 7 | 5 | n/a | Bacillus38/35 |
| 31 | Streptomyces | 78557 | Lichenysin G5a | cyc | lipo | 1.9E-12 | 16 | 120 | 7 | 3 | n/a | -/30 |
| 32 | B. pamilus | 78552 | Surfactin variant | cyc | lipo | 2.7E-12 | 15 | 75 | 7 | 1 | n/a | B. subtilis30 |
| 33 | B. subtilis NCIB 3610 | 78552 | Plipastatin B2 | bcyc | lipo | 3.1E-12 | 25 | 122 | 10 | 1 | 0.80 (LTQ) | B. subtilis33/33 |
| 34 | S. roseosporus | 78577 | Stenothricin II | bcyc | lipo | 3.4E-12 | 22 | 90 | 9 | 4 | 0.40 (LTQ) | Streptomyces32/29 |
| 35 | B. subtilis NCIB 3610 | 78552 | Plipastatin variant | bcyc | lipo | 3.8E-12 | 26 | 115 | 10 | 1 | n/a | B. subtilis33/33 |
| 36 | B. amyloliquefaciens FZB42 | 78552 | Plipastatin A2 | bcyc | lipo | 5.8E-12 | 24 | 120 | 10 | 1 | 0.75 (LTQ) | B. subtilis33/33 |
| 37 | B. subtilis NCIB 3610 | 78552 | Plipastatin A1 | bcyc | lipo | 6.8E-12 | 23 | 115 | 10 | 1 | n/a | B. subtilis33/33 |
Validation of DEREPLICATOR results
Using the conservative FDR cutoff, we set out to validate the result of DEREPLICATOR by (i) comparing with results reported in the literature, (ii) comparing with available spectra from known PNPs, and (iii) through analyzing the biosynthetic capacity of the producing organisms.
Table 1 lists 37 PNPs (13 cyclic and 24 branch cyclic) from PSMs identified by DEREPLICATOR with p-values below 10−11. To validate them, we surveyed the papers reporting spectra of these PNPs. Since the spectra for most of these PNPs are only available as images in the journal papers (rather than computer files), we were limited to comparing these images with spectra in Spectra4 dataset by eye. For 35 out of 37 PNPs, a tandem mass spectrum of peptide was published in the literature and a visual comparison confirmed that the dereplicated PNPs were deemed to be correct.
We further analyzed the species that gave rise to the PNPs in Table 1. If these species are evolutionary close to the PNP-producing species reported in the published papers, we considered it as an additional evidence supporting the dereplicated PNPs. For 31 out of 37 PNPs, information about the PNP producer was available, and for all of them, the journal paper reported that these PNPs are produced by an evolutionary close bacterial species. Overall, 36 out of 37 PNPs in Table 1 are supported by at least one of these two tests. Presence of multiple PNPs from the same PNP family in Table 1 (e.g., eight variants of surfactin) represents additional evidence that these PNPs were correctly identified.
To further evaluate PSMs identified by DEREPLICATOR, we compared spectra forming these PSMs to the annotated spectra in the GNPS spectral library8 that currently contains only 81 PNPs and includes only 21 out of 37 PNPs listed in Table 1. Moreover, only 18 of these 21 PNP in GNPS spectral library have spectra generated with the same type of instrument (LTQ-FTICR) as the spectra in Spectra4 dataset. Remarkably, all these 18 spectra in GNPS turned out to be similar to spectra in the Spectra4 dataset with cosine values varying from 0.4 to 0.8 (the cosine value for spectra from different peptides are expected to be close to 0).
Dereplication of the entire GNPS molecular network
Since GNPS often misses the information whether a specific spectral dataset was acquired using a low- or high-resolution instrument, we decided to analyze all spectra in GNPS in the low-resolution mode. For SpectraGNPS dataset and the p-value threshold 10−11, DEREPLICATOR identified 4892 PSMs (129 peptides) in the target database and 8 PSMs (3 peptides) in the decoy database. Supplementary Table 3 lists the 129 identified PNPs (71 cyclic, 41 branch cyclic, and 17 linear) that include 47 peptides, 81 lipopeptides, and a hybrid polyketide-peptide. When the spectral network is used for variable dereplication, the number of identified PSMs for the entire GNPS dataset (at p-value 10−11) increases to 69995 (see Supplementary Fig. 2 for examples). About 75% of PNPs from AntiMarin listed in Table 3 have variant PNPs (as revealed by neighbors in the GNPS molecular network), bringing to light a remarkable diversity of previously unreported PNP variants (Supplementary Table 4).
To further evaluate the PNPs found via variable dereplication, we analyzed the mass shifts of PNP variants from Supplementary Table 4 as compared to known PNPs from Supplementary Table 3. If the novel PNP variants are correct then we expect them to have many characteristic mass shifts such as 14 Da, a change of CH2.29 The histogram of mass shifts of PNP variants (Supplementary Fig. 4) illustrates that a large fraction of them (≈40%) have characteristic mass shifts 14Da, 17Da, 18Da, 28Da, 30Da, 42Da and 113Da. The spectral network of stenothricins further illustrates how analysis of spectral networks and characteristic mass shifts reveals new members of the PNP families (Supplementary Fig. 2). Indeed, the mass shift 7 Da connecting the three known stenothricins, also connects stenothricin IV with a node 573.808 Da. Since the spectra in this connected component originate from doubly charged ions, 7 Da corresponds to the characteristic mass shift 14 Da.
Dereplication of the GNPS spectral library
To further validate DEREPLICATOR, we analyzed all 81 annotated and manually curated spectra of PNPs in the GNPS spectral library. 40 out of 81 PSMs formed by PNPs in this library have low p-values (below 10−8) that DEREPLICATOR usually considers as reliable PSMs (21 out of 81 are represented by very low-quality spectra with p-values above 10−4). Thus, all PSMs reported in this paper represent much higher quality spectra than most (41 out of 81) spectra in the manually curated GNPS spectral library (their p-values are at most 10−11, three orders of magnitude lower than the median p-value in the GNPS spectral library).
DEREPLICATOR correctly identified all 40 high-quality spectra in the GNPS spectral library. Even with extremely high p-value threshold of 10−4, DEREPLICATOR correctly identified 58 out of 81 spectra in the GNPS spectral library. This analysis illustrates that the low p-value threshold 10−11 that we used in this paper is conservative and that GNPS is likely to contain spectra representing thousands more variant PNPs.
Dereplication of short PNPs
Since spectra of short peptides have smaller information content (smaller number of fragment ions matching theoretical spectra) than long peptides, their p-values are typically larger. As the result, a typical cutoff for the size of the peptide in proteomics is 7 amino acids (6 amide bonds) since otherwise the FDR exceeds the acceptable threshold. As Supplementray Table 2 illustrates, for SpectraHigh dataset with the FDR threshold set to 0%, the default mode of DEREPLICATOR identifies 6, 11, 19, 51, and 213 PNPs with 2, 3, 4, 5, and 6 or more bonds, respectively (Supplementary Fig. 5).
To improve identification of short PNPs, we implemented a special mode of DEREPLICATOR optimized for short PNP identification (see Methods section). As the result, the number of identified short PNPs with less than 6 bonds increased from 125 to 193 PNPs at FDR 15%, and the percentage of AntiMarin compounds discovered in the SpectraHigh dataset (analyzed in Supplementary Table 5) increased to 9% for 6 bonds or more, 14% for 5 bonds, 3% for 4 bonds, and 2% for 3-bond compounds, out of all AntiMarin compounds. Note that DEREPLICATOR generates a theoretical spectrum for each PNP (including short PNPs) by considering generalized peptide bonds that include N-C-O linkage amide bonds as well as C-C-O linkage bonds between thiazoles/oxazoles and dehydroalanines/dehydrobutyrines and other amino-acids (Supplementary Fig. 6).
High-resolution vs. low-resolution MS/MS for PNP discovery
We searched the SpectraHigh dataset against the target AntiMarin database and decoy database of the same size and identified 5109 PSMs (325 PNPs) in the target database and 59 PSMs (42 PNPs) in the decoy database at the p-value threshold 10−10. Note that, for the same dataset, the number of identified PNPs in the low-resolution mode reduces from 325 to 79 as compared to the high-resolution mode (with 2 PSMs and 2 peptides identified in the decoy database in the low-resolution mode). Interestingly, the p-values in the high-resolution mode are typically at least 5 orders of magnitude lower than p-values in the low-resolution mode (Supplementary Table 6). The fact that the high-resolution spectra are vastly superior to the low-resolution spectra with respect to non-linear PNP identification (4-fold increase in the number of identified PNPs) is surprising since the difference between the high-resolution and the low-resolution spectra with respect to identification of linear peptides in proteomics is not so large (20%–30% increase39).
To validate PNPs identified in the SpectraHigh dataset, we further analyzed their distributions between Fungi, Actinomycetales, Pseudomonas and Cyanobacteria. According to AntiMarin, the lion’s share (167 out of 180) of PNPs identified from the SpectraFungi dataset are first reported in fungal sources. Similarly, the lion’s share (53 out of 64) of peptides identified from the SpectraCyan dataset are first reported in cyanobacterial sources. Some of 13 peptides identified from SpectraFungi dataset and forming PSMs with non-fungal sources, are clearly not false identifications, e.g., all four Pseudomonas peptides are variants of massetolide (it is unlikely that four spurious PSM originate from the same PNP family). There are a few reasons why spectra from SpectraFungi datasets form PSMs with peptides from bacterial sources apart from being false PSMs, e.g., laboratory contamination and morphology misidentification as many collections contain misidentified organisms.
A similar analysis of SpectraActi and SpectraPseu datasets should be done with caution since B. subtilis was added as true positive to these samples. As the result, 42 and 22 peptides from Bacillus sources were identified in SpectraActi and SpectraPseu, respectively. After removing surfactins (typically associated with Bacillus species), the lion’s share of peptides identified in SpectraActi (31 out of 35) and SpectraPseu (12 out of 18) had Actinomycetales and Pseudonomas sources, respectively (Fig. 3). It further suggests that metabolite origin tracking using DEREPLICATOR can become a useful tool for capturing contamination or incorrect sample labeling.
Figure 3.

Number of peptides identified by DEREPLICATOR in SpectraHigh dataset. The number of unique peptides identified from Fungal/Actinomycetales/Pseudomonas/Cyanobacteria spectral datasets, coming from Fungal/Actinomycetales/Pseudomonas/Cyanobacteria sources. Since B. subtilis was added to the extracts from the samples SpectraActi and SpectraPseu, 42 and 22 peptides from Bacillus sources identified in SpectraActi and SpectraPseu represent contaminants. Since Bacillus growth media is similar to that of Actinomycetes and Pseudomonas, samples from Actinomycetes and Pseudomonas often have small Bacillus contaminations that originates from pre-autoclaving growth in the media.
Using DEREPLICATOR to optimize sample preparation
The dataset SpectraActi36 was collected under three different growth conditions and extracted in three different ways. DEREPLICATOR can screen the output of the experiment and reveal promising versus not-so-promising experimental conditions (microorganisms can produce different PNPs under different conditions). We used DEREPLICATOR to investigate which of 9 combinations of growth conditions and extraction methods performs the best for the PNP discovery. In addition to 9 pairs (strain, peptide) shown as blue squares in Supplementary Fig. 7, DEREPLICATOR also found surugamide in 2 out of 36 strains bringing the maximum possible number of pairs (strain, peptide) to 11 for each of 9 possible conditions. Supplementary Fig. 8 illustrates that butanol extract from A1 agar recovers 10 out of 11 (90%) such pairs, making it the most efficient combination.
Cross-validating genome mining and peptidomics results
We further cross-validated PNPs identified by DEREPLICATOR from SpectraActi36 dataset partitioned into 36 subsets.13, 40–42 Since we have two independent approaches (mass spectrometry and genome mining) to check whether a given strain produces a given PNP, we can cross-validate their results. At a p-value threshold of 10−10, DEREPLICATOR identified 9 PNPs in 8 out of 36 strains in these datasets (grisemycin, CDA, daptomycin, actinomycin, stendomycin, cyclomarin, salinamide, arylomycin, and surugamide).
We extracted the biosynthetic gene cluster for eight of these 9 PNPs from MIBiG43 (the biosynthetic gene cluster for surugamide remains unknown) and performed a BLAST search of the 36 actinomycetales against these gene clusters. This search revealed that, in majority of the cases, when DEREPLICATOR reports evidence for production of a chemotype in a specific strain, genome mining also predicted the corresponding genotype in the same strain thus providing additional support for both peptides identified by DEREPLICATOR and for MIBiG predictions (Supplementary Fig. 7).
DEREPLICATOR found surugamide in four GNPS datasets from S. albus J1074 generated by independent studies,13, 40, 41 and in a dataset from Streptomyces sp. CNY228. The utility of DEREPLICATOR is illustrated by the surprising fact that all previous studies failed to identify surugamides in S. albus J1074, a workhorse strain for Streptomyces synthetic biology and heterologous expression.44
Validating surugamide compounds
Surugamide45 and the related molecules champacyclin46 and reginamide25 are recently discovered NRPs from marine streptomyces that share the same amino acid sequences. Because multiple pieces of bioinformatics evidences pointed to production of surugamides in S. albus J1074, we set out to validate them experimentally. Although the NRP synthetase responsible for synthesizing surugamides remains unknown, our analysis identified a putative surugamide-encoding NRPS using a peptidogenomics approach47 (this computational hypothesis needs to be experimentally validated). See Supplementary Note for details.
To demonstrate that the molecules corresponding to the identified spectra are indeed surugamides, we conducted a SILAC experiment with S. albus J1074 sample and analyzed the resulting spectral network. The SILAC experiments revealed each incorporated amino acids as a characteristic 6 Da mass shift in the corresponding mass spectrum.
When S. albus J1074 was cultured in the presence of 13C6 -labeled lysine, addition of 13C6 -labeled lysine was observed for surugamide A and surugamide B supporting that these nodes in the spectral network represent surugamides (Fig. 4a). When S. albus J1074 was cultured in the presence of 13C6-labeled isoleucine, 4 additional nodes in the spectral network corresponding to addition of 13C6-labeled isoleucines were observed (Fig. 4b). A green path consisting of 4 edges in Fig. 4b reveals incorporation of up to four 13C6-labeled isoleucines represented by nodes with m/z 918.647, 924.668, 930.688 and 936.686. Further inspection of these spectra revealed incorporation into each of the isoleucine positions. For surugamide B with three isoleucines, the spectral network revealed addition of up to two 13C6-labeled isoleucines.
Figure 4.

Spectral networks illustrating the results of SILAC experiment. (a) Spectral network of surugamides from S. albus J1074 when the strain is labeled by 13C6 isoleucines. A path connecting five green nodes reveals surugamide A (911.621 Da, observed at m/z 912.610) and four SILAC incorporations into isoleucine with characteristic 6 Da mass shifts (surugamide A has four isoleucines which are observed as addition of 6 Da, 12 Da, 18 Da and 24 Da to the precursor ion). Blue nodes reveal incorporations in surugamide B with three isoleucines (897.605 Da, observed at m/z 898.611), and purple nodes reveal incorporations in a previously unknown surugamide variant with two isoleucines (m/z 884.589). (b) Spectral network of surugamides from S. albus J1074 when the strain is labeled by 13C6 lysine. Green and blue nodes reveal SILAC incorporations into a single lysine in surugamides A and B. Sizes of the nodes reflect relative abundance based on total intensity of the ion that was fragmented. Width of the edges connecting the nodes reflects the similarity (cosine score) between corresponding spectra. Since we used a stringent cosine threshold 0.7, some related spectra are not connected by edges. (c) structure of surugamide A.
In summary, our SILAC experiments supported the incorporation of the four isoleucines and the lysine, together with the adenylation domain specificity and location of the epimerase domains in the biosynthetic gene cluster that we predicted. These experiments, together with the fact that no other gene cluster in S. albus J1074 has propensity to produce surugamide, support DEREPLICATOR identifications.
In further confirm that the identified spectrum in the extract of S. albus J1074 is surugamide A, the retention time and the spectrum of m/z 912.627 observed in the extract of S. albus J1074 was compared with the previously purified and NMR-characterized authentic standard of surugamide A.45 Both the retention time and the spectra of authentic surugamide A and putative surugamide A detected in the extract of S. albus J1074 were nearly identical (Supplementary Fig. 9). Furthermore, when the authentic surugamide A was added to the extract of S. albus J1074, a single peak at m/z 912.627 was observed further supporting that the detected molecule in the extract of S. albus J1074 is surugamide A.
DISCUSSION
While molecular networks for PNP discovery recently gained a lot of momentum,24, 48 they require time-consuming manual follow-up analysis to transform cryptic information into identified spectra of known compounds or their variants. Thus, the shortage of computational tools for PNP analysis is the key bottleneck for taking advantage of the wealth of PNPs in various species.
Currently, over 98% of spectra in the GNPS molecular networking infrastructure represent “dark matter of metabolomics” 49 since they evaded all attempts to interpret them.8 However, much of this dark matter is likely formed by spectra from known molecules present in chemical databases. As the result, there is a contrast between the large number of known structures of natural products and rather small number of their annotated spectra in the GNPS spectral library. Therefore, to fully utilize the potential of the GNPS project, the development of algorithms for matching millions (and soon billions) of spectra of natural products against chemical databases is needed. In the “living data” concept, public data is periodically reanalyzed and new finding are relayed back to biologists who contributed specific datasets. Although DEREPLICATOR can be run as a standalone search through GNPS, it is now also run on each newly deposited public dataset in GNPS to perform both standard and variable dereplication, making it a part of the “GNPS living data.”
Since it is impractical to validate annotations of millions of spectra with isolation and NMR analysis, the only feasible way forward is to develop a measure of statistical confidence of PSMs with respect to the core structure of PNPs (as MS is blind to stereochemistry). While such measures are widely used in proteomics and genomics, they are currently missing in the field of natural products. To address the challenge of evaluating the statistical significance of PSMs identified by DEREPLICATOR, we complemented it with p-values and demonstrated that PSMs with low p-values represent confident spectral identifications with low FDR.
DEREPLICATOR is the first software tool in the field of natural products that is compatible with high-throughput analysis of millions of spectra and aimed at reducing the peptidic fraction of the “dark matter of metabolomics.” While it has limitations with respect to analyzing short PNPs, it has already increased the size of the publicly available GNPS spectral library of PNPs by an order of magnitude. We envision that DEREPLICATOR will be used to prioritize strains and molecules in natural product discovery programs, to discover analogs of known natural products, and to reveal biosynthetic promiscuity, intermediates, and shunt products.
URLs
DEREPLICATOR is available both as a stand-alone tool (http://cab.spbu.ru/software/dereplicator) and a web application (http://gnps.ucsd.edu).
Online Methods
Below we describe various steps of DEREPLICATOR summarized in Fig. 1.
Constructing theoretical spectra of PNPs
DEREPLICATOR generates a theoretical spectrum for each PNP by first constructing a PNP graph with amino acids as nodes and generalized peptide bonds as edges (Fig. 5a). Herein, generalized peptide bonds include N-C-O linkage amide bonds as well as C-C-O linkage bonds between thiazoles/oxazoles and dehydroalanines/dehydrobutyrines and other amino-acids (Supplementary Figure 6). The notion of generalized peptide bonds is useful as illustrated by identification of the thiazole/oxazole containing PNP plantazolicin from B. amyloliquefaciens, lanthipeptide SapB from S. coelicolor, and complex PNPs such as two-rings containing actinomycin from Streptomyces sp. CNS654 (Supplementary Fig. 6).
Figure 5.
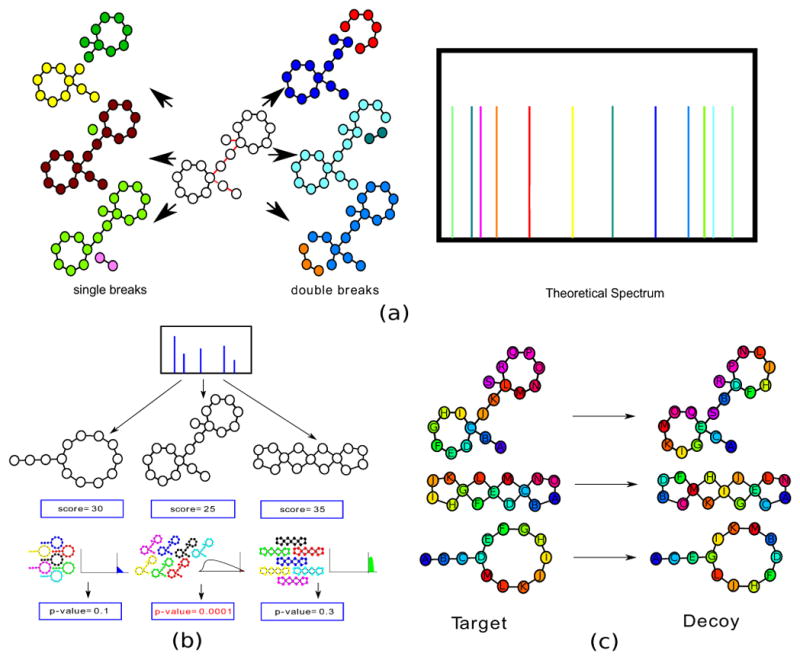
Generating theoretical spectra and computing p-values of PSMs formed by PNPs with various architectures. (a) Generating the theoretical spectrum of a branch-cyclic peptide (only 12 out of 90 peaks in the theoretical spectrum are shown). Nodes and edges in the PNP graph are shown as circles and lines. Bridges are shown as red edges. The intensities of all peaks in the theoretical spectrum are the same since prediction of intensities remains an open problem. (b) MS-DPR50 explores a large set of peptides (enriched for high-scoring peptides) to accurately estimate p-values. Each such set is illustrated as a collection of seven peptides, each with a different shuffled sequence of amino acids. (c) Constructing decoy database of PNPs by randomly rearranging amino acids while preserving the architecture of a PNP.
A generalized peptide bond is called a bridge if removing the bond disconnects the PNP graph. While theoretical spectra of linear peptides are generated by removing all bridges (single bonds), spectra of non-linear peptide are generated by removing some bond pairs. A pair of bonds is called a 2-cut if none of them are bridges but removing both of them disconnects the graph. The theoretical spectrum of a peptide consists of the masses of all subgraphs resulting from removal of a bridge or a 2-cut from the PNP graph. We refer to the theoretical spectrum of Peptide as Spectrum(Peptide).
Generating and scoring PSMs
DEREPLICATOR compares each spectrum in the spectral dataset against each peptide in the chemical database. It further forms a PSM if the precursor mass of the spectrum matches the molecular mass of the peptide (up to a predefined maximum error). Since DEREPLICATOR only compares a spectrum against all peptides with similar mass, the number of peptides to compare against is much smaller than the PNP database size. We score a PSM formed by Peptide and Spectrum using PepNovo51 and MS-GF+.39
SPCscore(Peptide, Spectrum) is defined as the Shared Peak Count, the number of peaks shared between Spectrum(Peptide) and the filtered version of Spectrum as defined by PepNovo.52, 53 Two peaks are shared if their masses are within a predefined threshold. While we utilize SPCscore to summarize the statistics of found PSMs, DEREPLICATOR uses a more advanced MSGFscore.39 Admittedly, since MSGFScore was initially developed for linear peptides, it does not take into account the specifics of fragmentation of non-linear peptides. However, it performs better than SPCscore in our database searches.
Computing p-values of PSMs
The PSM scores poorly correlate with p-values of PSMs23 and thus should not be used for evaluating the statistical significance of found PSMs. Indeed, the PSM scores do not remove the bias towards large PNPs, PNPs with different architectures (e.g., linear vs. cyclic), or spectra with many peaks. While methods for evaluating statistical significance of linear PSMs are well developed,54 they do not extend to the evaluation of the statistical significance of non-linear PSMs.
Estimating p-values of PSMs is a difficult instance of a general problem of estimating the probabilities of extremely rare events. For linear peptides, the generating function approach55 efficiently explores the huge set of all possible peptides (rather than relatively small set of all peptides in the database23) to derive p-values for PSMs. MS-DPR algorithm50 for computing p-values for PSMs formed by nonlinear peptides is motivated by a similar approach in particle physics.56 MS-DPR evaluates p-values based on exploring various peptides that are not present in the peptide database and addresses an important problem of deciding whether a spectrum was generated by a linear, cyclic, or branch-cyclic peptide50 (Fig. 5b). This feature (that was missing in previous approaches) is important for analyzing large datasets containing spectra of PNP with various structures (linear, cyclic and branch cyclic). DEREPLICATOR reports PSMs with p-values below a predefined threshold and informally defines the p-value of a peptide as the minimum p-value of all PSMs formed by this peptide.
Generating decoy database of PNPs
To compute the FDR, DEREPLICATOR uses the concept of decoy database57 and extends it to non-linear peptides. For each PNP in the chemical database (denoted Peptides), DEREPLICATOR constructs a decoy PNP with the same topology but randomly rearranged amino acids (Fig. 5c). The resulting set of PNP forms a decoy database DecoyPeptides.
Computing false discovery rate
Given a chemical database Peptides, a spectral dataset Spectra, and a score threshold T, DEREPLICATOR finds all high-scoring PSMs, i.e., all PSMs formed by a peptide P from Peptides and a spectrum S from Spectra with MSGF Score (P, S) ≥ T. This approach is analogous to the peptide identification approach in proteomics. DEREPLICATOR further computes p-values of all high-scoring PSMs using MS-DPR and forms the list of the high-scoring PSMs in the increasing order of their p-values. Given a p-value threshold θ, we define PSMθ (Peptides, Spectra) as the set of all PSMs in this list with p-values below θ.
To evaluate the statistical significance of PSMs found in proteomics searches, researchers report FDR that estimates the fraction of false PSM among all reported PSMs. The target-decoy approach57 for estimating FDR is based on generating a decoy proteome and searching all spectra against both the target and decoy proteomes. The target-decoy approach further uses the number of PSMs found in the decoy proteome to evaluate the FDR. Since the decoy proteome is generated randomly, we expect to find very few PSMs in PSMθ (DecoyPeptides, Spectra) for an appropriately chosen p-value threshold θ. We thus compute the FDR as the ratio of the number of identified PSMs in the decoy and target proteomes:
Variable dereplication of PNPs via spectral networks
Ideally, each PNP family corresponds to a connected component in the spectral network. However, spurious edges in spectral networks often connect unrelated spectra from different PNP families making it difficult to perform variable dereplication. To minimize the number of spurious edges, DEREPLICATOR uses a stringent threshold for defining spectral pairs (edges in the spectral network).
DEREPLICATOR constructs the spectral network of a spectral dataset and finds connected components in this network (Supplementary Fig. 2). We refer to a connected component in a spectral network as a PNP component if one of the spectra (nodes) in this component was identified as a statistically significant PSM. We further use such PSMs to perform the variable dereplication of all spectra in the PNP component.25 For each PNP derived via variable dereplication, we use MS-DPR to compute its p-value. The variable dereplication is accepted if the resulting p-value does not exceed the threshold θ.
Characteristic shifts in spectral networks
Supplementary Fig. 2 illustrates that many edges in the PNP components correspond to the mass shift 14 Da (7 Da for doubly charged ions). Nodes separated by the mass shift 14 Da is a common feature of molecular networks that often reveals new variants of known compounds29 (e.g., mutations of Val into Ile). This and other common shifts reveal analogs with amino acid substitutions, truncations (in the case of branch cyclic peptides), hydrolysis products, different sized lipid side chains, glycosylation, methylation, and other variant PNPs.29
For example, the mass shift 14 Da is a characteristic feature of the kurstakin family (and many other PNP families) because it connects some known variants of kurstakins (Supplementary Fig. 2). Thus, since the kurstakin 4 is connected by the 14 Da shift to a node with mass 920.519 in the spectral network, this node likely represents a still unknown variant of kurstakin. Indeed, since spurious edges in the connected component have spurious mass shifts, it is extremely unlikely that such spurious edges will have mass shifts characteristic for a specific PNP family, The node with mass 934.589 (with the mass shift 14 Da from the node with mass 920.519) may represent a yet another unknown variant of kurstakin.
Identification of short PNPs
In the first approximation, the FDR equals to the p-value threshold multiplied by the database size to account for multiple hypothesis testing.54 For example, in practice, to avoid false identifications, existing MS/MS database search pipelines often discard all PSMs formed by peptides shorter than 7 aa while searching bacterial proteomes. It does not mean that identification of such peptides is impossible but rather means that researchers have no choice but to consider a few such identifications (to be within the given FDR) or relax the FDR beyond the traditional 1–3%. Our computational analysis illustrates that short PNPs are indeed difficult to identify via database search due to low information content resulting in high p-values.
To improve identification of short PNPs, we compared the characteristics of PSMs formed by short PNPs identified in AntiMarin with characteristics of PSM identified in the decoy database. This comparison revaled the striking difference: most PSM from short AntiMarin peptides originated from spectra with charge +1 and isotopic shift 0 Da, while most PSM from short decoy peptides originated from spectra with charge +2 and +3 and isotopic shifts +1 Da, and +2 Da. Thus, while the search for multicharged spectra and spectra with non-zero isotopic shifts makes sense for long peptides (it increases the number of identified PSMs at the expense of a modest increase in FDR), it is counter-productive for short PNPs (e.g., we do not expect short PNPs to result in spectra with isotopic shifts). We thus mofified DEREPLICATOR to limit analysis of PSMs formed by short PNPs to only spectra of charge +1 and isotopic shift 0 Da. After this change, most decoy PSMs formed by short PNPs disapeared (without significantly reducing the number of target PSM formed by short PNPs). As the result, at the FDR threshold of 15%, DEREPLICATOR identified 47, 36 and 110 compounds with 3, 4 and 5 bonds, respectively.
Experimental validation of PNPs
We performed SILAC experiments to validate some PNPs identified by DEREPLICATOR. S. albus J1074 and S. albus ATCC 21838 strains were cultured on ISP2, A1 and R5 agar medium (10 mL) with and without 1 mM of 13C6-labeled isoleucine for 6 days at 30 °C. Similar experiment was conducted for 13C6-labeled lysine. Mass spectra from resulting samples were acquired in positive ion mode over a mass range of 100–1500 m/z using a QExactive (Thermo Scientific) mass spectrometer with HESI-II probe source. (Supplementary Note).
Validation of surugamide A
The putative identification of surugamide A, annotated by the DEREPLICATOR in S. albus J1074 extract, was validated by comparison of the MS/MS spectrum and retention time with an authentic standard of surugamide A,45 analyzed in LC-MS/MS under the same analytical conditions. Furthermore, a comigration assay was performed to control any matrix effect, by spiking the extract of S. albus J1074 with the authentic standard of surugamide A. Supplementary Note describes the experimental details.
Revealing the biosynthetic gene cluster for surugamides
The NRP synthetase responsible for synthesizing surugamides remains unknown. Below we describe a method that combines peptidogenomics47 with DEREPLICATOR to point to the elusive NRP synthetase responsible for surugamide.
While DEREPLICATOR identified surugamide in multiple Streptomyces strains, only one of them (S. albus J1074) was assembled into a single scaffold (most other strains are split into over 100 contigs). However, the assembly was performed using a non-reproducible computational protocol making it difficult to estimate the number of miss assemblies. We thus faced the challenge of finding a surugamide-producing NRP synthetase in a genome with potential assembly errors.
While NRPS2predictor identified 36 adenylation domains in S. albus J1074, it is unclear which of them code for surugamide. To account for possible assembly artifacts, we focused on triples of consecutive adenylation domains in the genome and further added a constraint that the genomic distance between consecutive domains in a triple does not exceed 20 kb. For each of the 22 triples A1A2A3 of adenylation domains satisfying this constraint and for each of 8000 3-mers X1X2X3 of proteinogenic amino acids, we computed score(A1A2A3, X1X2X3) = score(A1, X1) + score(A2, X2) + score(A3, X3), where score(A, X) is the NRPS2predictor score of an adenylation domain A against an amino acid X (the percentage of matches between the 10-residue long specificity code of the adenylation domain A and the “ideal” specificity code of an amino acid X as defined by NRPS2predictor).
For each of 8000 3-mers X1X2X3, we find the triple of consecutive adenylation domains A1A2A3 (among 22 such triples) with maximum score resulting in the histogram shown in Supplementary Fig. 10. We further define the p-value of a 3-mer as the fraction of 3-mers (among 8000) with this or higher score. For example, the p-value of (Ile, Phe, Leu) is 164/8000=0.0205 since its score (250) has rank 164 among 8000 3-mers.
The amino acid sequences of surugamide A and surugamide B are IAIIKIFL and IAVIKIFL, respectively. Supplementary Fig. 10 revealed that, somewhat surprisingly, the p-values of all eight 3-mers forming IAIIKIFL are below the mean p-value 1/2 (similar result holds for IAVIKIFL). To quantify this statistical bias, we define the bias of a 3-mer as its p-value divided by 2 and the bias of a peptide as the product of biases of its 3-mers. The bias of IAIIKIFL is 7.4 · 10−7 while the bias of a random peptide is close to 1 implying that IAIIKIFL is likely to be coded by the adenylation domains in S. albus J1074 that generate the high scoring 3-mers shown by red bars in Supplementary Fig. 10. Further analysis revealed that these adenylation domains are clustered at the genomic location 2863086-2868922 of S. albus J1074.
Supplementary Material
Acknowledgments
We would like to thank Mingxun Wang and Nuno Bandeira for insightful suggestions on using molecular networking and spectral library search. We would like to thank Marnix Medema for guidelines on running antiSMASH. The work of HM, PD, and PAP was supported by the US National Institutes of Health grant 2-P41-GM103484. PD is supported by GM097509. AG, AM, and PAP were supported by Russian Science Foundation (grant 14-50-00069).
PAP has an equity interest in Digital Proteomics, LLC, a company that may potentially benefit from the research results. The terms of this arrangement have been reviewed and approved by the University of California, San Diego in accordance with its conflict of interest policies.
Footnotes
Author Contributions
H.M. and A.G. implemented DEREPLICATOR algorithm. H.M., A.G. and A.M. designed the web server. N.G. and L.N. collected and analyzed mass spectrometry data and conducted SILAC experiments. A.N. and K.T. purified standard surugamide. P.D. and P.A.P. designed and directed the work. H.M. and P.A.P. wrote the manuscript.
References
- 1.Li J, Vederas J. Drug discovery and natural products: end of an era or an endless frontier? Science. 2009;325:161–165. doi: 10.1126/science.1168243. [DOI] [PubMed] [Google Scholar]
- 2.Fischbach M, Walsh C. Antibiotics for emerging pathogens. Science. 2009;325:1089–93. doi: 10.1126/science.1176667. [DOI] [PMC free article] [PubMed] [Google Scholar]
- 3.Ling L, et al. A new antibiotic kills pathogens without detectable resistance. Nature. 2015;517:455–459. doi: 10.1038/nature14098. [DOI] [PMC free article] [PubMed] [Google Scholar]
- 4.Harvey A, Edrada-Ebel R, Quinn R. The re-emergence of natural products for drug discovery in the genomics era. Nat Rev Drug Discov. 2015;14:111–129. doi: 10.1038/nrd4510. [DOI] [PubMed] [Google Scholar]
- 5.Donia MS, Fischbach MA. Small molecules from the human microbiota. Science. 2015;349:1254766. doi: 10.1126/science.1254766. [DOI] [PMC free article] [PubMed] [Google Scholar]
- 6.Medema MH, Fischbach MA. Computational approaches to natural product discovery. Nat Chem Biol. 2015;11:639–648. doi: 10.1038/nchembio.1884. [DOI] [PMC free article] [PubMed] [Google Scholar]
- 7.Walsh CT. A chemocentric view of the natural product inventory. Nat Chem Biol. 2015;11:620–624. doi: 10.1038/nchembio.1894. [DOI] [PubMed] [Google Scholar]
- 8.Wang M, et al. Sharing and community curation of mass spectrometry data with Global Natural Products Social Molecular Networking. Nat Biotechnol. 2016;34:828–837. doi: 10.1038/nbt.3597. [DOI] [PMC free article] [PubMed] [Google Scholar]
- 9.Vaniya A, Fiehn O. Using fragmentation trees and mass spectral trees for identifying unknown compounds in metabolomics. Trends Analyt Chem. 2015;69:52–61. doi: 10.1016/j.trac.2015.04.002. [DOI] [PMC free article] [PubMed] [Google Scholar]
- 10.Mohimani H, Pevzner P. Dereplication, sequencing and identification of peptidic natural products: from genome mining to peptidogenomics to spectal networks. Nat Prod Rep. 2016;33:73–86. doi: 10.1039/c5np00050e. [DOI] [PMC free article] [PubMed] [Google Scholar]
- 11.Marahiel M, Stachelhaus T, Mootz H. Modular peptide synthetases involved in nonribosomal peptide synthesis. Nat Prod Rep. 1997;7:2651–2674. doi: 10.1021/cr960029e. [DOI] [PubMed] [Google Scholar]
- 12.Arnison P, et al. Ribosomally synthesized and post-translationally modified peptide natural products: Overview and recommendations for a universal nomenclature. Nat Prod Rep. 2013;30:108–160. doi: 10.1039/c2np20085f. [DOI] [PMC free article] [PubMed] [Google Scholar]
- 13.Mohimani H, et al. Automated genome mining of ribosomal peptide natural products. ACS Chem Biol. 2014;9:1545–1551. doi: 10.1021/cb500199h. [DOI] [PMC free article] [PubMed] [Google Scholar]
- 14.Smith C, et al. Metlin: a metabolite mass spectral database. Ther Drug Monit. 2005;6:747–51. doi: 10.1097/01.ftd.0000179845.53213.39. [DOI] [PubMed] [Google Scholar]
- 15.Yang J, et al. Molecular networking as a dereplication strategy. J Nat Prod. 2013;76:1686–99. doi: 10.1021/np400413s. [DOI] [PMC free article] [PubMed] [Google Scholar]
- 16.Balkovec JM, et al. Discovery and development of first in class antifungal caspofungin (cancidas R)–a case study. Nat Prod Rep. 2014;31:15–34. doi: 10.1039/c3np70070d. [DOI] [PubMed] [Google Scholar]
- 17.Blunt J, Munro M, Laatsch H. Antimarin database. University of Canterbury; Christchurch, New Zealand: University of Gottingen; Gottingen, Germany: 2007. [Google Scholar]
- 18.Eng J, McCormack A, Yates J. An approach to correlate tandem mass spectral data of peptides with amino acid sequences in a protein database. J Am Soc Mass Spectrom. 1994;5:976–989. doi: 10.1016/1044-0305(94)80016-2. [DOI] [PubMed] [Google Scholar]
- 19.Tsur D, Tanner S, Zandi E, Bafna V, Pevzner P. Identification of post-translational modifications via blind search of mass-spectra. Nat Biotechnol. 2005;23:1562–1567. doi: 10.1038/nbt1168. [DOI] [PubMed] [Google Scholar]
- 20.Ng J, et al. Dereplication and de novo sequencing of nonribosomal peptides. Nat Methods. 2009;6:596–599. doi: 10.1038/nmeth.1350. [DOI] [PMC free article] [PubMed] [Google Scholar]
- 21.Ibrahim A, et al. Dereplicating nonribosomal peptides using an informatic search algorithm for natural products (iSNAP) discovery. Proc Natl Acad Sci. 2012;109:19196–19201. doi: 10.1073/pnas.1206376109. [DOI] [PMC free article] [PubMed] [Google Scholar]
- 22.Bandeira N, Tsur D, Frank A, Pevzner P. Protein identification by spectral networks analysis. Proc Natl Acad Sci. 2007;104:6140–5. doi: 10.1073/pnas.0701130104. [DOI] [PMC free article] [PubMed] [Google Scholar]
- 23.Bandeira N. Spectral networks: a new approach to de novo discovery of protein sequences and posttranslational modifications. Biotechniques. 2007;42:687–691. doi: 10.2144/000112487. [DOI] [PubMed] [Google Scholar]
- 24.Watrous J, et al. Mass spectral molecular networking of living microbial colonies. Proc Natl Acad Sci. 2012;109:E1743–1752. doi: 10.1073/pnas.1203689109. [DOI] [PMC free article] [PubMed] [Google Scholar]
- 25.Mohimani H, et al. Multiplex de novo sequencing of peptide antibiotics. J Comput Biol. 2011;18:1371–1381. doi: 10.1089/cmb.2011.0158. [DOI] [PMC free article] [PubMed] [Google Scholar]
- 26.Govaerts C, et al. Sequencing of bacitracin a and related minor components by liquid chromatography/electrospray ionization ion trap tandem mass spectrometry. Rapid Commun Mass Spectrom. 2003;17:1366– 1379. doi: 10.1002/rcm.1058. [DOI] [PubMed] [Google Scholar]
- 27.Nutkins J, et al. Structure determination of tolaasin, an extracellular lipodepsipeptide produced by the mushroom pathogen, pseudomonas tolaasii paine. J Am Chem Soc. 1991;113:2621–2627. [Google Scholar]
- 28.Bassarello C, et al. Tolaasins a–e, five new lipodepsipeptides produced by pseudomonas tolaasii. J Nat Prod. 2004;67:811–6. doi: 10.1021/np0303557. [DOI] [PubMed] [Google Scholar]
- 29.Liu W, et al. Ms/ms-based networking and peptidogenomics guided genome mining revealed the stenothricin gene cluster in streptomyces roseosporus. J Antibiot. 2014;67:99–104. doi: 10.1038/ja.2013.99. [DOI] [PMC free article] [PubMed] [Google Scholar]
- 30.Gonzalez D, et al. Microbial competition between bacillus subtilis and staphylococcus aureus monitored by imaging mass spectrometry. Microbiology. 2011;157:2485–2492. doi: 10.1099/mic.0.048736-0. [DOI] [PMC free article] [PubMed] [Google Scholar]
- 31.Peypoux F, et al. Revised structure of mycosubtilin, a peptidolipid antibiotic from bacillus subtilis. J Antibiot. 1986;39:636–641. doi: 10.7164/antibiotics.39.636. [DOI] [PubMed] [Google Scholar]
- 32.Hasenbohler A, Kneifel H, Konig W, Zahner H, Zeiler H. Metabolic products of microorganisms. 134. stenothricin, a new inhibitor of the bacterial cell wall synthesis. Arch Microbiol. 1974;99:307–21. doi: 10.1007/BF00696245. [DOI] [PubMed] [Google Scholar]
- 33.Tsuge K, Ano T, Hirai M, Nakamura Y, Shoda M. The genes degq, pps, and lpa-8 (sfp) are responsible for conversion of bacillus subtilis 168 to plipastatin production. Antimicrob Agents Chemother. 1999;43:2183–92. doi: 10.1128/aac.43.9.2183. [DOI] [PMC free article] [PubMed] [Google Scholar]
- 34.Sheil M, Kilby G, Curtis J, Bradley C, Derrick P. Low-energy tandem mass spectra of the cyclic depipeptide valinomycin—a comparison with four-sector tandem mass spectra. Org Mass Spectrom. 2005;28:574– 576. [Google Scholar]
- 35.Bumpus S, Evans B, Thomas P, Ntai I, Kelleher N. A proteomics approach to discovery of natural products and their biosynthetic pathways. Nat Biotechnol. 2009;27:951–956. doi: 10.1038/nbt.1565. [DOI] [PMC free article] [PubMed] [Google Scholar]
- 36.Gerard J, et al. Massetolides a-h, antimycobacterial cyclic depsipeptides produced by two pseudomonads isolated from marine habitats. J Nat Prod. 1997;60:223–9. doi: 10.1021/np9606456. [DOI] [PubMed] [Google Scholar]
- 37.Reybroeck W, et al. Cyclic lipodepsipeptides produced by pseudomonas spp. naturally present in raw milk induce inhibitory effects on microbiological inhibitor assays for antibiotic residue screening. PLoS One. 2014;9:e98266. doi: 10.1371/journal.pone.0098266. [DOI] [PMC free article] [PubMed] [Google Scholar]
- 38.Hathout Y, Ho Y, Ryzhov V, Demirev P, Fenselau C. Kurstakins: a new class of lipopeptides isolated from bacillus thuringiensis. J Nat Prod. 2000;63:1492–6. doi: 10.1021/np000169q. [DOI] [PubMed] [Google Scholar]
- 39.Kim S, Pevzner P. MS-GF+ makes progress towards a universal database search tool for proteomics. Nat commun. 2014;5:5277–5286. doi: 10.1038/ncomms6277. [DOI] [PMC free article] [PubMed] [Google Scholar]
- 40.Duncan K, et al. Molecular networking and pattern-based genome mining improves discovery of biosynthetic gene clusters and their products from salinispora species. Chem Biol. 2015;22:460–471. doi: 10.1016/j.chembiol.2015.03.010. [DOI] [PMC free article] [PubMed] [Google Scholar]
- 41.Traxler M, Watrous J, Alexandrov T, Dorrestein P, Kolter R. Interspecies interactions stimulate diversification of the streptomyces coelicolor secreted metabolome. M Bio. 2013;4:e00459–13. doi: 10.1128/mBio.00459-13. [DOI] [PMC free article] [PubMed] [Google Scholar]
- 42.Penn K, Jensen P. Comparative genomics reveals evidence of marine adaptation in salinispora species. BMC Genom. 2012;13:86. doi: 10.1186/1471-2164-13-86. [DOI] [PMC free article] [PubMed] [Google Scholar]
- 43.Medema MH, et al. Minimum information about a biosynthetic gene cluster. Nat Chem Biol. 2015;11:625–631. doi: 10.1038/nchembio.1890. [DOI] [PMC free article] [PubMed] [Google Scholar]
- 44.Zaburannyi N, Rabyk M, Ostash B, Fedorenko V, Luzhetsky A. Insights into naturally minimised streptomyces albus j1074 genome. J Org Chem. 2014;15:97. doi: 10.1186/1471-2164-15-97. [DOI] [PMC free article] [PubMed] [Google Scholar]
- 45.Takada K, et al. Surugamides a-e, cyclic octapeptides with four d-amino acid residues, from a marine streptomyces sp. J Org Chem. 2013;78:6746–50. doi: 10.1021/jo400708u. [DOI] [PubMed] [Google Scholar]
- 46.Pesic A, et al. Champacyclin, a new cyclic octapeptide from streptomyces strain c42 isolated from the baltic sea. Mar Drugs. 2013;11:4834–4857. doi: 10.3390/md11124834. [DOI] [PMC free article] [PubMed] [Google Scholar]
- 47.Kersten R, et al. A mass spectrometry-guided genome mining approach for natural product peptidogenomics. Nat Chem Biol. 2011;7:794–802. doi: 10.1038/nchembio.684. [DOI] [PMC free article] [PubMed] [Google Scholar]
- 48.Bouslimani A, et al. Molecular cartography of the human skin surface in 3d. Proc Natl Acad Sci. 2015;112:E2120–2129. doi: 10.1073/pnas.1424409112. [DOI] [PMC free article] [PubMed] [Google Scholar]
- 49.de Silva R, Dorrestein P, Quinn R. Illuminating the dark matter in metabolomics. Proc Natl Acad Sci. 2015;112:12549–50. doi: 10.1073/pnas.1516878112. [DOI] [PMC free article] [PubMed] [Google Scholar]
- 50.Mohimani H, Kim S, Pevzner P. A new approach to evaluating statistical significance of spectral identifications. J Proteome Res. 2013;12:1560–1568. doi: 10.1021/pr300453t. [DOI] [PMC free article] [PubMed] [Google Scholar]
- 51.Frank A. A predicting intensity ranks of peptide fragment ions. J Proteome Res. 2009;8:2226–2240. doi: 10.1021/pr800677f. [DOI] [PMC free article] [PubMed] [Google Scholar]
- 52.Frank A, Pevzner P. Pepnovo: De novo peptide sequencing via probabilistic network modeling. Anal Chem. 2005;77:964–983. doi: 10.1021/ac048788h. [DOI] [PubMed] [Google Scholar]
- 53.Frank A. A ranking-based scoring function for peptide-spectrum matches. J Proteome Res. 2009;8:2241–2252. doi: 10.1021/pr800678b. [DOI] [PMC free article] [PubMed] [Google Scholar]
- 54.Gupta N, Bandeira N, Keich U, Pevzner P. Target-decoy approach and false discovery rate: when things may go wrong. J Am Soc Mass Spectrom. 2011;22:1111–1120. doi: 10.1007/s13361-011-0139-3. [DOI] [PMC free article] [PubMed] [Google Scholar]
- 55.Kim S, Gupta N, Pevzner P. Spectral probabilities and generating functions of tandem mass spectra: A strike against decoy databases. J Proteome Res. 2008;7:3354–3363. doi: 10.1021/pr8001244. [DOI] [PMC free article] [PubMed] [Google Scholar]
- 56.Kahn H, Harris T. Estimation of particle transmission by random sampling. National Bureau of Standards Applied Mathematics. 1951;12:27–30. [Google Scholar]
- 57.Elias J, Gygi S. Target-decoy search strategy for increased confidence in large-scale protein identifications by mass spectrometry. Nat Methods. 2007;4:207–214. doi: 10.1038/nmeth1019. [DOI] [PubMed] [Google Scholar]
Associated Data
This section collects any data citations, data availability statements, or supplementary materials included in this article.