Abstract
Spinal muscular atrophy (SMA) is caused by mutations or deletions in the Survival Motor Neuron 1 (SMN1) gene in humans. Modifiers of the SMA symptoms have been identified and genetic background has a substantial effect in the phenotype and survival of the severe mouse model of SMA. Previously, we generated the less severe Smn2B/- mice on a mixed genetic background. To assess the phenotype of Smn deficiency on a pure genetic background, we produced Smn2B/2B congenic mice on either the C57BL/6 (BL6) or FVB strain background and characterized them at the 6th generation by breeding to Smn+/- mice. Smn2B/- mice from these crosses were evaluated for growth, survival, muscle atrophy, motor neuron loss, motor behaviour, and neuromuscular junction pathology. FVB Smn2B/- mice had a shorter life span than BL6 Smn2B/- mice (median of 19 days vs. 25 days). Similarly, all other defects assessed occurred at earlier stages in FVB Smn2B/-mice when compared to BL6 Smn2B/-mice. However, there were no differences in Smn protein levels in the spinal cords of these mice. Interestingly, levels of Plastin 3, a putative modifier of SMA, were significantly induced in spinal cords of BL6 Smn2B/- mice but not of FVB Smn2B/-mice. Our studies demonstrate that the phenotype in Smn2B/-mice is more severe in the FVB background than in the BL6 background, which could potentially be explained by the differential induction of genetic modifiers.
Introduction
Spinal muscular atrophy (SMA) is a genetic neuromuscular disorder caused by mutations or deletions of the Survival Motor Neuron 1 (SMN1) gene (1). In humans, an almost identical copy of SMN1 exists, referred to as SMN2. Based on the time of onset and the severity of the phenotype, SMA is classified into four types. Type 1 SMA is the most severe form and accounts for more than 50% of cases. It occurs in young infants before the age of six months and presents with a progressive, symmetrical skeletal muscle weakness and atrophy, and leads to death before the age of two (2). Autopsy of these patients reveals severe myofibre atrophy and motor neuron loss within the spinal cord (3).
The effect of genetic background in the severity of neuromuscular disorders (NMDs) has been shown in several animal studies. Mouse models for Amyotrophic Lateral Sclerosis (ALS), Duchenne muscular dystrophy, and SMA when backcrossed into different inbred mouse strain backgrounds showed a different time of onset, severity and survival (4–9). Also, in several cases of familial forms of NMDs, the siblings with the same causative genetic mutations showed wide discrepancies in the severity of the clinical symptoms. For example, siblings with the same mutations in the human superoxide dismutase 1 (hSOD1) gene present with substantial disparity in the time of onset and severity of ALS symptoms (10). In some rare cases, the siblings of the affected patient did not develop ALS despite the presence of the same hSOD1 mutation. These effects are attributed to the presence of modifier genes (11).
In SMA, the copy number of the SMN2 gene varies among individuals making it an important modifier of the disease symptoms. Most type I SMA patients carry only two SMN2 copies, while patients with type II SMA usually have three, type III four and type IV five to six copies of the SMN2 gene (12,13). Other genes have also been proposed as modifiers of SMA. In a rare case, siblings with an identical SMN1/SMN2 genotype showed an extreme difference in SMA symptom presentation ranging from affected to unaffected (14). Further characterization of the transcriptome of these individuals identified Plastin 3 (PLS3) as a putative SMA modifier gene (14). Pls3 is an actin binding protein and contributes to the stabilization of actin bundles (15). Overexpression of Pls3 rescued the defects of neurite outgrowth in cultured SMA motor neurons (14). However, subsequent studies have reported mixed results regarding the benefits of Pls3 expression in different mouse models of SMA (16,17). Other actin modulators could also serve as modifiers of SMA. Dysregulation of upstream signalling pathways important for the regulation of the actin cytoskeleton in Smn depleted neuronal cells and tissues has previously been reported (18–21). Indeed, Rho kinase activity is increased and leads to differential phosphorylation of its downstream targets (18). The pharmacological inhibition of Rho kinase resulted in a longer life span, increased myofibre size and improved neuromuscular junction (NMJ) morphology in a mouse model of SMA (20,21).
Several mouse models of SMA have been generated (reviewed in (22)). One common strategy is deleting the mouse Smn gene while introducing the human SMN2 gene (and/or its variants) into the mouse genome. The Smn-/-;SMN2 mouse (also known as the “severe model”) and Smn-/-;SMN2;SMNΔ7 (also known as the “delta 7 model”) are two models generated using this strategy (5,6). They recapitulate a severe SMA-like phenotype in mice. In a separate model, known as the “Taiwanese model”, the severe phenotype is also recapitulated (23).
We have previously generated a new allele of mouse Smn (called Smn2B) by mutating a splicing enhancer element within exon 7 of the mouse Smn gene (21,24–26). The majority of the transcripts from the Smn2B allele lack exon 7, however low levels of full length Smn protein are produced. The initial characterization of Smn2B/- mice in a hybrid BL6 x CD1 background revealed that these mice recapitulate an SMA phenotype including muscle weakness and atrophy, loss of lower motor neurons, and pathologic changes within the NMJs (20,21,26). The median survival in these mice was 28 days. However, a small number (about 10%) managed to survive more than 100 days (18,20,21,26).
Here, we have generated congenic Smn2B/- mouse lines by backcrossing the Smn2B allele onto two different mouse genetic backgrounds, BL6 and FVB. Using several behavioural and histological tests, we characterized these mice at the 6th generation of the backcross. These mice showed a more severe and less variable SMA phenotype than the mixed background Smn2B/- mice. We also showed that congenic Smn2B/- mice on the FVB background have a more severe phenotype than on the BL6 background. Interestingly, the level of Pls3 protein was significantly induced in spinal cords of BL6 Smn2B/- mice but not of FVB Smn2B/-mice. Overall, our work demonstrates that genetic background is an important determinant of disease severity in SMA model mice, potentially through the differential regulation of modifier genes.
Results
BL6 Smn2B/- mice have a longer life span than FVB Smn2B/- mice
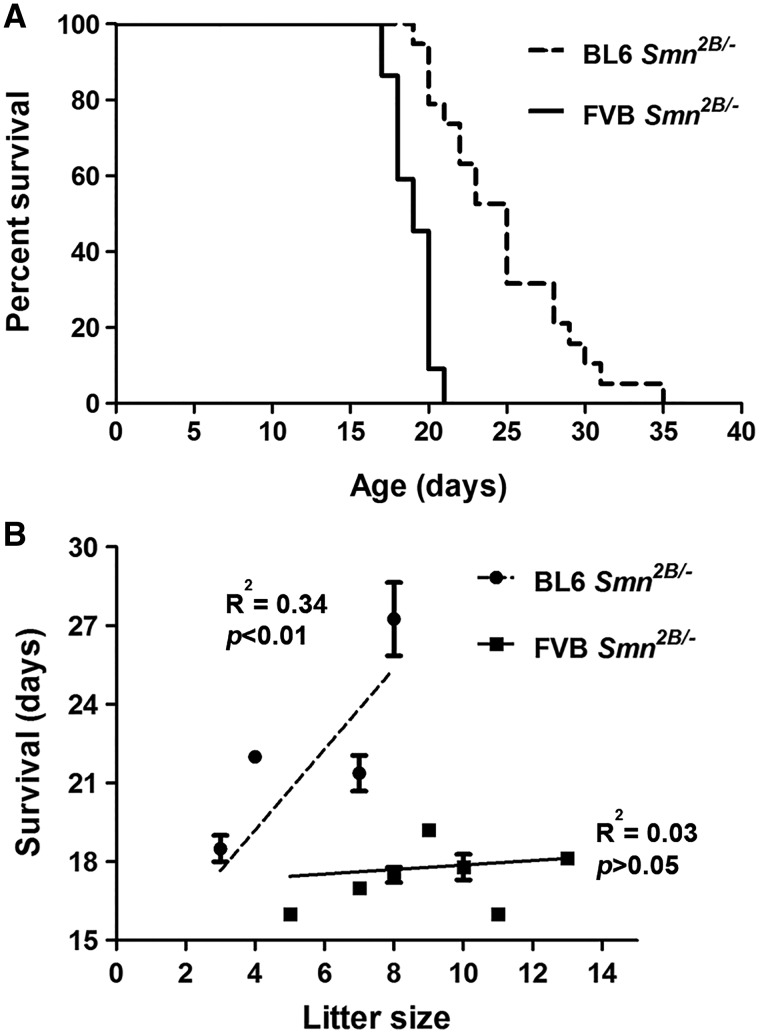
Previously, we showed that Smn2B/- mice in a mixed background recapitulate an SMA-like phenotype, with a median survival of 28 days while a small fraction (about 10%) survive for more than 100 days (20,21,26). Here, we assessed the survival of congenic Smn2B/- mice in either BL6 or FVB backgrounds. For this study, we set up breeder cages and mated congenic Smn2B/2B mice (from the 6th generation of backcrossing) to congenic Smn+/- mice of the same relevant background. We monitored the offspring on a daily basis for survival and weight. The mice that did not show any phenotype after postnatal day (PND) 21 were genotyped to rule out the presence of any Smn2B/- mice within this group. Kaplan-Meier analysis revealed that BL6 Smn2B/- mice had a median survival of 25 days (range of 19–35 days, n = 19) and FVB Smn2B/- mice had a median survival of 19 days (range of 17 to 21 days, n = 22) (Fig. 1A) . There was a significant difference in survival between BL6 Smn2B/- and FVB Smn2B/- mice (Gehan-Breslow-Wilcoxon Test, P < 0.0001).
Figure 1.
BL6 Smn2B/-mice have a longer life span than FVB Smn2B/-mice. (A) Kaplan-Meier survival curve showing that BL6 Smn2B/-mice have a median survival of 25 days (n = 19) while FVB Smn2B/- mice have a median survival of 19 days (n = 22). The difference in survival was significant between the two strains (Gehan-Breslow-Wilcoxon Test, P < 0.0001). No death was observed in control littermates (not shown). (B) The shorter life span of FVB Smn2B/-mice is not due to larger litter sizes in this strain. In the FVB strain (solid line), there was no correlation between the size of the litters and survival of Smn2B/- mice (Goodness of Fit test, R2 = 0.03 P > 0.05). Interestingly, the bigger litter size in the BL6 strain (dashed line) correlated with longer survival of Smn2B/- mice (Goodness of Fit test, R2 = 0.34 P < 0.01).
Since breeding cages with FVB background had larger litter sizes (average of 9.1 ± 2.4 pups for FVB vs. 6.2 ± 2.1 pups for BL6, P < 0.05), we tested whether this correlated with the shortest life span in the FVB background. We plotted the survival of each Smn2B/- mouse versus the size of the correspondent litter (Fig. 1B). As shown, there was no correlation between litter size and the length of survival for Smn2B/- mice in the FVB background (R2= 0.03055, P > 0.05). To our surprise, within the BL6 Smn2B/- mice, there was a positive correlation between litter size and increased survival (R2= 0.3419, P < 0.01).
FVB Smn2B/- mice lose weight more rapidly than BL6 Smn2B/- mice
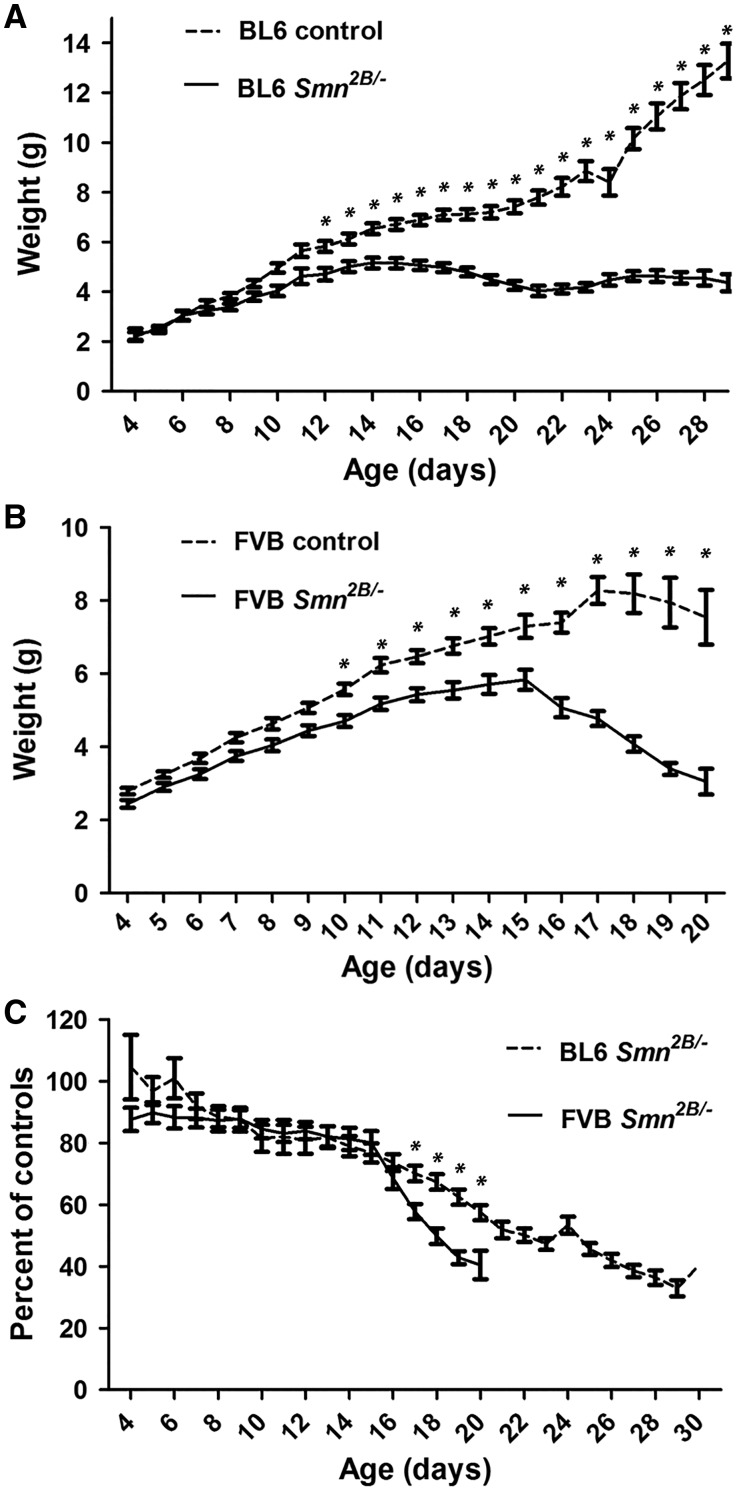
Starting on day three after birth, body weights for mice were measured on a daily basis. The average weight of Smn2B/- mice is significantly lower than control mice after PND11 for FVB and after PND12 for BL6 (two way ANOVA, P < 0.05) (Fig. 2A and B). After PND15 the average weight of Smn2B/- mice starts to decrease in both backgrounds. To investigate if the rate of weight loss is different between the two backgrounds, we calculated the weight of each Smn2B/- mouse at each time point as a percentage of the average weight of the relevant control mice at that time point (Fig. 2C). Beginning at PND16, FVB Smn2B/- mice lost weight continuously and reached 50% of the average weight of controls at PND18. By comparison, the weight loss rate is lower for BL6 Smn2B/- mice, which reached 50% of the average weight of controls at PND22.
Figure 2.
FVB Smn2B/- mice lose weight more rapidly than BL6 Smn2B/-mice. (A and B) Analysis of daily weights showed that Smn2B/-mice are smaller than their control littermates after PND12 in the BL6 background (n = 19) (A), and after PND10 in the FVB background (n = 22) (B), (two way ANOVA, P < 0.05). (C) Comparing daily weights of BL6 and FVB Smn2B/-mice (represented as a percentage of the average of the weight of the control littermates) showed that after PND15, FVB Smn2B/-mice lose weight at a faster pace than BL6 Smn2B/-mice (two way ANOVA, P < 0.05). * indicates significant difference between Smn2B/-mice and their control littermates in A and B, and between BL6 and FVB Smn2B/-mice in C.
Muscle strength is reduced earlier in FVB Smn2B/- mice than in BL6 Smn2B/- mice
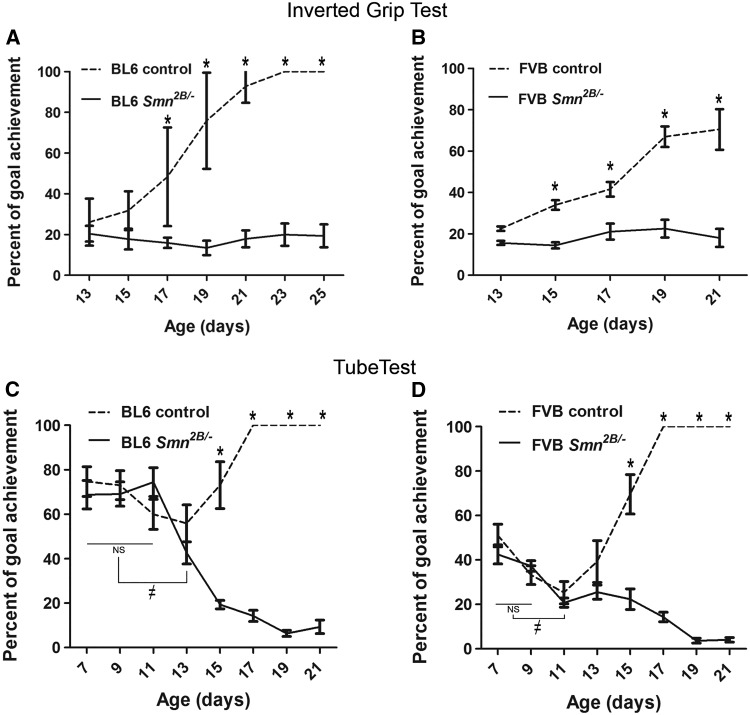
Progressive muscle weakness and atrophy are clinical hallmarks of SMA (2). In SMA model mice, muscle strength is also reduced early in the course of the disease (27). To evaluate the muscle strength in Smn2B/- mice, we used two standard motor tests recommended by Treat-NMD: “inverted mesh grip test” and “hind limb suspension test” (28,29). The inverted mesh grip test evaluates the strength of all mouse limbs by suspending the animal from an inverted mesh. We found that PND13 is the first time that pups are able to suspend from the inverted mesh (data not shown). After PND13, the average latency to fall for BL6 control mice was increased continuously and reached 100% of the goal (i.e. 60 sec) at PND23 (repeated measures ANOVA, P < 0.05) (Fig. 3A). This trend was also the same for FVB control mice however the test was only performed until P21 (70% of the goal) due to the lower maximum survival of FVB Smn2B/- mice (Fig. 3B). The latency to fall for Smn2B/- mice in both backgrounds was not significantly different relative to controls at PND13 (repeated measures ANOVA, P > 0.05). However, the difference in hang time between Smn2B/- mice and their control littermates did reach significance at PND17 for the BL6 background and at PND15 in the FVB background (two way ANOVA, P < 0.05) (Fig. 3A and B).
Figure 3.
Muscle weakness occurs at earlier ages in FVB Smn2B/-mice than in BL6 Smn2B/-mice. (A and B) Analysis of the results from inverted mesh grip tests showing that Smn2B/-mice had a shorter latency to fall than their control littermates after PND17 in BL6 Smn2B/-mice (A) and after PND15 in FVB Smn2B/-mice (B), (two way ANOVA, P < 0.05). There were no significant changes in latency to fall times of Smn2B/-mice (solid lines) of both strains during the test period (repeated measures ANOVA, P > 0.05). (C and D) Analysis of hind limb suspension test (also known as tube test) revealed that Smn2B/-mice suspended from their hind limbs had a shorter latency than their control littermates after PND15 in both strains. The latency to fall time of FVB Smn2B/-mice was significantly shorter at PND11 than earlier ages (D, ≠ on the solid line). In BL6 Smn2B/-mice the latency to fall time was shorter at PND13 than earlier ages (C, ≠ on the solid line) (repeated measures ANOVA, P <0.05). The goal was set as 60 s for the inverted grip test (A and B), and as 60 s or climbing out of the tube for the tube test (C and D). * indicates significant difference between Smn2B/-mice and their control littermates.
In the hind limb suspension test (also known as the tube test), the average time to fall for both BL6 and FVB control mice was unchanged until PND13 (repeated measures ANOVA, P > 0.05) and then increased at PND15 and reached 100% of the goal (60 sec) at PND17 (repeated measures ANOVA, P < 0.05) (Fig. 3C and D). By comparison, hanging time started to decrease significantly at PND13 for BL6 Smn2B/- mice and at PND11 for FVB Smn2B/- mice (repeated measures ANOVA, P < 0.05) (Fig. 3C and D). The difference between Smn2B/- mice and their control littermates was significant at PND15 for both BL6 and FVB lines (two way ANOVA, P < 0.05). Thus, collectively these results indicate that muscle weakness occurs at an earlier age in FVB than in BL6 Smn2B/- mice.
Muscle fibre cross-sectional area is reduced earlier in FVB Smn2B/- mice than in BL6 Smn2B/- mice
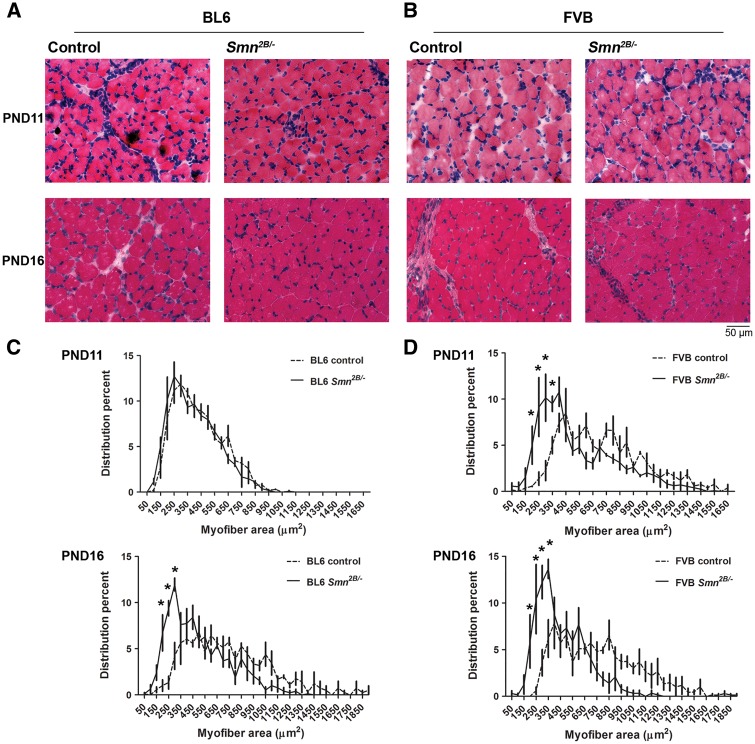
Previously we showed that average myofibre area is remarkably reduced in the mixed background Smn2B/- mice at PND21 (20,21). Here, we investigated myofibre calibre in the tibialis anterior (TA) skeletal muscle at earlier time points in the congenic Smn2B/- mice (Fig. 4). The fraction of small myofibres (200–350 µm2) was not increased in BL6 Smn2B/- mice at PND11 (two way ANOVA, P > 0.05) but is significantly higher at PND16 compared to the control littermates (two way ANOVA, P < 0.05) (Fig. 4C). In contrast, the fraction of small myofibres was significantly increased in FVB Smn2B/- mice at both PND11 and PND16 relative to control pups (two way ANOVA, P < 0.05) (Fig. 4C). We have further analysed the average myofibre cross-sectional area and found that it is reduced significantly at PND11 in FVB Smn2B/- mice and continues to be smaller at PND16 (Mann Whitney test, P < 0.05) (Table 1). In BL6 Smn2B/- mice however, the average myofibre area is not decreased at PND11 but reduced significantly at PND16 (Mann Whitney test, P < 0.05). We also found that at PND16 myofibre atrophy is more severe in FVB than BL6 Smn2B/- mice (54.6 ± 16.8% vs. 72.4 ± 18.42% of the average of myofibre areas of controls, respectively, P < 0.05).
Figure 4.
Muscle fibre cross-sectional area is reduced earlier in FVB Smn2B/-mice than in BL6 Smn2B/-mice. (A and B) Representative images of H&E stained TA muscles from BL6 mice (A) and FVB mice (B) at PND11 and PND16. (C and D) Quantification and analysis of myofibre cross-sectional areas showed that at PND11 there was no difference in the distribution of myofibres of BL6 Smn2B/-mice (n = 3, two way ANOVA, P > 0.05). However, at PND11 there is a higher percentage of small caliber myofibres in FVB Smn2B/-mice compared to their control littermates, and at PND16, the fractions of smaller myofibres are significantly higher in both BL6 and FVB Smn2B/-mice (n = 3, two way ANOVA, P < 0.05). * indicates significant difference between Smn2B/-mice and their control littermates.
Table 1.
Muscle fibre cross-sectional area is reduced earlier in FVB Smn2B/- mice than in BL6 Smn2B/- mice. Table shows the average myofibre cross-sectional areas in TA muscles at PND11 and PND16. At PND11 the average myofibre area was significantly reduced in FVB but not in BL6 Smn2B/-mice. At PND16 both BL6 and FVB showed smaller myofibre cross-sectional areas (n = 3, Mann Whitney Test)
| PND11 | Myofibre area | PND16 | Myofibre area | |||
|---|---|---|---|---|---|---|
| FVB | Smn2B/- | 509.7±139.2 µm2 | P<0.0001 | Smn2B/- | 389.9±120 µm2 | P<0.0001 |
| control | 692±155.9 µm2 | control | 714.2±137 µm2 | |||
| BL6 | Smn2B/- | 350±174.8 µm2 | P>0.05 | Smn2B/- | 481.8±122.5 µm2 | P<0.0001 |
| control | 381.1±180.4 µm2 | control | 665.2±154.8 µm2 |
We further investigated myofibre atrophy at an earlier age (PND9) in FVB Smn2B/- mice (Supplementary Material, Fig. 1) to study a pre-phenotypic time point. Although the fraction of small myofibres (250 µm2) was slightly increased (Supplementary Material, Fig. 1B), the average myofibre cross-sectional area was not significantly different from the control littermates (Mann Whitney test, P > 0.05). (Supplementary Material, Fig. 1C). This might indicate that PND9 is an early stage of myofibre atrophy in FVB Smn2B/- mice.
Motor neuron loss happens earlier in FVB Smn2B/- mice than in BL6 Smn2B/- mice
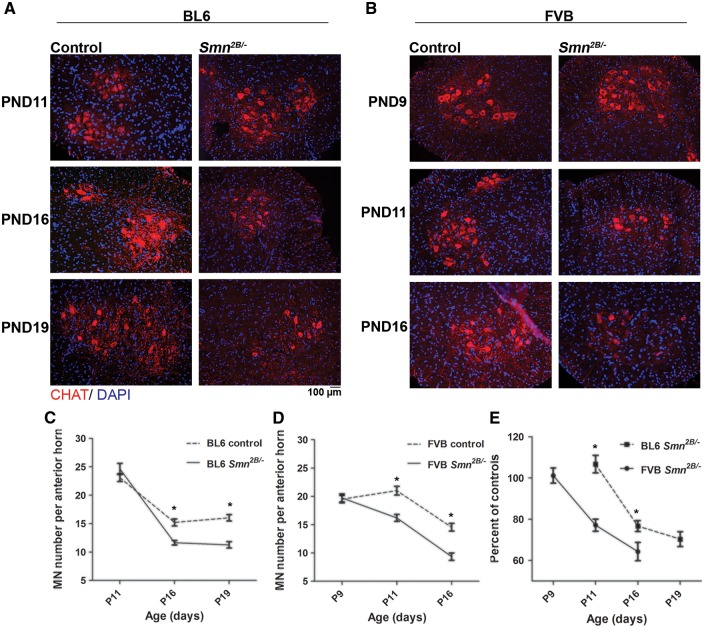
We investigated motor neuron (MN) loss in lumbar spinal cords of congenic Smn2B/- mice by choline acetyltransferase (ChAT) immunostaining (Fig. 5). We counted MN cell bodies in spinal cord sections from the Smn2B/- mice at different time points. At PND11 there is no difference in the number of motor neurons (MNs) between BL6 Smn2B/- mice and their control littermates (Fig. 5A and C). At PND16 and PND19 however, a decrease in the number of MNs in BL6 Smn2B/- mice was observed when compared to control littermates (Fig. 5A and C). Since muscle atrophy began earlier in FVB Smn2B/- mice, we counted the number of MNs in these mice at earlier time points. There was no decrease in the number of MNs at PND9 (Fig. 5B and D). However, at PND11 and PND16, the number of MNs was reduced in FVB Smn2B/- mice compared to control littermates (Fig. 5B and D). To compare the pattern of MN loss between FVB and BL6 Smn2B/- mice, we calculated the fraction of MNs in these mice as a percentage of the average MN number of their corresponding control littermates. Although the rate of MN loss was similar in both backgrounds, this pathology began at least two days earlier in FVB Smn2B/- mice (Fig. 5E).
Figure 5.
Motor neuron loss occurs at an earlier age in FVB Smn2B/-mice than in BL6 Smn2B/-mice. (A and B) Representative immunofluorescent images of the anterior horn regions of spinal cords from BL6 mice (A) at PND11, PND16 and PND19, and FVB mice (B) at PND9, PND11 and PND16 (red is ChAT staining and blue is DAPI staining).( C) No motor neuron loss was observed in lumbar spinal cords of BL6 Smn2B/-mice at PND11. However, at PND16 and PND19 the number of motor neurons was significantly decreased in BL6 Smn2B/-mice compared to their control littermates (n = 3, two way ANOVA, P < 0.05). (D) Motor neuron loss was not observed at PND9 in FVB Smn2B/-mice. However the number of motor neurons was significantly decreased in FVB Smn2B/-mice at PND11 and PND16, compared to their control littermates (n = 3, two way ANOVA, P < 0.05). (E) The graph represents the number of motor neurons in sections from Smn2B/-mice as a percentage of the average number of motor neurons in sections from control mice for each time point. Motor neuron loss occurs earlier in FVB Smn2B/-mice than in BL6 Smn2B/-mice. * indicates significant difference between Smn2B/-mice and their control littermates in C and D, and between BL6 and FVB Smn2B/-mice in E.
Neuromuscular junction pathology occurs at an earlier age in FVB Smn2B/- mice than in BL6 Smn2B/- mice
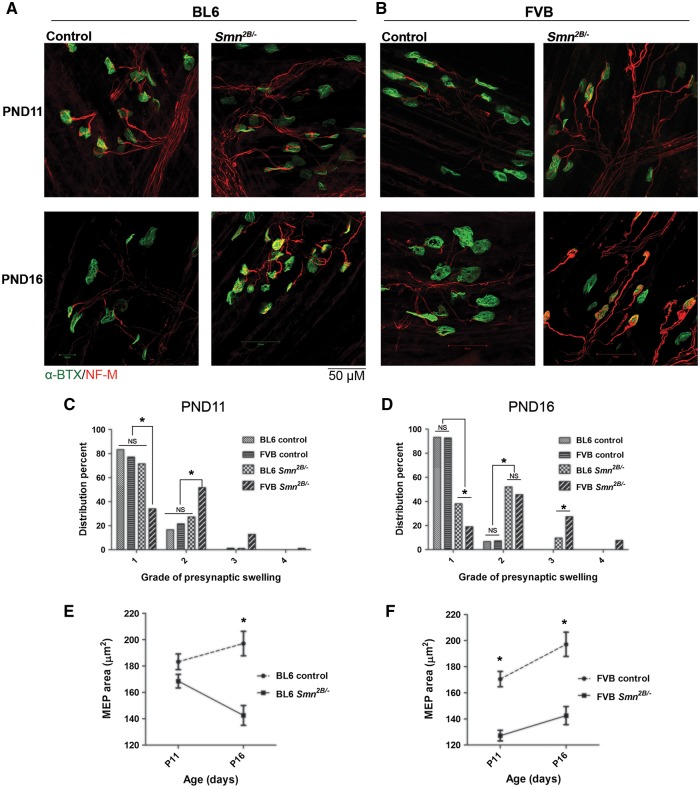
NMJs are the primary sites of pathologic changes in SMA (30–32). These changes include pre-synaptic swelling due to accumulation of neurofilaments and reduced size of motor endplates (MEPs). Previous work has shown that NMJs undergo these changes prior to any obvious phenotype in SMA model mice. To investigate pre-synaptic swelling, mouse transverse abdominis (TVA) muscles were immunostained for neurofilament (NF-M) and synaptic vesicle 2 (SV2) (Fig. 6A and B). We used an established classification system for the severity of NMJ pre-synaptic swelling based on morphology (grade 1: normal, no pre-synaptic swelling; grade 2: swollen, pre-synaptic terminal arborization is thickened; grade 3: spheroid accumulations over the NMJ; grade 4: spheroid covers MEPs). At PND11, only FVB Smn2B/- mice show NMJ presynaptic swelling (Fig. 6C). At PND16, both BL6 and FVB Smn2B/- mice show NMJ pre-synaptic swelling (Fig. 6D). Interestingly, at this age FVB Smn2B/- mice show higher degrees of NMJ pre-synaptic swelling, reaching grade 4, relative to BL6 Smn2B/- mice that have only progressed to grade 3 (Fig. 6D).
Figure 6.
NMJ pathology occurs earlier in FVB Smn2B/-mice than in BL6 Smn2B/-mice. (A and B) Representative images of TVA muscles from BL6 mice (A) and FVB mice (B) at PND11 and PND16 stained for neurofilament-M (red) and motor endplates (α-BTX, green). (C) At PND11, only FVB Smn2B/-mice show accumulation of neurofilaments within their NMJs (showing higher degrees of presynaptic swelling). (D) At PND16, both BL6 and FVB Smn2B/-mice show accumulation of neurofilaments within presynaptic areas of their NMJs, however the degree of presynaptic swellings is higher in FVB Smn2B/-mice (n = 3, two way ANOVA, P < 0.05). (E) Motor endplate size is significantly reduced in BL6 Smn2B/-mice at PND16 but not at PND11. (F) Motor endplate size is significantly reduced in FVB Smn2B/-mice at both PND11 and PND16 (n = 3, two way ANOVA, P < 0.05). * in E and F indicates significant difference between Smn2B/-mice and their control littermates.
We also investigated the post-synaptic NMJ abnormalities by labeling TVA muscles with a conjugated alpha-bungarotoxin and quantifying the size of the MEP areas at both PND11 and PND16. The average size of MEPs of BL6 Smn2B/- mice is not changed at PND11 (168.6 µm2 vs. 183.3 µm2 in controls, P > 0.05), but significantly decreased at PND16 (142.6 µm2 vs. 197.1 µm2 in controls, P < 0.01) (Fig. 6E). In contrast, the average size of MEPs is significantly decreased in FVB Smn2B/- mice at both PND11 and PND16 (127.2 µm2 vs. 170.5 µm2 at PND11 and 142.6 µm2 vs. 197.1 µm2 at PND16, P < 0.01 for both) (Fig. 6F).
We also looked at the NMJ morphology in FVB Smn2B/- mice at an earlier age (i.e. PND9) (Supplementary Material, Fig. 2). Although we did not find any difference in the average size of MEPs (Supplementary Material, Fig. 2B), we observed that FVB Smn2B/- mice show mild NMJ pre-synaptic swelling at PND9 (Supplementary Material, Fig. 2C).
Smn protein levels are not differentially regulated in BL6 vs. FVB Smn2B/- mice
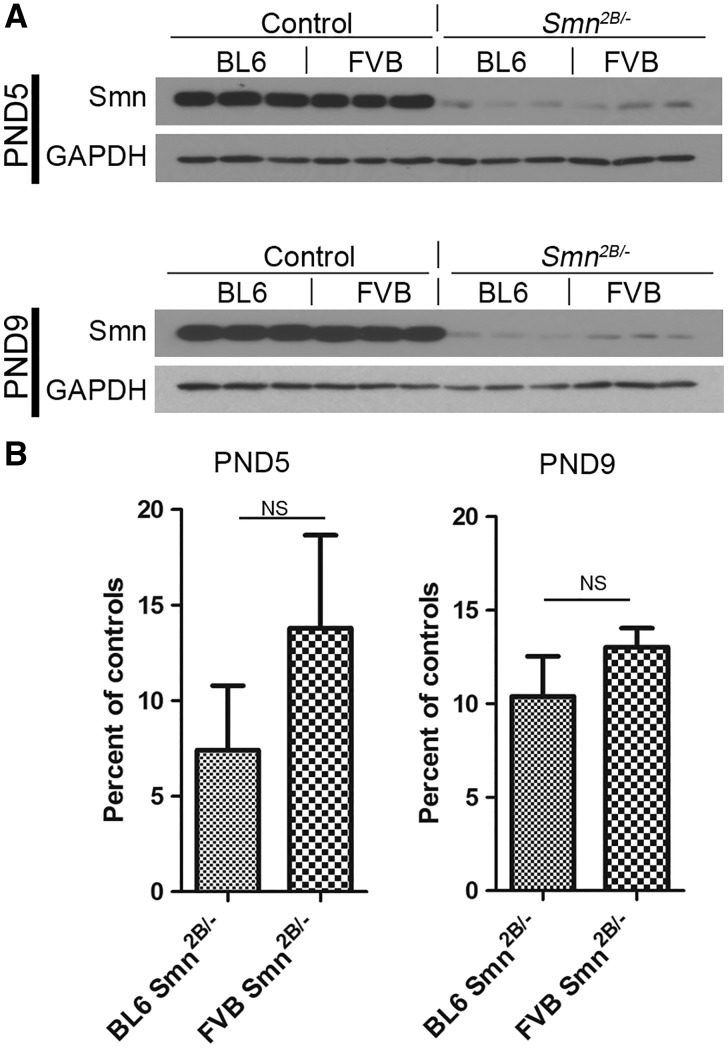
We evaluated the level of Smn protein in spinal cords at two different time points – PND5 and PND9. Total protein staining was used to normalize the immunoblot signals (data not shown). Our analysis revealed no significant difference in the level of Smn between FVB and BL6 Smn2B/- mice at both PND5 (7.4 ± 3.4% vs. 13.8 ± 4.8% of their normal controls, P > 0.05) and at PND9 (13.0 ± 1.0% vs. 10.4 ± 2.1% of their normal controls, P > 0.05) (Fig. 7A and B). We also compared the expression of Smn between FVB Smn2B/- mice and FVB severe SMA mice (Supplementary Material, Fig. 3). At PND1 the level of Smn protein in spinal cords of FVB Smn2B/- mice is significantly higher than FVB severe SMA mice, confirming that the less severe phenotype in Smn2B/- mice is due to slightly higher Smn levels in these animals.
Figure 7.
Smn protein levels are not differentially regulated in BL6 vs. FVB Smn2B/-mice. (A) Immunoblot analysis of lumbar spinal cord extracts of PND5 and PND9 mice using antibodies against Smn and GAPDH. (B) Quantification revealed no difference in Smn protein between BL6 and FVB Smn2B/-mice (n = 3, unpaired t test, P > 0.05). NS = not significant.
Expression of some actin regulating proteins is altered in BL6 vs. FVB Smn2B/- mice
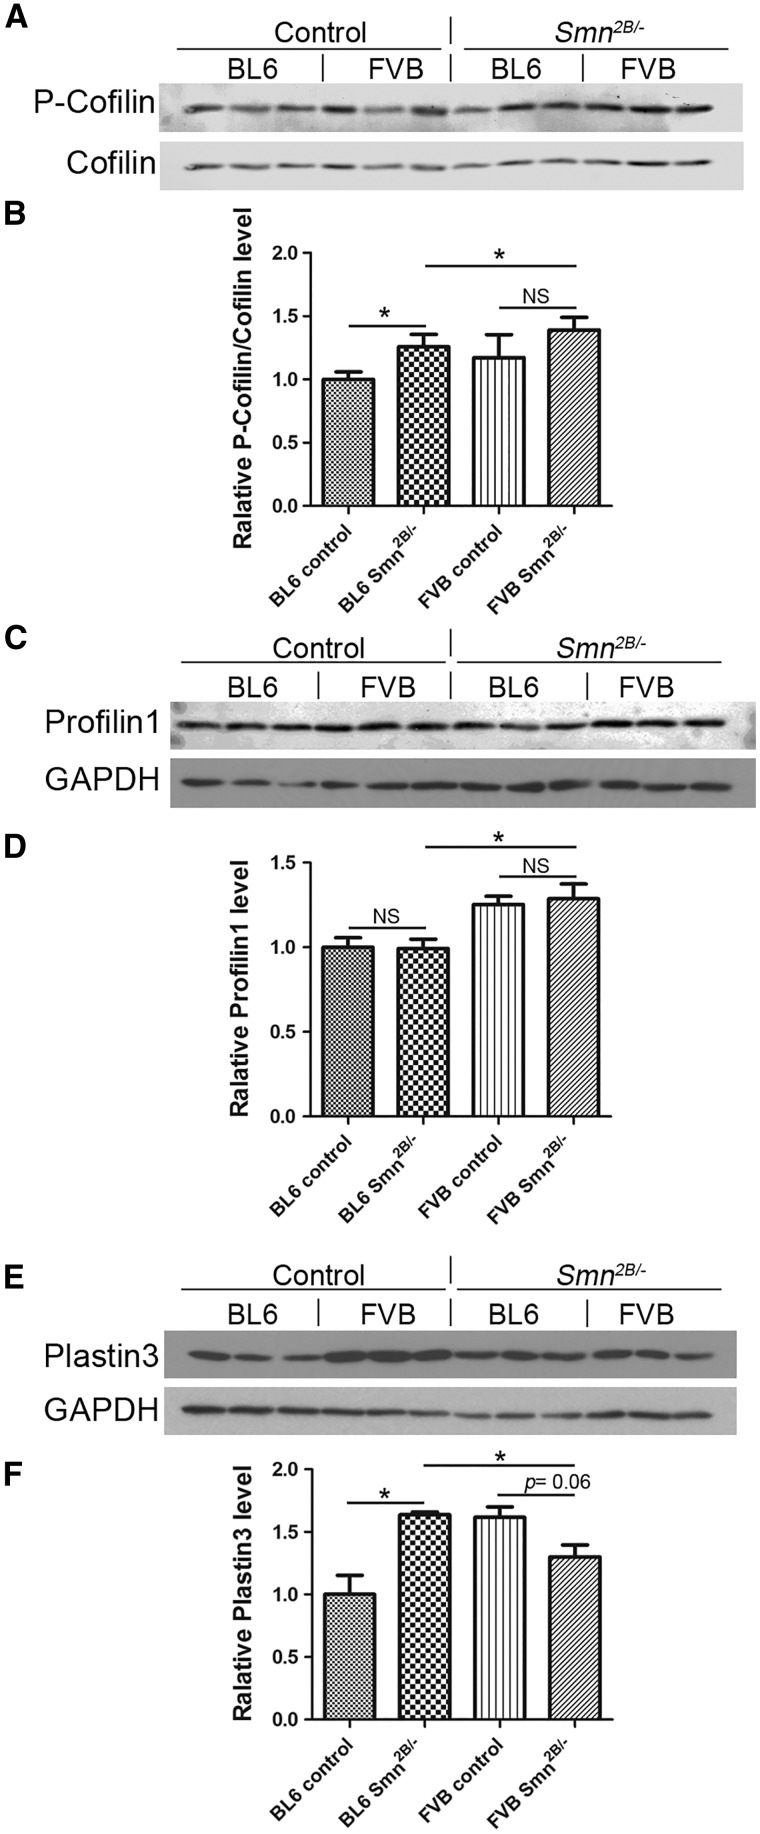
We evaluated the levels of three different proteins that are important in the regulation of the actin cytoskeleton and that could be involved in determining the severity of disease. To determine if there is any difference in expression in the Smn2B/- mice between the two congenic background strains, spinal cord extracts were collected at PND9 for immunoblot experiments. This time point was selected based on our observation that there was no MN loss in Smn2B/- mice on either background at this age. Initially, we assessed the activity of the Rho kinase pathway by measuring the ratio of phospho-cofilin (P-cofilin) to total cofilin protein levels. As expected, this pathway was more active in the Smn2B/- mice (Fig. 8A and B). However, this pathway did not appear to be differentially regulated between the two genetic strains tested, although a small increase was noted in the FVB Smn2B/- mice. Next, we assessed profilin 1, which inhibits the polymerization of actin. Although there was no difference in the level of profilin between wild type and Smn2B/- mice, there was an increase in FVB mice compared to BL6 (Fig. 8C and D). Finally, we assessed expression of Plastin 3, which has previously been identified as a putative SMA modifier gene in humans (14). At baseline, the levels of Pls3 were higher in FVB wild type mice than in BL6 wild type mice (Fig. 8E and F). Of interest, however, the level of Pls3 is significantly increased in BL6 Smn2B/- mice (+63.5 ± 15.7%, P < 0.05) but was slightly decreased in FVB Smn2B/- mice (-19.58 ± 7.910%, P = 0.06) compared to their respective wild type controls (Fig. 8E and F). A statistical comparison was also performed between BL6 Smn2B/- mice and FVB Smn2B/- mice, and we found lower levels of Pls3 in the latter strain background (Fig. 8E and F). Thus, there is a differential induction of Pls3 in BL6 Smn2B/- mice.
Figure 8.
Differential expression of some actin regulating proteins in BL6 vs. FVB Smn2B/-mice. Immunoblot analysis of lumbar spinal cord extracts of PND9 mice. (A and B) The ratio of phospho-cofilin (P-cofilin) to cofilin protein levels is increased in BL6 Smn2B/-mice compared to control mice (n = 3, unpaired t test, P < 0.05). However, there was no obvious differential regulation between the two genetic strains tested. (C and D) There is no difference in the level of profilin 1 between wild type and Smn2B/- mice. However, there is an increase in their levels in FVB mice compared to BL6 (n = 3, unpaired t test, P < 0.05). (E and F) Differential induction of plastin 3 in spinal cords of BL6 Smn2B/-mice. Plastin 3 levels are significantly higher in BL6 Smn2B/-mice comparing to their control wild types (n = 3, unpaired t test, P < 0.05). In FVB Smn2B/-mice however, the level of plastin 3 was not altered (n = 3, unpaired t test, P = 0.06). * indicates significant difference. NS = not significant.
Discussion
The notion that genetic background can impact the phenotype of a mouse mutant is not new. Indeed, early observations made in spontaneous mutant mice have been supported by work in engineered and induced mutant mice (33). In the recent past, gene targeting studies in mice have identified phenotypic differences between strain backgrounds. Collectively, this effect of genetic background on phenotype has been explained by the differential expression of so-called modifier genes. Such genes do not have any obvious phenotype on their own, but can impact the functional consequence of specific genetic mutations. As such, having congenic mouse strains for the study of gene mutations provides us with several advantages. It affords us more reliable models with consistent phenotypes and has the potential to identify modifier loci. In this context, we have generated congenic mice on two separate backgrounds (BL6 and FVB) carrying the Smn2B allele. We have characterized congenic mice at the 6th generation and report that Smn2B/- mice on the FVB background had an earlier onset and a more severe phenotype compared to the BL6 background. The generation of congenic Smn2B/- mice also resulted in a much tighter range of survival than observed in the original mixed background Smn2B/- mice (21,26).
One confounding variable that we wanted to examine was the impact of litter size on survival. It is possible that the mutant pups in larger litters were not able to compete effectively with their normal littermates for breastfeeding, affecting their survival. Of the two congenic strains, the FVB mice consistently had larger litters. However, this did not correlate negatively with survival of Smn2B/- mice in these litters. Interestingly, survival of Smn2B/- mice in BL6 cages correlated positively with larger litter size. It appears that this feature is also strain dependent.
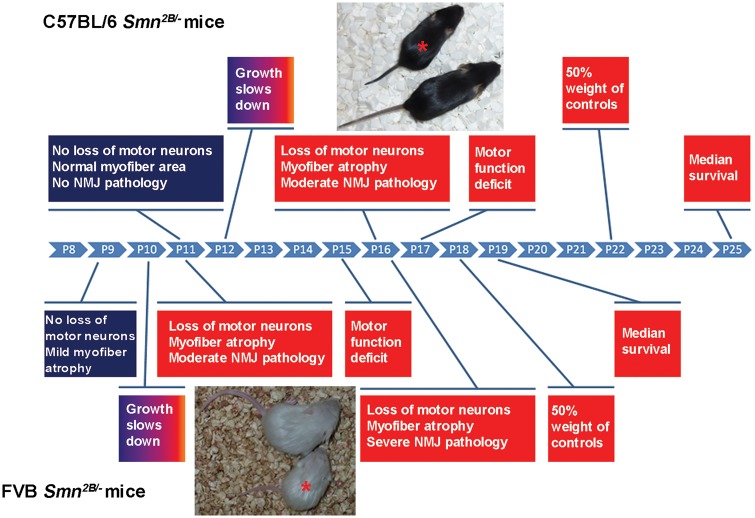
Degenerative changes involving motor units account for the major clinical presentations of SMA (i.e. progressive weakness and paralysis) (3,31). These changes include atrophy of myofibres, lack of maturation of MEPs, swelling and disorganization of axonal terminals of MNs, and finally death of MNs. We investigated these changes in congenic Smn2B/- mice at different ages and observed that all of these pathologic changes occur at an earlier age in FVB Smn2B/- mice than they do in BL6 mice. At PND11, FVB Smn2B/- mice present with reduced muscle fibre cross-sectional area, smaller MEPs, neurofilament accumulation at NMJs and loss of MNs within the lumbar spinal cord. Of note, none of these pathological changes were observed in BL6 Smn2B/- mice at PND11. Moreover, we found that at PND16 these changes were more severe in FVB Smn2B/- mice than in BL6 Smn2B/- mice (summarized in Fig. 9).
Figure 9.
A schematic temporal comparison of various phenotypes in FVB Smn2B/-and BL6 Smn2B/-mice. P indicates postnatal day (PND). * indicates Smn2B/- mice beside their control littermates.
Our results show that Smn2B/- mice on the FVB background present a more severe phenotype than on the BL6 background. The effect of genetic background on the severity of the phenotype has also been observed in other mouse models of SMA. Congenic “severe model” mice on the BL6 background die before birth, but on the FVB background they have a median survival of 5 days (5,6). Also, congenic “delta 7” mice on the BL6 background show a remarkable reduced life span compared to that on the FVB background (median survival of 1 and 10 days, respectively) (6). On the other hand, the “Taiwanese model” when backcrossed on the BL6 background showed an increase in survival compared to the original congenic FVB mice (median survival of 15 and 10 days, respectively) (16). Based on survival, it appears that the “severe model” and the “delta 7” mice show a more severe phenotype on the BL6 background (5,6), a trend that is opposite to that shown by the “Taiwanese model” and the Smn2B/- mice in the present study. An important consideration amongst all the different mouse models of SMA is the type of mutation introduced. In all cases, the endogenous mouse Smn gene has been either completely silenced or only partially disrupted. Whether, this plays a role in the severity of the phenotype in different congenic backgrounds remains to be seen.
In search for an explanation for the difference in the onset and severity of disease phenotype between FVB and BL6 Smn2B/- mice, we measured Smn protein levels in extracts of lumbar spinal cords of PND9 mice. No significant difference was detectable between FVB and BL6 Smn2B/- mice at two different time points, excluding changes in Smn levels as a reason behind the differential severity. A more likely explanation is that there is an influence of one or more modifier genes on the overall disease pathogenesis in these mice. We have assessed levels of three different proteins that are involved in the regulation of the actin cytoskeleton. Although, the Rho kinase pathway was more active in the Smn2B/- mice, there did not appear to be any differential regulation of the pathway between the two genetic strains tested, as determined by assessing phospho-cofilin to total cofilin protein levels. Profilin 1, which inhibits the polymerization of actin, had increased levels in FVB mice compared to BL6. Finally, the levels of Pls3 are significantly increased in spinal cords of BL6 Smn2B/- mice compared to their wild type littermates. A similar increase in FVB Smn2B/- mice was not observed. PLS3 has been proposed to be a genetic modifier of SMA in both human and animal studies (14,34,35). In SMA patients, higher levels of Plastin 3 correlated with less severe SMA types (36). Furthermore, Plastin 3 levels are decreased in Smn mutant zebra fish and overexpression of human PLS3 rescues the SMA phenotype in these animals (37). Overexpression of Pls3 in the “Taiwanese model” mice on the BL6, but not the FVB, background also resulted in a less severe phenotype (16). Although Pls3 improves the NMJ pathology in the “Taiwanese model”, it should be noted that the NMJ pathology in these mice is already less severe than most of the other SMA mouse models to begin with. Other studies have shown that overexpression of Pls3 in the “delta 7 model” mice on the FVB background did not provide any benefit (17). The differential induction of Pls3 in BL6 Smn2B/- mice may contribute to the less severe phenotype compared to the FVB Smn2B/- mice, but this requires more investigation.
In summary, our studies have shown that the congenic strains of Smn2B/- mice on the FVB background have a more severe phenotype than on the BL6 background. Although this difference in severity correlates with a differential induction of Plastin 3 in the BL6 background, we cannot exclude the possibility that other genetic modifiers likely influence the overall disease picture in the congenic Smn2B/- mice. Future studies will be directed towards a systematic search for modifier genes influencing the phenotype in these mice. Identification of such genes could potentially reveal pathways involved in motor neuron survival and skeletal muscle amelioration, and contribute to new therapeutic approaches to treat SMA.
Materials and Methods
Mouse maintenance
BL6 and FVB Smn+/- and wild type mice were purchased from the Jackson Laboratory as follows: FVB/NJ (#001800), C57BL/6J (#000664), B6.129P2(Cg)-Smn1 < tm1Msd>/J (# 010921) and FVB.129P2-Smn1 < tm1Msd>/J (# 006214) (Bar Harbor, Maine, USA). FVB.Cg-Tg(SMN2)89Ahmb Smn1 < tm1Msd>/J (#005024) severe mice have been described before (5), and were purchased from the Jackson Laboratory. Smn2B/2B mice were generated in our laboratory and had been maintained on a BL6 x CD1 hybrid background (26). All animals were handled according to institutional guidelines (Animal Care and Veterinary Services, University of Ottawa).
Generation of congenic strains
Smn2B/2Bmice with a mixed genetic background were mated to FVB or BL6 wild type female mice. Only male pups from each litter were weaned and genotyped for the Smn2B allele (forward primer: 5’-AAC TCC GGG TCC TCC TTC CT-3’ and reverse primer: 5’-TTT GGC AGA CTT TAG CAG GGC-3’). At each subsequent generation, male Smn2B/+ mice were mated to wild type females of either FVB or BL6 mice, as appropriate. The backcrossing was continued to the tenth generation of Smn2B/+ mice in each background to attain the fully congenic Smn2B/+ strains.
Characterization of congenic Smn2B/- mice
At the sixth generation of backcrossing, three male and three female mice with Smn2B/+ genotype were mated to generate Smn2B/2B mice. Homozygous Smn2B/2B mice were then mated with Smn+/- mice of the relevant genetic background to generate congenic Smn2B/-mice in either the FVB or BL6 backgrounds. These mice were then characterized as described below. Unless otherwise specified, Smn2B/+ littermates of Smn2B/-mice were used as normal controls based on our previous studies.
Survival and growth
All of the experimental cages of both backgrounds were kept in the same room and were inspected every morning for new litters, death or any endpoints. During the survival study, humane endpoints were followed according to the Animal Care and Veterinary Services (ACVS) of the University of Ottawa (severe dehydration, hypothermia or dragging of the hind limbs). At endpoints, mice were euthanized using a CO2 chamber followed by cervical dislocation. The exact date and cause of death of any pup was recorded. The euthanized mice were excluded from the survival study. For the first litter of each breeding cage, the mice which did not show any phenotype were also genotyped to exclude any asymptomatic Smn2B/- mouse within this group. Around 3–4 days after birth, all pups were tattooed for identification. The weights of all pups were measured daily and recorded using a Scout Pro digital mini-scale (Ohaus Corp, NJ). The scale was calibrated automatically every day upon start.
Motor tests
Two standard motor tests were used to evaluate muscle strength of the Smn2B/- mice. The inverted mesh grip test was performed based on the Treat-NMD guidelines (protocol number SMA-M.2.1.002) (28). Briefly, one pup was placed on a plastic mesh (about 1 mm2 grids) mounted firmly on a plastic frame. Then the mesh was inverted gently. The distance of the mesh from soft bedding on the ground was about 80 cm. The end point of the test occurred when the pup dropped to the bedding, or continued to hold on for 60 sec. A mark of 100% success was attributed when the mice held for 60 sec. The test was performed for all the pups in a cage once (one round) and then this was repeated for five more rounds. The inverted mesh grip test was performed starting at PND13 and was repeated every other day until PND25.
The hind limb suspension test (also known as tube test) was performed based on Treat-NMD guidelines (protocol number SMA-M.2.2.001) (29). A metal tube of 6.5 cm diameter, 20 cm height and about 1 mm wall thickness was used. The bottom of the tube was covered with soft bedding. The mouse was set face down inside the tube and hanging with its hind limbs over the rim of the tube. The test was considered finished if the pup dropped into the tube, came out of the tube, or continued to hang on for 60 sec. A mark of 100% success was attributed when the mice held for 60 sec or came out of the tube. The test was performed once for each pup in the cage (one round) and this was repeated for five more rounds. The hind limb suspension test was performed starting at PND7 and was repeated every other day until PND25.
Myofibre cross-sectional area measurement
Mice were euthanized and tibialis anterior (TA) muscles were dissected and mounted immediately in Optimal Cutting Temperature (OCT) compound (Tissue-Tek). Using a cryostat, 10 µm sections were prepared at the biggest diameter of the TA muscles. Sections were air dried at room temperature and underwent a standard hematoxylin and eosin (H&E) staining. Using a Zeiss Ax10 microscope equipped with an Axiocam MRC camera (Plan-APOCHROMAT 40X/0.95 Ph3 lens) images were taken from different regions of each section. Using ImageJ software, the cross-sectional areas of each myofibre in two or three images (about 300 to 400 myofibres for each mouse) were determined.
Motor neuron number measurement
Mice were euthanized and lumbar spinal cords were dissected under the level of T12 (using the last rib as a marker) and fixed in 4% paraformaldehyde (PFA) in PBS overnight. The samples were incubated in 30% sucrose in PBS for 24 h and then mounted in OCT. Using a cryostat, an initial 500 µm of each spinal cord was trimmed. Then, six transverse sections (thickness of 10 µm) with an interval of 100 µm were mounted on one slide, spanning a region of about 500 µm of mouse lumbar spinal cord at the level of L1-L2. The slides were air dried at room temperature and then stained as follows. Samples were permeabilized in 0.3% TritonX-100 in PBS for 30 min, then blocked in 1X Power Block (BioGenex, Fremont, CA) for 10 min at room temperature. Samples were incubated with a goat anti-ChAT antibody (EMD Millipore, Darmstadt, Germany) in 1% BSA and 0.3% TritonX-100 in PBS for 48 h at 4 °C. Samples were incubated with Alexa Fluor 555 donkey anti-goat IgG (Life Technologies, Carlsbad, California) for 2 h at room temperature. Nuclei were counterstained with 4',6-diamidino-2-phenylindole (DAPI). Using a Zeiss Ax10 microscope (Plan-APOCHROMAT 20X/0.8 Ph2 lens) equipped with an Axiocam HRM camera, images were taken from ventral horn areas of all spinal cord sections. Motor neuron cell bodies were counted using ImageJ software.
Neuromuscular junction staining
TVA muscles were dissected and stained for neurofilament-M (NFM) and motor endplates (MEP) as described before (38). Briefly, mice were euthanized and TVA muscles were dissected and fixed in 2% PFA in PBS for 10 min at room temperature. Samples were permeabilized in 0.3% Triton X-100 in PBS for 30 min and blocked in 1X Power Block for 10 min at room temperature (BioGenex, Fremont, CA). Then, the samples were incubated with a mouse anti-neurofilament-M antibody and a mouse anti-SV2 antibody (Developmental Studies Hybridoma Bank, Iowa City, IA) in 1% BSA and 0.3% Triton X-100 in PBS overnight at 4 °C. Samples were incubated with Alexa Fluor 488 goat anti-mouse IgG (Life Technologies, Carlsbad, California) for 1 h at room temperature. MEPs were counterstained with tetramethylrhodamine (TRITC) conjugated alpha-bungarotoxin (Life Technologies, Carlsbad, California). TVA muscles were whole-mounted on microscope slides using Dako Fluorescent mounting media. Images were taken using a confocal LSM510 Zeiss microscope (Plan-APOCHROMAT 63X/1.4 oil DIC) and were quantified using ImageJ software.
Western blotting
Lumbar spinal cords at the level of L1-L5 were dissected and homogenized in RIPA buffer (Cell Signalling Technology). From each sample, 10 µg of total protein was loaded on an SDS-polyacrylamide gel and separated by electrophoresis. The proteins were then blotted onto Immobilon-FL membranes (EMD Millipore). Membranes were stained with Sypro Ruby (Life Technologies), scanned using a Chemidoc-IT imager (UVP) and total protein in each lane was quantified using UVP software. The following primary antibodies were used to probe the membranes after 1 h blocking: mouse anti-Smn (BD Bioscience), rabbit anti-GAPDH (glyceraldehyde 3-phosphate dehydrogenase) (Abcam), rabbit anti-phospho-cofilin (Cell Signaling Technology), mouse anti-cofilin (Abcam), rabbit anti-profilin 1 (Cell Signaling Technology) and rabbit anti-Pls3 (Genetex). Membranes then were incubated with IRDye fluorescent conjugated (LiCOR) or HRP conjugated secondary antibodies (Jackson Laboratories) and were developed using an Odyssey CLx scanning machine or chemiluminescence western blotting substrate (Thermo Scientific Pierce), respectively. The images were quantified using Image Studio 4.0 (LiCOR) or ImageJ software. Total protein of each lane was used to normalize the specific signals of that lane.
Statistical analysis
All of the statistical analyses were performed using Prism 6 GraphPad software (San Diego, CA). The statistical tests used for each analysis are specified in the corresponding results section. All data are presented as mean ± standard error of the mean (SEM).
Supplementary Material
Supplementary Material is available at HMG online.
Supplementary Material
Acknowledgements
We would like to thank Dr. Lyndsay Murray for advice on NMJ staining, and all members of the Kothary laboratory for helpful discussions. M.E. was supported by an Ontario Trillium Scholarship. R.K. is a recipient of a University Health Research Chair from the University of Ottawa.
Conflicts of Interest Statement. None declared.
Funding
This work was supported by Cure SMA/Families of SMA Canada; Muscular Dystrophy Association (USA) (grant number 294568); Canadian Institutes of Health Research (CIHR) (grant number MOP-130279); and the E-Rare-2 program from the CIHR (grant number ERL-138414). Funding to pay the Open Access publication charges for this article was provided by an operating grant from the CIHR.
References
- 1.Lefebvre S., Burglen L., Reboullet S., Clermont O., Burlet P., Viollet L., Benichou B., Cruaud C., Millasseau P., Zeviani M., et al. (1995) Identification and characterization of a spinal muscular atrophy-determining gene. Cell, 80, 155–165. [DOI] [PubMed] [Google Scholar]
- 2.Pearn J. (1978) Incidence, prevalence, and gene frequency studies of chronic childhood spinal muscular atrophy. J. Med. Gen., 15, 409–413. [DOI] [PMC free article] [PubMed] [Google Scholar]
- 3.Crawford T.O., Pardo C.A. (1996) The neurobiology of childhood spinal muscular atrophy. Neurobiol. Dis., 3, 97–110. [DOI] [PubMed] [Google Scholar]
- 4.Heiman-Patterson T.D., Deitch J.S., Blankenhorn E.P., Erwin K.L., Perreault M.J., Alexander B.K., Byers N., Toman I., Alexander G.M. (2005) Background and gender effects on survival in the TgN(SOD1-G93A)1Gur mouse model of ALS. J. Neurol. Sci., 236, 1–7. [DOI] [PubMed] [Google Scholar]
- 5.Monani U.R., Sendtner M., Coovert D.D., Parsons D.W., Andreassi C., Le T.T., Jablonka S., Schrank B., Rossoll W., Prior T.W., et al. (2000) The human centromeric survival motor neuron gene (SMN2) rescues embryonic lethality in Smn(-/-) mice and results in a mouse with spinal muscular atrophy. Hum. Mol. Genet., 9, 333–339. [DOI] [PubMed] [Google Scholar]
- 6.Le T.T., Pham L.T., Butchbach M.E., Zhang H.L., Monani U.R., Coovert D.D., Gavrilina T.O., Xing L., Bassell G.J., Burghes A.H. (2005) SMNDelta7, the major product of the centromeric survival motor neuron (SMN2) gene, extends survival in mice with spinal muscular atrophy and associates with full-length SMN. Hum. Mol. Genet., 14, 845–857. [DOI] [PubMed] [Google Scholar]
- 7.Hatzipetros T., Bogdanik L.P., Tassinari V.R., Kidd J.D., Moreno A.J., Davis C., Osborne M., Austin A., Vieira F.G., Lutz C., et al. (2014) C57BL/6J congenic Prp-TDP43A315T mice develop progressive neurodegeneration in the myenteric plexus of the colon without exhibiting key features of ALS. Brain Res., 1584, 59–72. [DOI] [PubMed] [Google Scholar]
- 8.Heiman-Patterson T.D., Sher R.B., Blankenhorn E.A., Alexander G., Deitch J.S., Kunst C.B., Maragakis N., Cox G. (2011) Effect of genetic background on phenotype variability in transgenic mouse models of amyotrophic lateral sclerosis: a window of opportunity in the search for genetic modifiers. Amyotroph. Lateral Scler., 12, 79–86. [DOI] [PubMed] [Google Scholar]
- 9.Coley W.D., Bogdanik L., Vila M.C., Yu Q., Van Der Meulen J.H., Rayavarapu S., Novak J.S., Nearing M., Quinn J.L., Saunders A., et al. (2016) Effect of genetic background on the dystrophic phenotype in mdx mice. Hum. Mol. Genet., 25, 130–145. [DOI] [PMC free article] [PubMed] [Google Scholar]
- 10.Cudkowicz M.E., McKenna-Yasek D., Sapp P.E., Chin W., Geller B., Hayden D.L., Schoenfeld D.A., Hosler B.A., Horvitz H.R., Brown R.H. (1997) Epidemiology of mutations in superoxide dismutase in amyotrophic lateral sclerosis. Ann. Neurol., 41, 210–221. [DOI] [PubMed] [Google Scholar]
- 11.Al-Chalabi A., Andersen P.M., Chioza B., Shaw C., Sham P.C., Robberecht W., Matthijs G., Camu W., Marklund S.L., Forsgren L., et al. (1998) Recessive amyotrophic lateral sclerosis families with the D90A SOD1 mutation share a common founder: evidence for a linked protective factor. Hum. Mol. Genet., 7, 2045–2050. [DOI] [PubMed] [Google Scholar]
- 12.Harada Y., Sutomo R., Sadewa A.H., Akutsu T., Takeshima Y., Wada H., Matsuo M., Nishio H. (2002) Correlation between SMN2 copy number and clinical phenotype of spinal muscular atrophy: three SMN2 copies fail to rescue some patients from the disease severity. J. Neurol., 249, 1211–1219. [DOI] [PubMed] [Google Scholar]
- 13.Elsheikh B., Prior T., Zhang X., Miller R., Kolb S.J., Moore D., Bradley W., Barohn R., Bryan W., Gelinas D., et al. (2009) An analysis of disease severity based on SMN2 copy number in adults with spinal muscular atrophy. Muscle Nerve, 40, 652–656. [DOI] [PubMed] [Google Scholar]
- 14.Oprea G.E., Krober S., McWhorter M.L., Rossoll W., Muller S., Krawczak M., Bassell G.J., Beattie C.E., Wirth B. (2008) Plastin 3 is a protective modifier of autosomal recessive spinal muscular atrophy. Science, 320, 524–527. [DOI] [PMC free article] [PubMed] [Google Scholar]
- 15.Shinomiya H. (2012) Plastin family of actin-bundling proteins: its functions in leukocytes, neurons, intestines, and cancer. Int. J. Cell Biol., 2012, 213492.. [DOI] [PMC free article] [PubMed] [Google Scholar]
- 16.Ackermann B., Krober S., Torres-Benito L., Borgmann A., Peters M., Hosseini Barkooie S.M., Tejero R., Jakubik M., Schreml J., Milbradt J., et al. (2013) Plastin 3 ameliorates spinal muscular atrophy via delayed axon pruning and improves neuromuscular junction functionality. Hum. Mol. Genet., 22, 1328–1347. [DOI] [PubMed] [Google Scholar]
- 17.McGovern V.L., Massoni-Laporte A., Wang X., Le T.T., Le H.T., Beattie C.E., Rich M.M., Burghes A.H. (2015) Plastin 3 Expression Does Not Modify Spinal Muscular Atrophy Severity in the 7 SMA Mouse. PLoS One, 10, e0132364.. [DOI] [PMC free article] [PubMed] [Google Scholar]
- 18.Bowerman M., Shafey D., Kothary R. (2007) Smn depletion alters profilin II expression and leads to upregulation of the RhoA/ROCK pathway and defects in neuronal integrity. J. Mol. Neurosci., 32, 120–131. [DOI] [PubMed] [Google Scholar]
- 19.Bowerman M., Anderson C.L., Beauvais A., Boyl P.P., Witke W., Kothary R. (2009) SMN, profilin IIa and plastin 3: a link between the deregulation of actin dynamics and SMA pathogenesis. Mol. Cell. Neurosci., 42, 66–74. [DOI] [PubMed] [Google Scholar]
- 20.Bowerman M., Beauvais A., Anderson C.L., Kothary R. (2010) Rho-kinase inactivation prolongs survival of an intermediate SMA mouse model. Hum. Mol. Genet., 19, 1468–1478. [DOI] [PubMed] [Google Scholar]
- 21.Bowerman M., Murray L.M., Boyer J.G., Anderson C.L., Kothary R. (2012) Fasudil improves survival and promotes skeletal muscle development in a mouse model of spinal muscular atrophy. BMC Med., 10, 24.. [DOI] [PMC free article] [PubMed] [Google Scholar]
- 22.Bebee T.W., Dominguez C.E., Chandler D.S. (2012) Mouse models of SMA: tools for disease characterization and therapeutic development. Hum. Genet., 131, 1277–1293. [DOI] [PubMed] [Google Scholar]
- 23.Hsieh-Li H.M., Chang J.G., Jong Y.J., Wu M.H., Wang N.M., Tsai C.H., Li H. (2000) A mouse model for spinal muscular atrophy. Nature Genet., 24, 66–70. [DOI] [PubMed] [Google Scholar]
- 24.DiDonato C.J., Lorson C.L., De Repentigny Y., Simard L., Chartrand C., Androphy E.J., Kothary R. (2001) Regulation of murine survival motor neuron (Smn) protein levels by modifying Smn exon 7 splicing. Hum. Mol. Genet., 10, 2727–2736. [DOI] [PubMed] [Google Scholar]
- 25.Hammond S.M., Gogliotti R.G., Rao V., Beauvais A., Kothary R., DiDonato C.J. (2010) Mouse survival motor neuron alleles that mimic SMN2 splicing and are inducible rescue embryonic lethality early in development but not late. PLoS One, 5, e15887.. [DOI] [PMC free article] [PubMed] [Google Scholar]
- 26.Bowerman M., Murray L.M., Beauvais A., Pinheiro B., Kothary R. (2012) A critical smn threshold in mice dictates onset of an intermediate spinal muscular atrophy phenotype associated with a distinct neuromuscular junction pathology. Neuromuscul. Disord., 22, 263–276. [DOI] [PubMed] [Google Scholar]
- 27.Boyer J.G., Murray L.M., Scott K., De Repentigny Y., Renaud J.M., Kothary R. (2013) Early onset muscle weakness and disruption of muscle proteins in mouse models of spinal muscular atrophy. Skeletal Muscle, 3, 24.. [DOI] [PMC free article] [PubMed] [Google Scholar]
- 28.Sumner C. (2010) Grip strength. TREAT-NMD Neuro muscular Network, Experimental protocols for SMA animal models, SMA_M.2.1.002.
- 29.Sumner C. (2011) Behavioral Phenotyping for Neonates: Hind Limb Suspension Test (a.k.a. Tube Test). TREAT-NMD Neuromuscular Network, Experimental protocols for SMA animal models, SMA_M.2.1.002.
- 30.Kariya S., Park G.H., Maeno-Hikichi Y., Leykekhman O., Lutz C., Arkovitz M.S., Landmesser L.T., Monani U.R. (2008) Reduced SMN protein impairs maturation of the neuromuscular junctions in mouse models of spinal muscular atrophy. Hum. Mol. Genet., 17, 2552–2569. [DOI] [PMC free article] [PubMed] [Google Scholar]
- 31.Murray L.M., Lee S., Baumer D., Parson S.H., Talbot K., Gillingwater T.H. (2010) Pre-symptomatic development of lower motor neuron connectivity in a mouse model of severe spinal muscular atrophy. Hum. Mol. Genet., 19, 420–433. [DOI] [PubMed] [Google Scholar]
- 32.Murray L.M., Comley L.H., Thomson D., Parkinson N., Talbot K., Gillingwater T.H. (2008) Selective vulnerability of motor neurons and dissociation of pre- and post-synaptic pathology at the neuromuscular junction in mouse models of spinal muscular atrophy. Hum. Mol. Genet., 17, 949–962. [DOI] [PubMed] [Google Scholar]
- 33.Nadeau J.H. (2001) Modifier genes in mice and humans. Nature Rev. Genet., 2, 165–174. [DOI] [PubMed] [Google Scholar]
- 34.Bernal S., Also-Rallo E., Martinez-Hernandez R., Alias L., Rodriguez-Alvarez F.J., Millan J.M., Hernandez-Chico C., Baiget M., Tizzano E.F. (2011) Plastin 3 expression in discordant spinal muscular atrophy (SMA) siblings. Neuromuscul. Disord., 21, 413–419. [DOI] [PubMed] [Google Scholar]
- 35.Heesen L., Peitz M., Torres-Benito L., Holker I., Hupperich K., Dobrindt K., Jungverdorben J., Ritzenhofen S., Weykopf B., Eckert D., et al. (2016) Plastin 3 is upregulated in iPSC-derived motoneurons from asymptomatic SMN1-deleted individuals. Cell Mol. Life Sci., 73, 2089–2104. [DOI] [PMC free article] [PubMed] [Google Scholar]
- 36.Stratigopoulos G., Lanzano P., Deng L., Guo J., Kaufmann P., Darras B., Finkel R., Tawil R., McDermott M.P., Martens W., et al. (2010) Association of plastin 3 expression with disease severity in spinal muscular atrophy only in postpubertal females. Arch. Neurol., 67, 1252–1256. [DOI] [PubMed] [Google Scholar]
- 37.Hao le T., Wolman M., Granato M., Beattie C.E. (2012) Survival motor neuron affects plastin 3 protein levels leading to motor defects. J. Neurosci., 32, 5074–5084. [DOI] [PMC free article] [PubMed] [Google Scholar]
- 38.Murray L., Gillingwater T.H., Kothary R. (2014) Dissection of the transversus abdominis muscle for whole-mount neuromuscular junction analysis. J. Visual Exp., e51162.. [DOI] [PMC free article] [PubMed] [Google Scholar]
Associated Data
This section collects any data citations, data availability statements, or supplementary materials included in this article.


