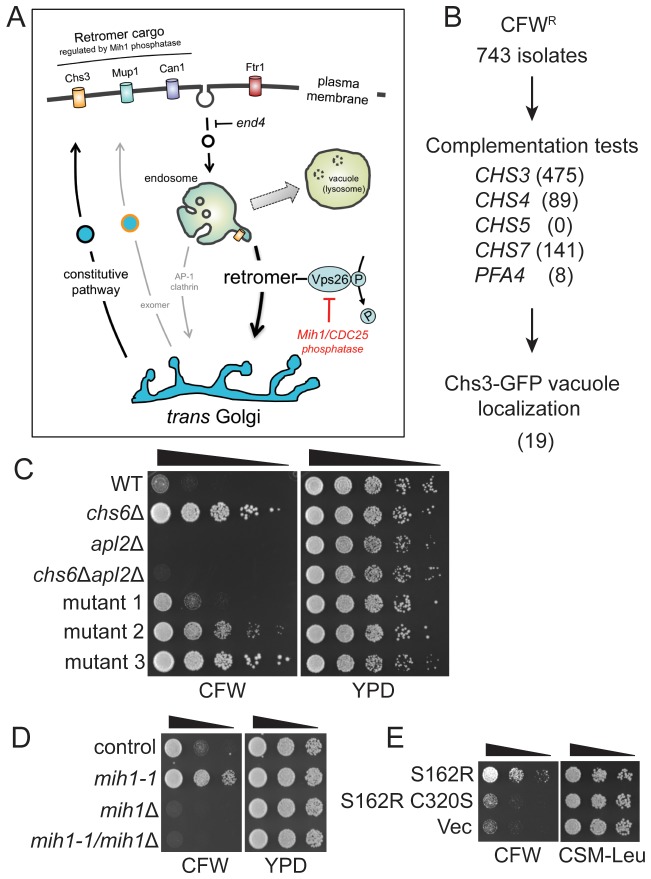
Figure 1. Selection of yeast mutants resistant to calcofluor white.
(A) Schematic diagram of post-Golgi trafficking pathways. In wild-type cells, Chs3 is retained at the Golgi-endosome interface via AP-1 dependent retrieval from the endosome, and is delivered to the plasma membrane via Golgi-derived exomer coated vesicles (gray arrows). In cells used for the genetic selection in this study, chitin synthase 3 (Chs3) is diverted into the constitutive secretory pathway due to deletions of the Chs6 exomer subunit and the Apl2 AP-1 subunit (chs6Δapl2Δ). Endocytosis of Chs3 and other plasma membrane proteins, which is attenuated by the end4 mutation, delivers the internalized proteins to the endosome, where some are sorted by retromer into a recycling pathway, while others are retained in the endosome and delivered to the lysosome-like vacuole and degraded. (B) Strategy to identify novel mutations affecting Chs3 trafficking. The flowchart lists the number of mutants remaining after each step of selection. (C) Representative calcofluor white (CFW) resistant strains. Serial dilutions (1:10; indicated by the black triangle above the photograph) of the indicated strains were spotted onto YPD medium with or without 100 μg/ml CFW. The plates were incubated for three days at 30°C and then photographed. (D) Mutations in MIH1 alter sensitivity of growth to CFW. Serial dilutions (indicated by a triangle above the photograph) of control cells of the indicated genotypes were spotted onto rich medium with or without 50 μg/ml CFW for three days at 30°C. The genotype of the control strain is: chs6Δapl2Δ. The chs6Δapl2Δmih1-1 strain was constructed by introducing the mih1-1 lesion de novo in the original chs6Δapl2Δ parent strain. The mih1Δ designation indicates that the wild-type MIH1 locus was deleted in the original parent strain (chs6Δapl2Δmih1Δ). The mih1-1/mih1Δ designation indicates that the mih1-1 allele was deleted in the original mih1-1 mutant strain. (E) Mih1 phosphatase activity is required for CFW resistance conferred by the mih1-1 mutation. Serial dilutions of chs6Δapl2Δmih1Δ cells containing plasmids expressing the mih1-1 allele (‘S162R’), a double mutant protein (S162R C320S) in which a second mutation was introduced that ablates catalytic activity, or empty vector (‘Vec’), were spotted onto complete synthetic medium with or without 50 μg/ml CFW for three days at 30°C. The host strain is the chs6Δapl2Δmih1Δ strain background.


