Abstract
PURPOSE
To evaluate the elastic anisotropy of porcine corneas at different cycled intraocular pressures (IOPs) using a noncontact optical coherence elastography (OCE) technique.
METHODS
A focused air-pulse induced low amplitude (≤ 10 μm) elastic waves in fresh porcine corneas (n = 7) in situ in the whole eye globe configuration. A home-built phase-stabilized swept source optical coherence elastography (PhS-SSOCE) system imaged the elastic wave propagation at different stepped radial directions. A closed-loop feedback system was used to artificially control the IOP and the OCE measurements were repeated as the IOP was incrementally increased from 15 to 30 mm Hg in 5-mm Hg increments.
RESULTS
The OCE measurements demonstrated that the stiffness of the cornea increased as a function of IOP and elastic anisotropy of the cornea became more pronounced at higher IOPs. The standard deviation of the modified planar anisotropy coefficient increased from 0.72 ± 0.42 at an IOP of 15 mm Hg to 1.58 ± 0.40 at 30 mm Hg.
CONCLUSIONS
The presented noncontact OCE method was capable of detecting and assessing the corneal elastic anisotropy as a function of IOP. Due to the non-invasive nature and small amplitude of the elastic wave, this method may be able to provide further information about corneal health and integrity in vivo.
Optical coherence elastography1,2 (OCE) is a rapidly emerging noninvasive elastographic technique that uses optical coherence tomography3 (OCT) to image externally induced displacements. This enables micrometer-scale spatial resolution and nanometer-scale displacement sensitivity.4 Optical transparency and scattering usually limit the imaging depth of OCT to a few millimeters in tissue, but this is not an issue with the anterior segment of the eye. Thus, OCE is well suited to characterize the biomechanical properties of the cornea.2
The biomechanical anisotropic characteristics of the cornea have been investigated with strip extensiometry,5 finite element modeling of inflation test measurements,6 and computational modeling of x-ray scattering data.7 Although these techniques have revealed valuable information about corneal elastic anisotropy, they are not feasible for in vivo assessments. Supersonic shear-wave imaging has recently measured the in vivo elastic anisotropy at a relatively low (10 mm Hg) and high (20 mm Hg) intraocular pressure (IOP). However, this technique required submersion of the cornea in water and subsequent general anesthesia.8
In this article, we quantify the elastic anisotropy of in situ porcine corneas at various IOPs with a noncontact method of OCE.
MATERIALS AND METHODS
Corneal Sample Preparation
Juvenile porcine eyes (n = 7) were obtained fresh (J&J Packing Company, Inc., Brookshire, TX) and all experiments were conducted immediately when the samples were received, which was within 24 hours of enucleation. Extraneous tissues such as muscles and fat were removed and the eyes were placed in custom holders. The eyes were cannulated with two needles for artificial IOP control by our previously published technique.9 One needle was connected via tubing to a micro-infusion pump and the other needle was connected via tubing to a pressure transducer, which provided feedback to a custom closed-loop software to maintain a user-specified IOP. During the OCE measurements, the air port tip was kept approximately 400 μm away from the corneal surface.
Phase-Stabilized Swept Source OCE (PhS-SSOCE) System
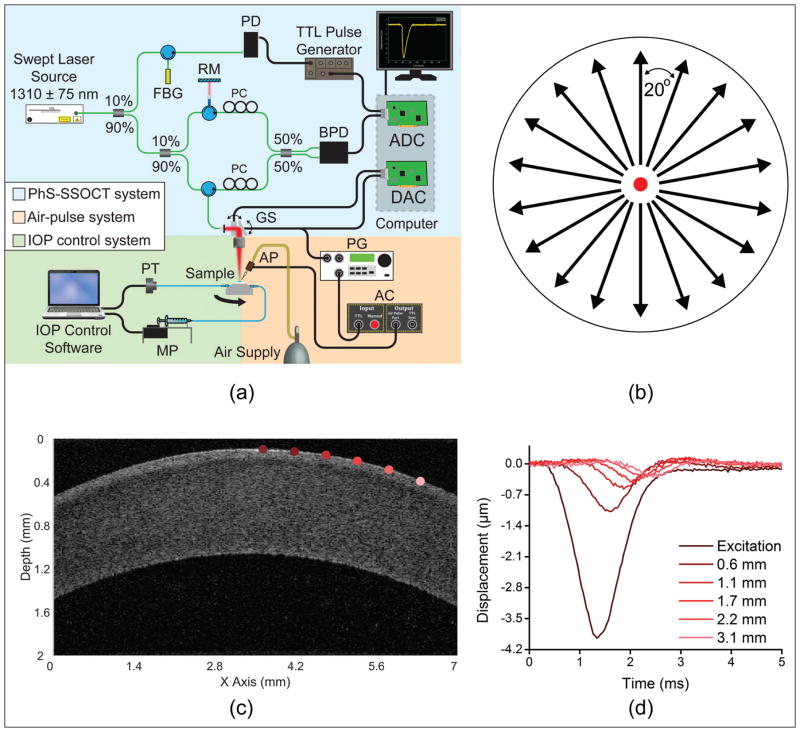
The home-built PhS-SSOCE system comprised two main subsystems: a focused air-pulse delivery device10 and a PhS-SSOCT system.11 The focused air-pulse device was composed of an electronically controlled pneumatic solenoid and controller. The short duration (≤ 1 ms) air-pulse was expelled out of an air gate with an inner diameter of approximately 150 μm. The PhS-SSOCT system was composed of a swept laser source (HSL2000; Santec Inc., CAAQ1) with a central wavelength of 1,310 nm, bandwidth of 130 nm, and output power of approximately 39 mW. The axial and lateral resolutions of the PhS-SSOCT system were measured as 11 and 16 μm, respectively, and the phase stability was approximately 40 nm during the corneal experiments. A schematic of the experimental set-up is shown in Figure 1A.
Figure 1.
(A) Experimental set-up. (B) Optical coherence elastography elastic wave measurement paradigm on the cornea where the black arrows are elastic wave propagation directions that were imaged and the red dot is the excitation position at the corneal apex. (C) Optical coherence tomography structural image of one meridian in Figure 1B of a porcine cornea at 15 mm Hg intraocular pressure. (D) Vertical temporal displacement profiles from the positions of corresponding colors marked in Figure 1C, and the elastic wave propagation and attenuation are clearly visible. AC = air-pulse controller; ADC = analog to digital converter; AP = air port; BPD = balanced photodetector; DAC = digital to analog converter; FBG = fiber-Bragg grating; GS = galvanometer scanners; MP = micro-infusion pump; PC = polarization controller; PD = photodetector; PG = pulse generator; PT = pressure transducer; RM = reference mirror
OCE Measurements
The PhS-SSOCT system imaged the elastic wave propagation along approximately 7 mm where the excitation was at the middle of the scan, which was also the apex of the cornea. Multiple M-mode images (n = 251, 100 ms for each M-mode acquisition) were acquired along a line for a given meridian. M-mode imaging is defined as holding the probe beam stationary and measuring tissue response over time. By synchronizing each air-pulse with a corresponding M-mode scan along a line along the elastic wave propagation path, the system effectively imaged the same elastic wave.12 The wave propagation was imaged at stepped meridional angles by rotating the sample 20° (Figure 1B) and repeating the OCE measurements. A typical OCT structural image of a single meridian of a porcine cornea at 15 mm Hg IOP is shown in Figure 1C. Sample vertical temporal displacement profiles from the positions marked in corresponding colors in Figure 1C are plotted in Figure 1D. Because the excitation was at the middle of the scan, two meridional angles were measured at once, and the sample was rotated nine times for a given IOP for a full rotation. To measure the dependence of the elastic anisotropy on the IOP, the IOP was increased from 15 to 30 mm Hg in 5-mm Hg steps, and the OCE measurements were repeated at each interval. Before the OCE measurements were taken, each sample was preconditioned by cycling the IOP between 15 and 30 mm Hg twice.
Group Velocity Calculations
The raw unwrapped vertical temporal phase profiles within the sample were corrected for the motion of the corneal surface and refractive index mismatch between the cornea and air.12,13 The group velocity was obtained by cross-correlation analysis of the normalized displacement profiles and linear fitting14 and a sliding window algorithm. The velocity for a given window of approximately 750 μm was calculated and the slope of the linear fit of the elastic wave propagation delays and corresponding distances was mapped as the velocity for the center of that window. The window was then shifted by one pixel and the procedure was repeated until the elastic wave could no longer be distinguished from the noise or the end of the imaging region was reached. The curvature of the corneas, as obtained from the structural OCT image, was incorporated into the velocity calculations to ensure accuracy. This was repeated along every depth-wise pixel through the entire thickness of the cornea and averaged depth-wise for each radial angle and then angle-wise for each IOP.
Mechanical Anisotropy Quantification
To characterize the changes in mechanical anisotropic characteristics, two parameters were quantified, the normalized fractional anisotropy15 (NFA) and a modified planar anisotropy coefficient16 (MPAC). The NFA is a simple parameter that can provide the overall degree of mechanical anisotropy, and the MPAC relates the anisotropy for a given angle to its orthogonal angle and the angle that bisects the two orthogonal angles.
The NFA of each cornea at each IOP was quantified by:
| (2) |
where vmax and vmin were the maximum and minimum velocities, respectively, and vmean was the overall sample-wise mean velocity. A larger NFA corresponds to a greater degree of anisotropy, whereas a lower NFA relates to a lesser degree of anisotropy.
The MPAC was modified by calculating rθ for every measured angle as:
| (3) |
where vθ was the angle-wise mean velocity at angle θ, vθ+90° was the velocity 90° clockwise from θ, and vθ−45° was the velocity 45° clockwise from θ. MPAC values for vθ+90° and vθ+45° were linearly interpolated from the OCE measurements because angular measurements were taken every 20°. To quantify the overall anisotropic characteristics of a sample at a given IOP, the standard deviation of the MPAC values for that given sample was calculated. Similar to the NFA, a larger standard deviation of MPAC corresponds to a more anisotropic sample.
RESULTS
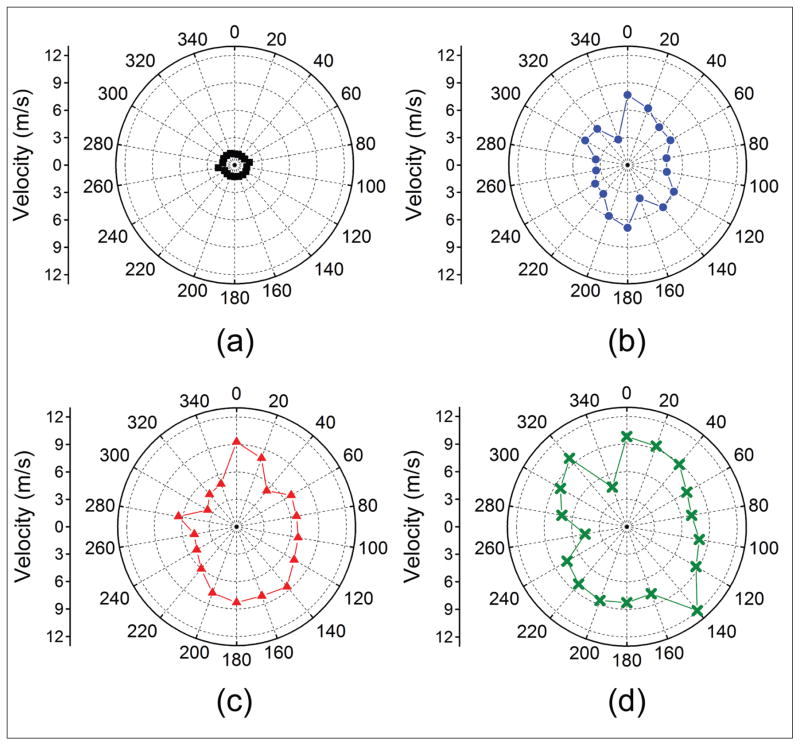
The results from a typical sample are provided with a summary of all seven samples following. For consistency, the shapes and colors in all of the plots correspond to the same IOP: the red square, blue circle, red triangle, and green cross represent data from 15, 20, 25, and 30 mm Hg, respectively. Figure A (available in the online version of this article) plots the angle-wise group velocity polar maps of the air-pulse–induced elastic wave as a function of IOP for a typical sample. The vertical axis (0°/180°) corresponds to the superior/inferior axis and the horizontal axis (90°/270°) was the nasal/temporal axis of the eye. The mean elastic wave velocities of all meridional angles for the typical sample at 15, 20, 25, and 30 mm Hg IOP were 2.06 ± 0.80, 3.33 ± 1.37, 4.41 ± 0.99, and 5.50 ± 1.13 m/s, respectively, where the error is the standard deviation of all meridional angles for a given IOP.
Figure A.
Group velocity polar maps of the air-pulse induced elastic wave for one typical porcine cornea at (A) 15, (B) 20, (C) 25, and (D) 30 mm Hg.
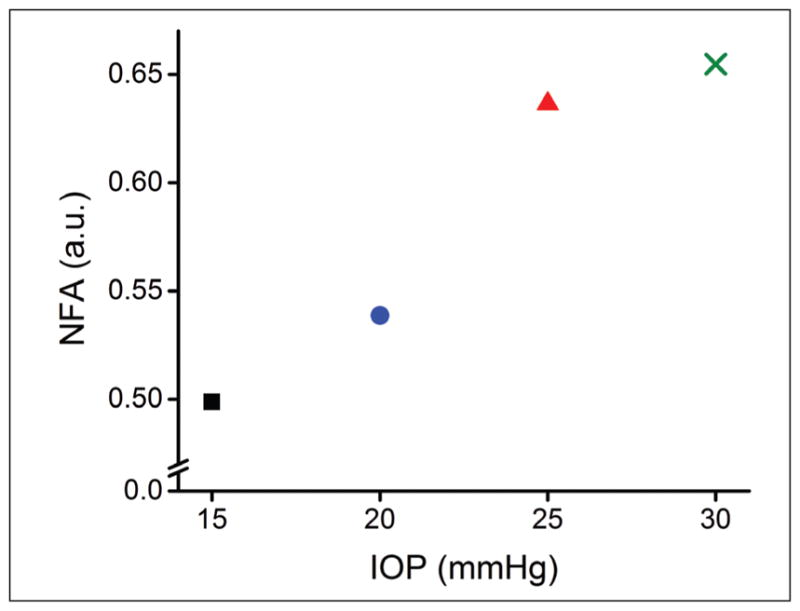
Figure 2 is a plot of the NFA quantified by Equation 2 as a function of IOP. The NFA at 15, 20, 25, and 30 mm Hg was 0.49, 0.54, 0.64, and 0.65, respectively.
Figure 2.

Normalized fractional anisotropy (NFA) as quantified by Equation 2 as a function of intraocular pressure (IOP). The red square, blue circle, red triangle, and green cross represent data from 15, 20, 25, and 30 mm Hg, respectively.
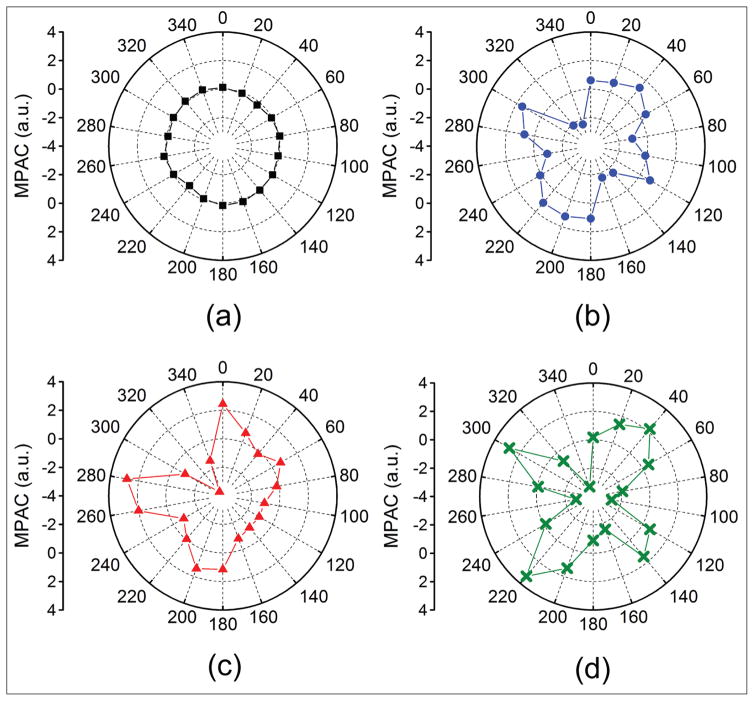
Figure B (available in the online version of this article) depicts the angle-wise MPAC of the typical sample as quantified by Equation 3 as a function of IOP. The standard deviation of the MPAC at 15, 20, 25, and 30 mm Hg was 0.15, 1.28, 1.59, 1.94, respectively.
Figure B.
Modified planar anisotropy coefficient (MPAC) for each meridional angle as a function of intraocular pressure at (A) 15, (B) 20, (C) 25, and (D) 30 mm Hg.
Figure 3 shows boxplots of the elastic wave group velocity, NFA, and standard deviation of the MPAC where the box represents the first quartile, median, and third quartile, the central square is the mean, and the whiskers are the 5th and 95th percentiles. The average group velocities for all seven porcine corneal samples at 15, 20, 25, and 30 mm Hg were 2.81 ± 1.35, 4.43 ± 0.79, 5.26 ± 0.92, and 6.00 ± 1.42 m/s, respectively, where the error is the inter-sample standard deviation. The correlation between IOP and group velocity, R2 = 0.96, was statistically significant (P < .05) by a paired two-tailed t test. Figure 3B plots the inter-sample NFA as quantified by Equation 2 for each IOP, which was 0.56 ± 0.05 at 15 mm Hg, 0.63 ± 0.05 at 20 mm Hg, 0.65 ± 0.04 at 25 mm Hg, and 0.67 ± 0.05 at 30 mm Hg. The inter-sample average of the standard deviation of the MPAC at 15, 20, 25, and 30 mm Hg was 0.72 ± 0.42, 1.29 ± 0.29, 1.54 ± 0.58, and 1.58 ± 0.40, respectively, which is depicted in Figure 3C. The correlation between IOP and NFA (R2 = 0.90) was statistically significant (P < .05), but the correlation between IOP and the standard deviation of the MPAC (R2 = 0.85) was not (P > .05).
Figure 3.
Summary of (A) air-pulse induced elastic wave group velocity, (B) normalized fractional anisotropy (NFA), and (C) standard deviation of the modified planar anisotropy coefficient (MPAC) for all seven porcine corneal samples as a function of intraocular pressure (IOP).
DISCUSSION
We assessed the mechanical anisotropy of in situ porcine corneas in the whole eye globe configuration as a function of IOP. A focused air-pulse induced elastic waves in the cornea, which were measured at stepped radial angles. The micrometer-scale displacements were detected by a home-built PhS-SSOCT system,11 and the elastic wave group velocity at each angle was quantified. Our results show that the stiffness and mechanical anisotropy of the porcine corneas increased as a function of IOP, which corroborates with previous work using supersonic shear-wave imaging.8 Moreover, the increased stiffness was primarily aligned with the superior/inferior axis of the eye, which is similar to the findings by supersonic shear-wave imaging.8
Although supersonic shear-wave imaging did reveal the mechanical anisotropy of the cornea in vivo, it required general anesthesia and subsequent ventilation and immersion of the cornea under water. The technique presented in this article is noncontact and would not require these methods. However, the acquisition time (approximately 30 seconds per meridian) is not suitable for the majority of in vivo investigations and further signal processing techniques will be required to remove motion artifacts that may increase uncertainties in OCE measurements. We recently demonstrated an ultra-fast noncontact OCE technique that directly imaged the elastic wave propagation in a few milliseconds with only a single excitation.17 This technique would drastically reduce the OCE acquisition time for anisotropic measurements and the number of air-pulse excitations, and could be used in a gating-style acquisition to minimize the influence of motion. Furthermore, the exposure limit for the cornea was not exceeded, demonstrating the feasibility for completely noninvasive in vivo elastic anisotropy measurements with OCE.
In addition to the increase in mechanical anisotropy, there was an overall increase in the elastic wave group velocity as IOP increased, which has been demonstrated by OCE previously.18 However, it has been shown that the mechanical properties of the cornea can influence the measured IOP19 and vice versa.18 Therefore, there is an intrinsic ambiguity whether a high stiffness or high IOP reading is due to one parameter or the other, but OCE can be used to differentiate corneas with the same measured stiffness but at different conditions by analyzing the elastic wave amplitude damping.18 However, the results in this work show that not only did the measured stiffness increase, but the mechanical anisotropy also increased. We recently showed that ultraviolet light-induced corneal collagen cross-linking does appear to increase the mechanical anisotropy even at an IOP of 15 mm Hg,20 and further investigating the mechanical anisotropy of diseased corneas21 and corneas that are altered by a therapy such as ultraviolet light-induced corneal collagen cross-linking 22 is a direction of our future work.
The mechanical anisotropy in this work was quantified by the NFA (Equation 2) and standard deviation of the MPAC (Equation 3). Although the NFA can provide a single number for an assessment of mechanical anisotropy, it cannot indicate the direction of the anisotropic characteristics. Hence, the anisotropy coefficient was modified to account for each meridional angle and the standard deviation of the MPAC was used to assess the mechanical anisotropy of the cornea. Both the NFA and standard deviation of the MPAC showed good correlation with IOP (R2 = 0.90 and 0.85, respectively). However, the correlation of the NFA with IOP was statistically significant (P < .05), whereas the correlation between the standard deviation of the MPAC and IOP was not statistically significant (P > .05). This may be due to the fact that the NFA is a single number for a given IOP but the MPAC is the standard deviation of 18 values and thus inherently carries more variance. However, the MPAC maps can easily demonstrate the mechanical anisotropic characteristics of the sample as in Figure B, where the MPAC at 15 mm Hg represents a circle with the majority of values close to 0, which is in contrast to the MPAC at higher IOPs.
In this study, only the group velocity was used as a metric for evaluating the elastic anisotropy. The Young’s modulus can be estimated from the group velocity as measured by OCE to provide a rapid first-order elasticity assessment.23 However, the mechanical models that use group velocity often assume the cornea is a flat thin plate. Our previous work has shown that the thickness and curvature can both affect the group velocity,24 so these parameters should be considered for accurate elasticity quantification. We have recently developed a modified Rayleigh-Lamb Frequency Equation that incorporates the thickness and fluid-solid interface at the corneal posterior surface.25 However, this model also assumes the cornea is a flat thin plate and does not account for its curvature. Moreover, the model assumes the sample is isotropic and homogeneous, further limiting its use. Development of a more robust mechanical model that incorporates the true geometry and anisotropy of the cornea and can map the biomechanical properties of the cornea is under development.
Acknowledgments
Supported in part by grants 1R01EY022362, 1R01HL120140, and U54HG006348 from the National Institutes of Health and PRJ71TN from DOD/NAVSEA.
The authors thank Mr. Chih-Hao Liu, Mr. Achuth Nair, Mr. Shezaan Noorani, and Ms. Raksha Raghunathan, who are all with the Department of Biomedical Engineering at the University of Houston, for their help with the optical coherence elastography measurements and data processing.
Footnotes
The authors have no financial or proprietary interest in the materials presented herein.
AUTHOR CONTRIBUTIONS
Study concept and design (MS, JL, ZH, CW, SRA, MDT, KVL); data collection (MS, JL, ZH); analysis and interpretation of data (MS, JL, ZH, CW, KVL); writing the manuscript (MS, ZH); critical revision of the manuscript (MS, JL, ZH, CW, SRA, MDT, KVL); statistical expertise (MS, JL, ZH, CW); administrative, technical, or material support (JL, KVL); supervision (JL, KVL)
References
- 1.Schmitt J. OCT elastography: imaging microscopic deformation and strain of tissue. Opt Express. 1998;3:199–211. doi: 10.1364/oe.3.000199. [DOI] [PubMed] [Google Scholar]
- 2.Wang S, Larin KV. Optical coherence elastography for tissue characterization: a review. J Biophotonics. 2015;8:279–302. doi: 10.1002/jbio.201400108. [DOI] [PMC free article] [PubMed] [Google Scholar]
- 3.Huang D, Swanson EA, Lin CP, et al. Optical coherence tomography. Science. 1991;254:1178–1181. doi: 10.1126/science.1957169. [DOI] [PMC free article] [PubMed] [Google Scholar]
- 4.Sticker M, Hitzenberger CK, Leitgeb R, Fercher AF. Quantitative differential phase measurement and imaging in transparent and turbid media by optical coherence tomography. Opt Lett. 2001;26:518–520. doi: 10.1364/ol.26.000518. [DOI] [PubMed] [Google Scholar]
- 5.Elsheikh A, Brown M, Alhasso D, Rama P, Campanelli M, Garway-Heath D. Experimental assessment of corneal anisotropy. J Refract Surg. 2008;24:178–187. doi: 10.3928/1081597X-20080201-09. [DOI] [PubMed] [Google Scholar]
- 6.Nguyen TD, Boyce BL. An inverse finite element method for determining the anisotropic properties of the cornea. Biomech Model Mechanobiol. 2011;10:323–337. doi: 10.1007/s10237-010-0237-3. [DOI] [PubMed] [Google Scholar]
- 7.Pinsky PM, van der Heide D, Chernyak D. Computational modeling of mechanical anisotropy in the cornea and sclera. J Cataract Refract Surg. 2005;31:136–145. doi: 10.1016/j.jcrs.2004.10.048. [DOI] [PubMed] [Google Scholar]
- 8.Nguyen TM, Aubry JF, Fink M, Bercoff J, Tanter M. In vivo evidence of porcine cornea anisotropy using supersonic shear wave imaging. Invest Ophthalmol Vis Sci. 2014;55:7545–7552. doi: 10.1167/iovs.14-15127. [DOI] [PubMed] [Google Scholar]
- 9.Twa MD, Li J, Vantipalli S, et al. Spatial characterization of corneal biomechanical properties with optical coherence elastography after UV cross-linking. Biomed Opt Express. 2014;5:1419–1427. doi: 10.1364/BOE.5.001419. [DOI] [PMC free article] [PubMed] [Google Scholar]
- 10.Wang S, Larin KV, Li JS, et al. A focused air-pulse system for optical-coherence-tomography-based measurements of tissue elasticity. Laser Phys Lett. 2013;10:075605. doi: 10.1088/1612-2011/10/7/075605. [DOI] [PMC free article] [PubMed] [Google Scholar]
- 11.Manapuram RK, Manne VGR, Larin KV. Development of phase-stabilized swept-source OCT for the ultrasensitive quantification of microbubbles. Laser Phys. 2008;18:1080–1086. [Google Scholar]
- 12.Wang S, Larin KV. Shear wave imaging optical coherence tomography (SWI-OCT) for ocular tissue biomechanics. Opt Lett. 2014;39:41–44. doi: 10.1364/OL.39.000041. [DOI] [PMC free article] [PubMed] [Google Scholar]
- 13.Song S, Huang Z, Wang RK. Tracking mechanical wave propagation within tissue using phase-sensitive optical coherence tomography: motion artifact and its compensation. J Biomed Opt. 2013;18:121505. doi: 10.1117/1.JBO.18.12.121505. [DOI] [PubMed] [Google Scholar]
- 14.Wang S, Lopez AL, 3rd, Morikawa Y, et al. Noncontact quantitative biomechanical characterization of cardiac muscle using shear wave imaging optical coherence tomography. Biomed Opt Express. 2014;5:1980–1992. doi: 10.1364/BOE.5.001980. [DOI] [PMC free article] [PubMed] [Google Scholar]
- 15.Couade M, Pernot M, Messas E, et al. In vivo quantitative mapping of myocardial stiffening and transmural anisotropy during the cardiac cycle. IEEE Trans Med Imaging. 2011;30:295–305. doi: 10.1109/TMI.2010.2076829. [DOI] [PubMed] [Google Scholar]
- 16.Lankford W, Snyder S, Bauscher J. New criteria for predicting the press performance of deep drawing sheets. Trans ASM. 1950;42:1197–1232. [Google Scholar]
- 17.Singh M, Wu C, Liu CH, et al. Phase-sensitive optical coherence elastography at 1.5 million A-Lines per second. Opt Lett. 2015;40:2588–2591. doi: 10.1364/OL.40.002588. [DOI] [PMC free article] [PubMed] [Google Scholar]
- 18.Li J, Han Z, Singh M, Twa MD, Larin KV. Differentiating untreated and cross-linked porcine corneas of the same measured stiffness with optical coherence elastography. J Biomed Opt. 2014;19:110502. doi: 10.1117/1.JBO.19.11.110502. [DOI] [PMC free article] [PubMed] [Google Scholar]
- 19.Liu J, Roberts CJ. Influence of corneal biomechanical properties on intraocular pressure measurement: quantitative analysis. J Cataract Refract Surg. 2005;31:146–155. doi: 10.1016/j.jcrs.2004.09.031. [DOI] [PubMed] [Google Scholar]
- 20.Singh M, Li J, Vantipalli S, et al. Noncontact elastic wave imaging optical coherence elastography (EWI-OCE) for evaluating changes in corneal elasticity due to cross-linking. IEEE J Sel Top Quantum Electron. 2015:(99):1-1. doi: 10.1109/JSTQE.2015.2510293. [DOI] [PMC free article] [PubMed] [Google Scholar]
- 21.Meek KM, Tuft SJ, Huang Y, et al. Changes in collagen orientation and distribution in keratoconus corneas. Invest Ophthalmol Vis Sci. 2005;46:1948–1956. doi: 10.1167/iovs.04-1253. [DOI] [PubMed] [Google Scholar]
- 22.Wollensak G, Spoerl E, Seiler T. Riboflavin/ultraviolet-a-induced collagen crosslinking for the treatment of keratoconus. Am J Ophthalmol. 2003;135:620–627. doi: 10.1016/s0002-9394(02)02220-1. [DOI] [PubMed] [Google Scholar]
- 23.Han Z, Li J, Singh M, et al. Quantitative methods for reconstructing tissue biomechanical properties in optical coherence elastography: a comparison study. Phys Med Biol. 2015;60:3531–3547. doi: 10.1088/0031-9155/60/9/3531. [DOI] [PMC free article] [PubMed] [Google Scholar]
- 24.Nestor CE, Ottaviano R, Reinhardt D, et al. Rapid reprogramming of epigenetic and transcriptional profiles in mammalian culture systems. Genome Biol. 2015;16:11. doi: 10.1186/s13059-014-0576-y. [DOI] [PMC free article] [PubMed] [Google Scholar]
- 25.Han Z, Aglyamov SR, Li J, et al. Quantitative assessment of corneal viscoelasticity using optical coherence elastography and a modified Rayleigh-Lamb equation. J Biomed Opt. 2015;20:20501. doi: 10.1117/1.JBO.20.2.020501. [DOI] [PMC free article] [PubMed] [Google Scholar]


